. 2017 Aug 1;127(8):3103-3113.
doi: 10.1172/JCI90147. Epub 2017 Jul 17.

A leptin-regulated circuit controls glucose mobilization during noxious stimuli

Affiliations

A leptin-regulated circuit controls glucose mobilization during noxious stimuli

Jonathan N Flak et al. J Clin Invest. .

Abstract

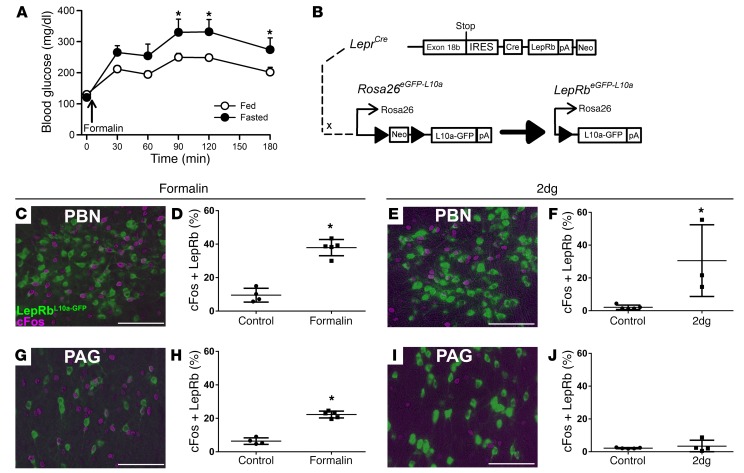
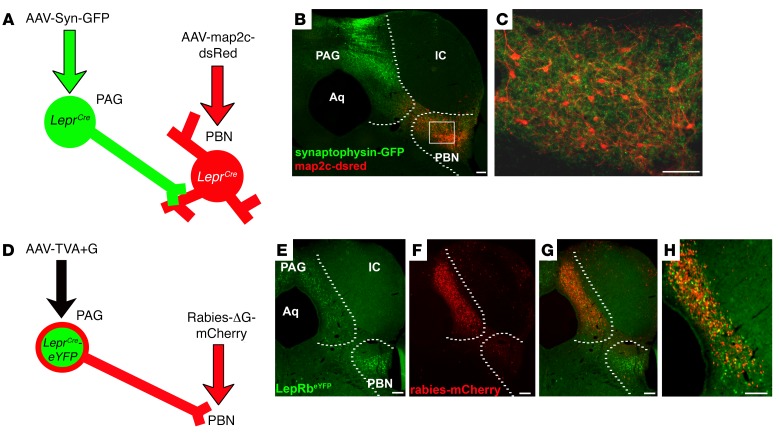
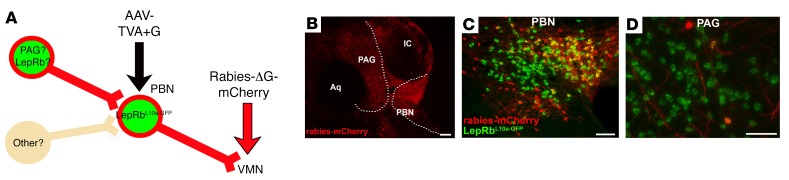
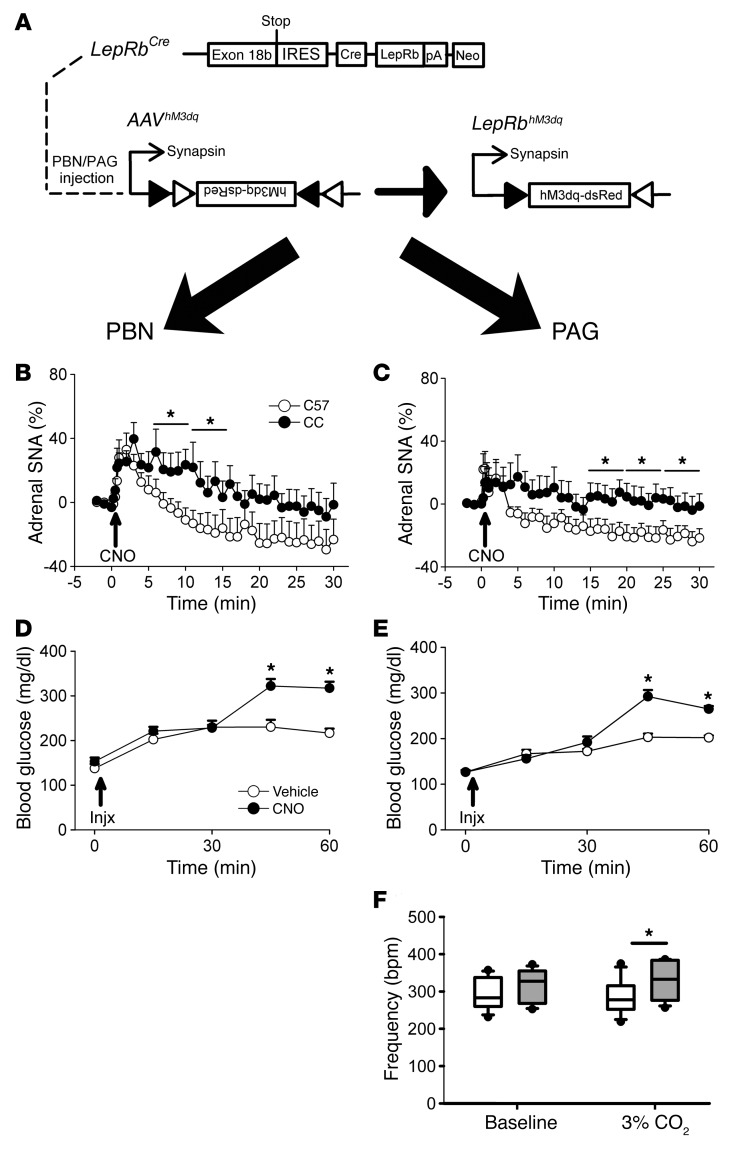
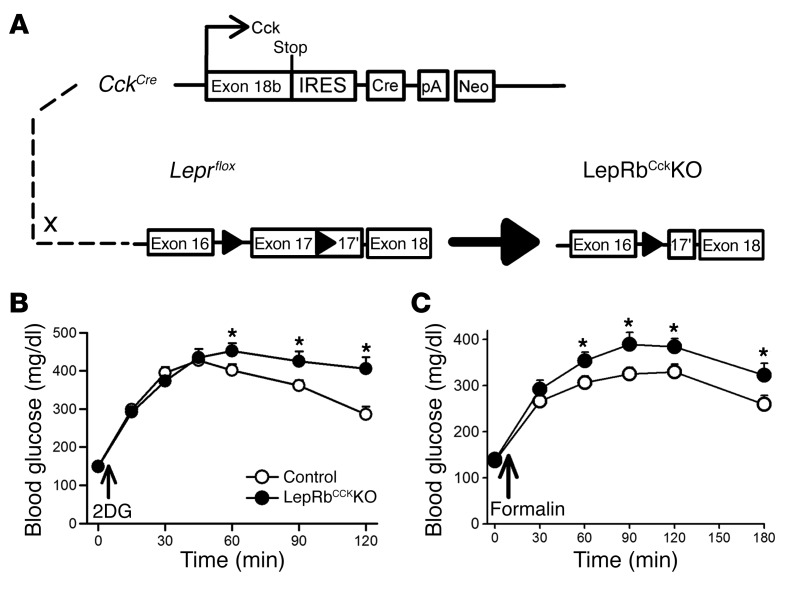
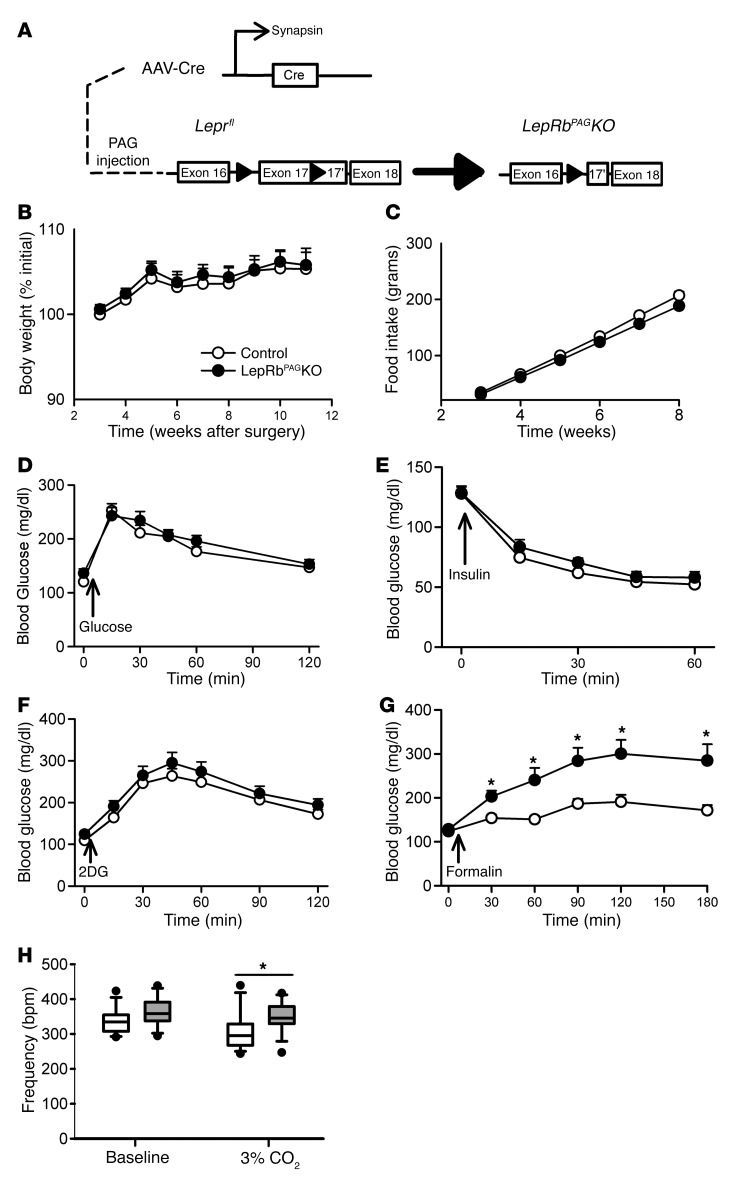
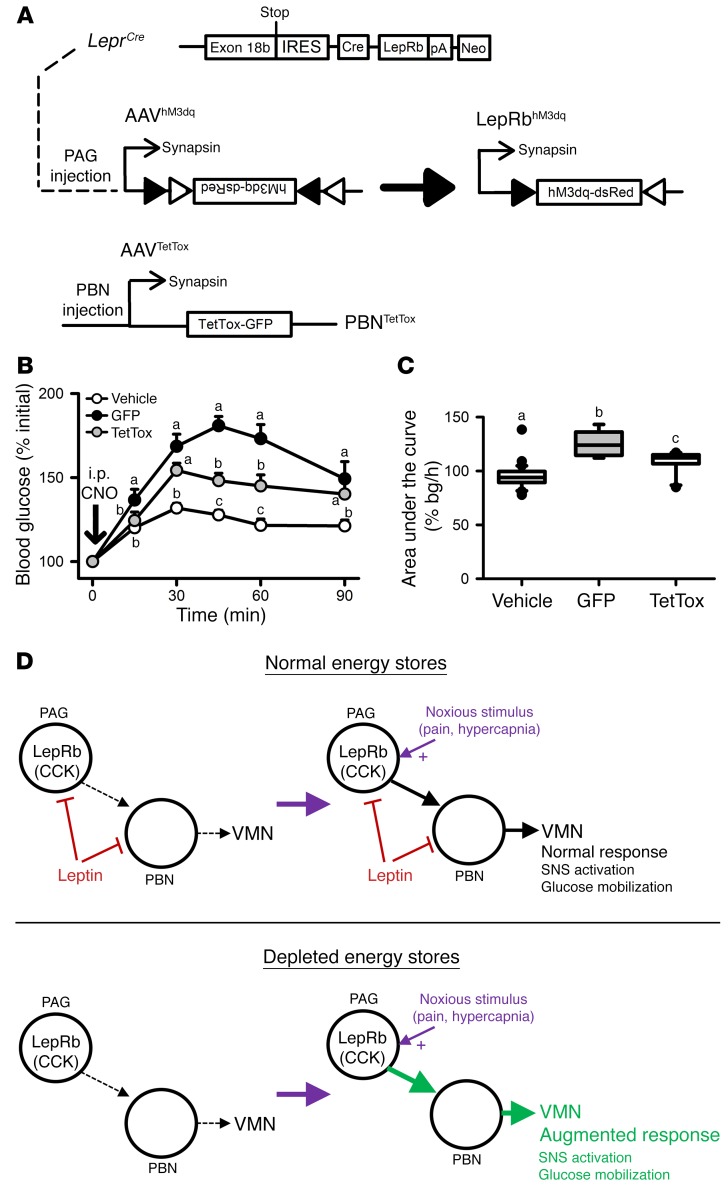
Adipocytes secrete the hormone leptin to signal the sufficiency of energy stores. Reductions in circulating leptin concentrations reflect a negative energy balance, which augments sympathetic nervous system (SNS) activation in response to metabolically demanding emergencies. This process ensures adequate glucose mobilization despite low energy stores. We report that leptin receptor-expressing neurons (LepRb neurons) in the periaqueductal gray (PAG), the largest population of LepRb neurons in the brain stem, mediate this process. Application of noxious stimuli, which often signal the need to mobilize glucose to support an appropriate response, activated PAG LepRb neurons, which project to and activate parabrachial nucleus (PBN) neurons that control SNS activation and glucose mobilization. Furthermore, activating PAG LepRb neurons increased SNS activity and blood glucose concentrations, while ablating LepRb in PAG neurons augmented glucose mobilization in response to noxious stimuli. Thus, decreased leptin action on PAG LepRb neurons augments the autonomic response to noxious stimuli, ensuring sufficient glucose mobilization during periods of acute demand in the face of diminished energy stores.


Conflict of interest statement

Conflict of interest: The authors have declared that no conflict of interest exists.

Figures

Figure 1
Figure 1. Hyperglycemic and c-Fos responses to noxious stimuli.
(A) Ad libitum–fed (n = 10) and overnight-fasted (n = 8) C57BL/6 mice were injected with intra–hind paw formalin (5%, 20 μl), and blood glucose concentrations were measured over the subsequent 3 hours. Data are plotted as mean ± SEM. (B) LepRbeGFP-L10a mice were treated with (C, D, G, H) intra–hind paw formalin (n = 4, veh; n = 5, formalin) as in A or (E, F, I, J) 2DG (n = 5, veh; n = 4, 2DG) (500 mg/kg, i.p.) and perfused under anesthesia. Brains were collected and sectioned; sections were stained for c-Fos (DAB, purple) and GFP (green). Images (C, E, G, I) are representative of 4–5 similar animals for each treatment. Graphs show colocalized cells/total LepRb cells, plotted as percentage, mean ± SEM. *P < 0.05. Scale bars: 100 μm. Data in panel A were analyzed by 2-way repeated-measures ANOVA with Fisher’s LSD post hoc test, and data in panels D, F, H, and J were analyzed by 1-tailed t test.
Figure 2
Figure 2. PAGLepRb neurons project to the PBN.
(A) LeprCre mice were injected with AAV-Syn-GFP into the PAG and AAV-map2c-dsRed into the PBN. The mice were perfused; (B and C) brains were collected, sectioned, and stained for GFP (green) and dsRed (red). Images are representative of 3 similar cases. Dashed lines indicate the boundaries of the PAG and PBN. Box in B shows the zoomed-in area represented in C. (D) LeprCre/eYFP mice were injected with AAV-TVA+G into the PAG; 2 weeks later, defective pseudotyped mCherry-expressing rabies virus (Rabies-ΔG-mCherry) was injected into the PBN. Five days later, mice were perfused and brains were collected and sectioned. Brain sections were stained for GFP (green) and dsRed (red) (E and F). Images are representative of 4 similar cases. H shows an enlarged image of G. Scale bars: 100 μm. IC, inferior colliculus; Aq, cerebral aqueduct.
Figure 3
Figure 3. PAGLepRb neurons innervate VMN-projecting PBNLepRb neurons.
(A) LepRbeGFP-L10a mice were injected with AAV-TVA+G into the PBN, followed by defective pseudotyped mCherry-expressing rabies virus (Rabies-ΔG-mCherry) injection into the VMN. Five days later, the mice were perfused, and brains were collected, sectioned, and stained for GFP (green) and dsRed (red) (BD). Shown are images representative of 4 similar cases: (B) PAG, PBN, and surrounding areas (mCherry only); (C) PBN (merged image); (D) PAG (merged image). Dashed lines in B denote the boundaries of the PAG and PBN. Scale bars: 100 μm.
Figure 4
Figure 4. Activation of PAGLepRb increases adrenal SNA, blood glucose, and respiratory responses to hypercapnia.
(A) LeprCre (CC) animals were injected with AAV-hM3Dq into the PBN (left panels) or PAG (right panels). (B and C) PBN (B) (n = 8, C57BL/6 [C57]; n = 6, CC) and PAG (C) (n = 7, C57BL/6; n = 9, CC) AAV-hM3Dq–injected C57BL/6 or LeprCre (Cre) animals were treated with CNO during SNA recording. Data were broken down into 5-minute bins for analysis; data are plotted as mean ± SEM; *P < 0.05. (D and E) PBN (D) or PAG (E) AAV-hM3Dq–injected LeprCre mice were injected with either CNO or vehicle and blood glucose sampled. Data are presented as mean ± SEM; *P < 0.05. (F) PAG-injected LeprCre mice were treated with either CNO or vehicle, and respiratory frequency was monitored at baseline and during exposure to 3% CO2 in a whole-body plethysmograph. Data are plotted as mean ± SEM; *P < 0.05. Data in panels BE were analyzed by 2-way repeated-measures ANOVA with Fisher’s LSD post hoc test. Data in panel F were analyzed using a 1-tailed t test.
Figure 5
Figure 5. LepRbCCKKO mice exhibit exaggerated hyperglycemic responses to formalin injection.
(A) LepRbCCKKO mice were generated by crossing CckCre onto the Leprfl background. (B) Leprfl/fl (control) (n = 12) and LepRbCCKKO (n = 10) mice were treated with 2DG (500 mg/kg, i.p.) and monitored for blood glucose. (C) A separate group of animals was treated with intra–hind paw formalin (5%, 20 μl) (n = 17, control; n = 13, LepRbCCKKO), and blood glucose was monitored. Data are plotted as mean ± SEM; *P < 0.05. Data in panels B and C were analyzed with 2-way repeated-measures ANOVA with Fisher’s LSD post hoc test.
Figure 6
Figure 6. Deleting LepRb in the PAG exaggerates hyperglycemic responses to formalin and respiratory responses to hypercapnia.
(A) Leprfl/fl mice on the Cre-inducible eGFP-L10a background were injected with AAV-Cre into the PAG to generate LepRbPAGKO mice (n = 13, control; 14, LepRbCCKKO). Body weight (B) and food intake (C) of control-injected and LepRbPAGKO mice were monitored weekly. In separate experiments, mice were treated with (D) glucose (2 g/kg, i.p.), (E) insulin (1.2 U/kg, i.p.), (F) 2DG (250 mg/kg, i.p.), and (G) formalin (20 μl, hind paw) and blood glucose concentrations were followed. (H) Respiratory rate was measured at baseline and following exposure to 3% CO2. Data are plotted as mean ± SEM; *P < 0.05. Data in panels BG were analyzed using 2-way repeated-measures ANOVA with Fisher’s LSD post hoc test. Data in panel H were analyzed using a 1-tailed t test.
Figure 7
Figure 7. PAGLepRb neurons act via the PBN to increase blood glucose.
(A) LeprCre mice were injected with AAV-hM3dq in the PAG and either a GFP-expressing control virus (n = 7) or AAV-TetTOX-GFP (n = 10) to constitutively express GFP or GFP plus TetTOX in the PBN, respectively. All mice were randomly assigned to receive vehicle control or CNO; mice received the other treatment the following week (B and C). Glycemic responses following vehicle injection were not different between groups and were thus combined into a single control group. (D) Our data demonstrate that PAGLepRb neurons act via the PBN to mobilize glucose and increase adrenal SNA when activated by noxious stimuli such as pain and hypercapnia. In the presence of sufficient energy stores, leptin inhibits these neurons to limit sympathetic activation and hyperglycemia to appropriate levels during the response to noxious stimuli. When energy stores are depleted, however, loss of leptin inhibition of PAGLepRb neurons augments sympathetic and glycemic responses to noxious stimuli to ensure a sufficient glucose mobilization in response to noxious stimuli, despite reduced overall sympathetic tone and the depletion of energy stores. Data are plotted as mean ± SEM; groups with different letters are significantly different. P < 0.05. Data in panel B were analyzed using 2-way repeated-measures ANOVA with Fisher’s LSD post hoc test. Data in panel C were analyzed using 1-way ANOVA with Fisher’s LSD post hoc test.

References

    1. Friedman JM, Halaas JL. Leptin and the regulation of body weight in mammals. Nature. 1998;395(6704):763–770. doi: 10.1038/27376. - DOI - PubMed
    1. Ahima RS, et al. Role of leptin in the neuroendocrine response to fasting. Nature. 1996;382(6588):250–252. doi: 10.1038/382250a0. - DOI - PubMed
    1. Schwartz MW, et al. Cooperation between brain and islet in glucose homeostasis and diabetes. Nature. 2013;503(7474):59–66. doi: 10.1038/nature12709. - DOI - PMC - PubMed
    1. Flak JN, Myers MG. Minireview: CNS Mechanisms of Leptin Action. Mol Endocrinol. 2016;30(1):3–12. doi: 10.1210/me.2015-1232. - DOI - PMC - PubMed
    1. Ring LE, Zeltser LM. Disruption of hypothalamic leptin signaling in mice leads to early-onset obesity, but physiological adaptations in mature animals stabilize adiposity levels. J Clin Invest. 2010;120(8):2931–2941. doi: 10.1172/JCI41985. - DOI - PMC - PubMed