Comparative Study
. 2017 Aug;19(8):891-903.
doi: 10.1038/ncb3570. Epub 2017 Jul 17.

Bone marrow adipocytes promote the regeneration of stem cells and haematopoiesis by secreting SCF

Affiliations
Comparative Study

Bone marrow adipocytes promote the regeneration of stem cells and haematopoiesis by secreting SCF

Bo O Zhou et al. Nat Cell Biol. 2017 Aug.

Abstract

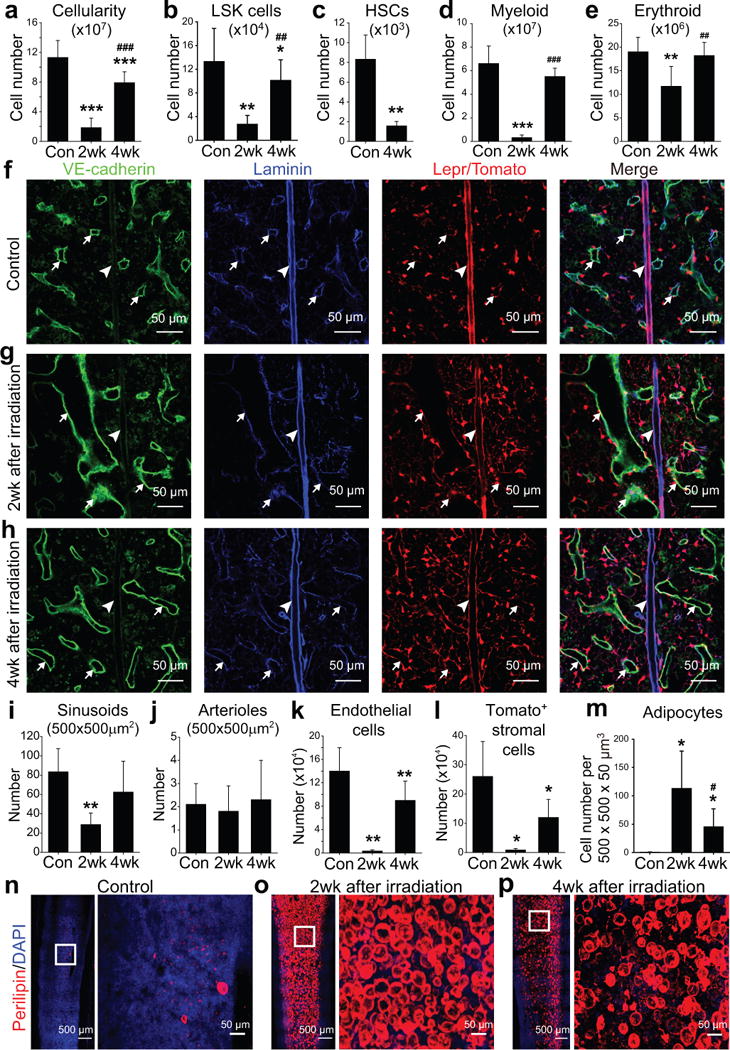
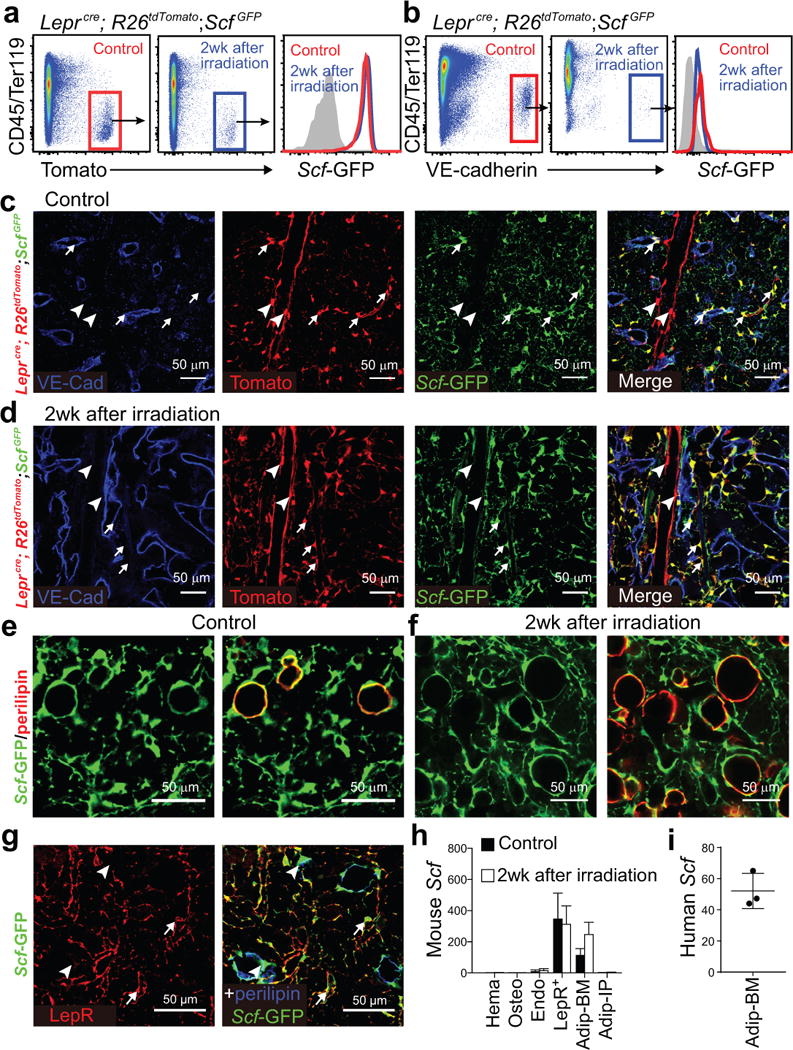
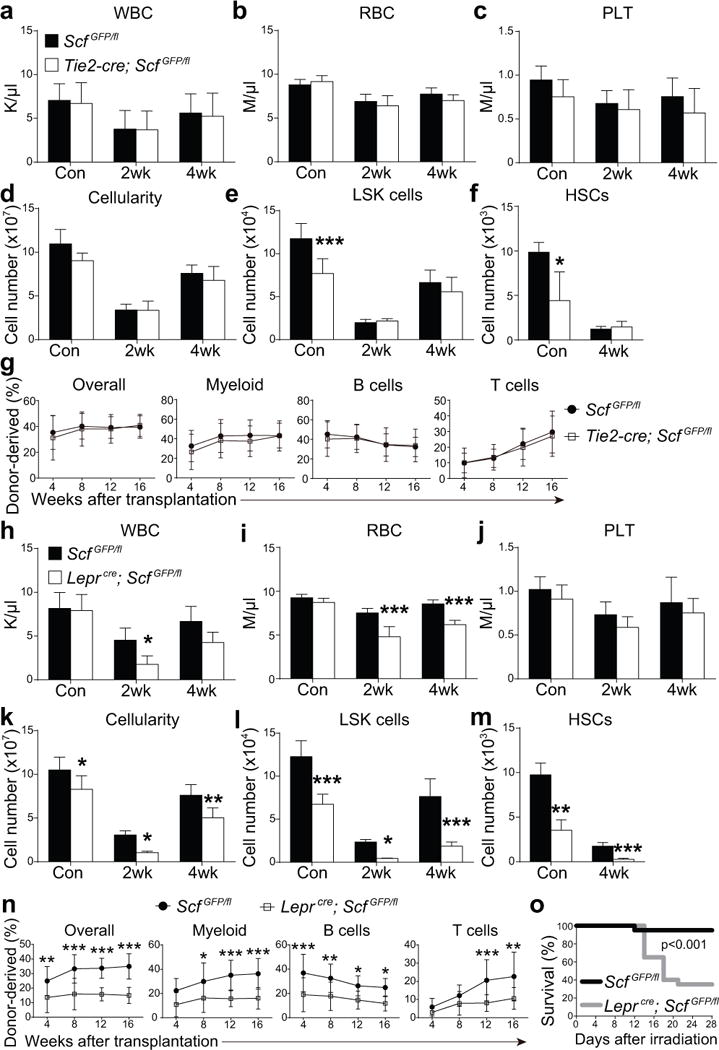
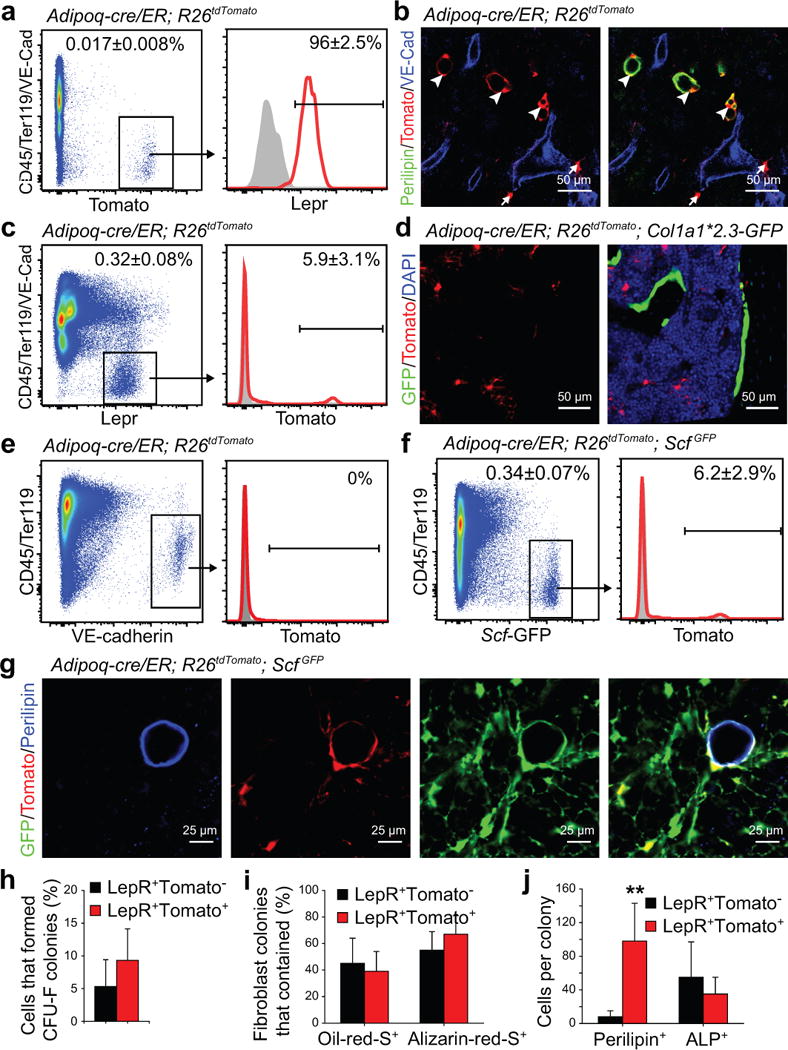
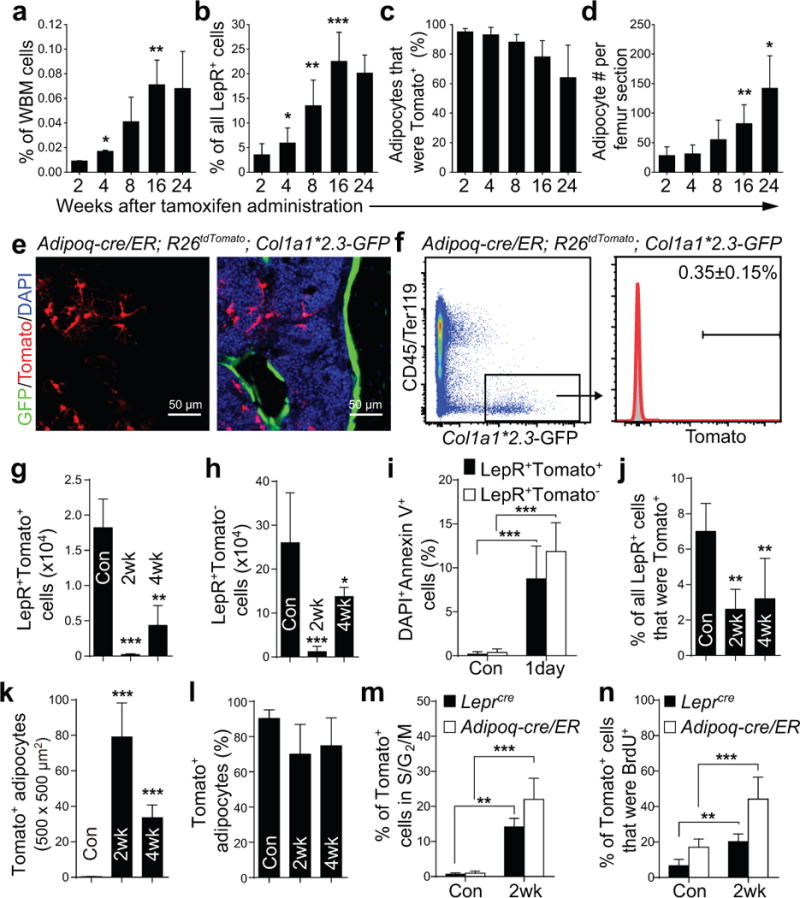
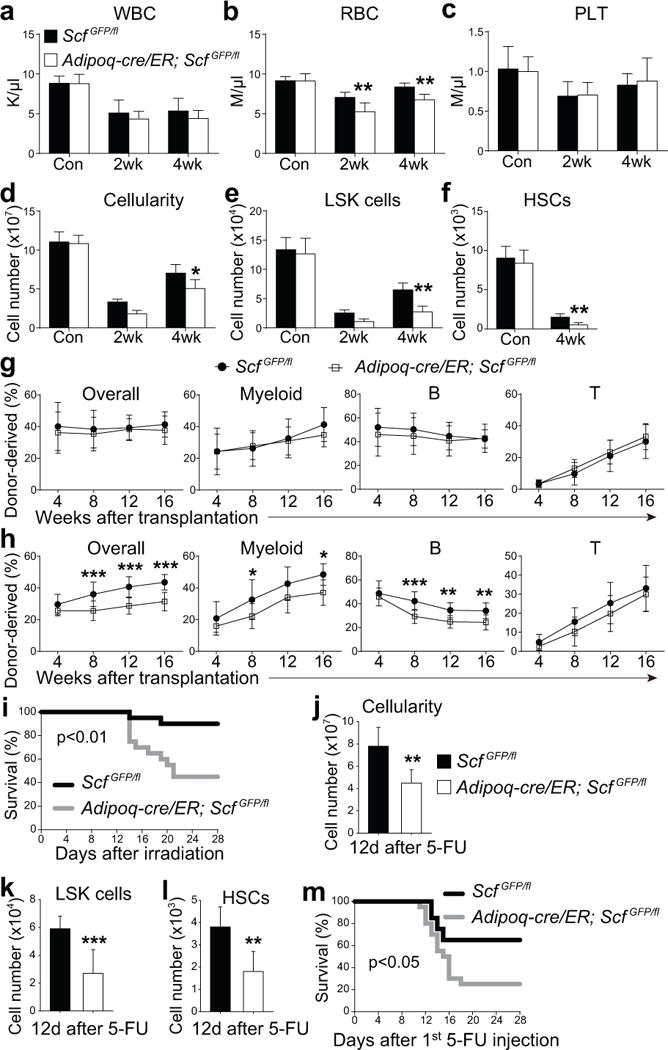
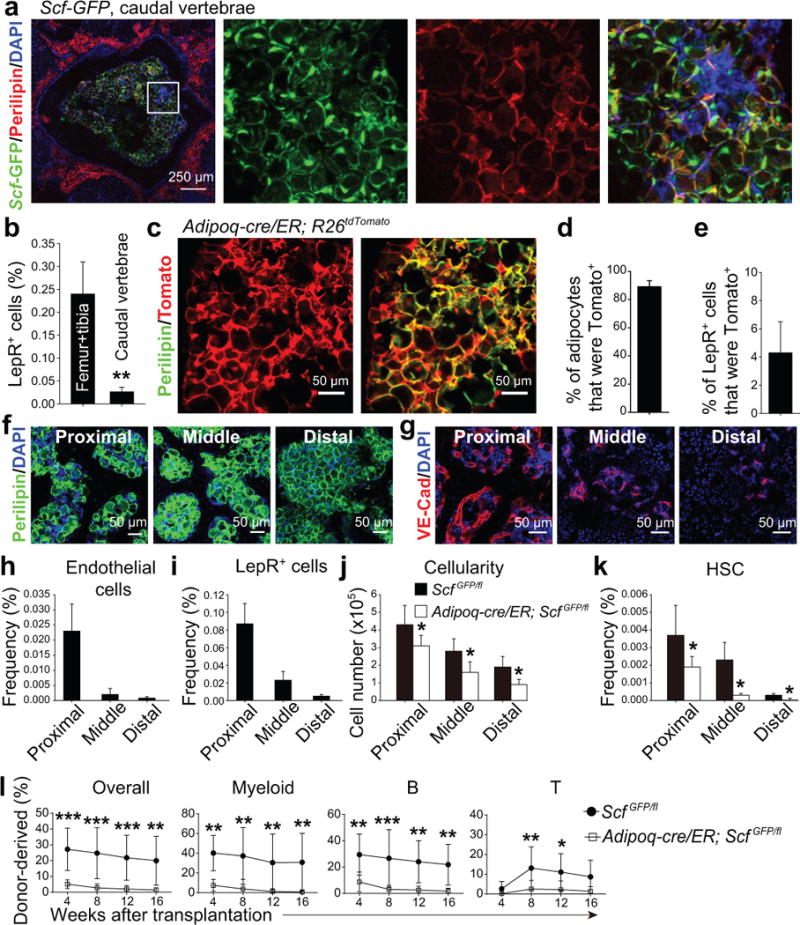
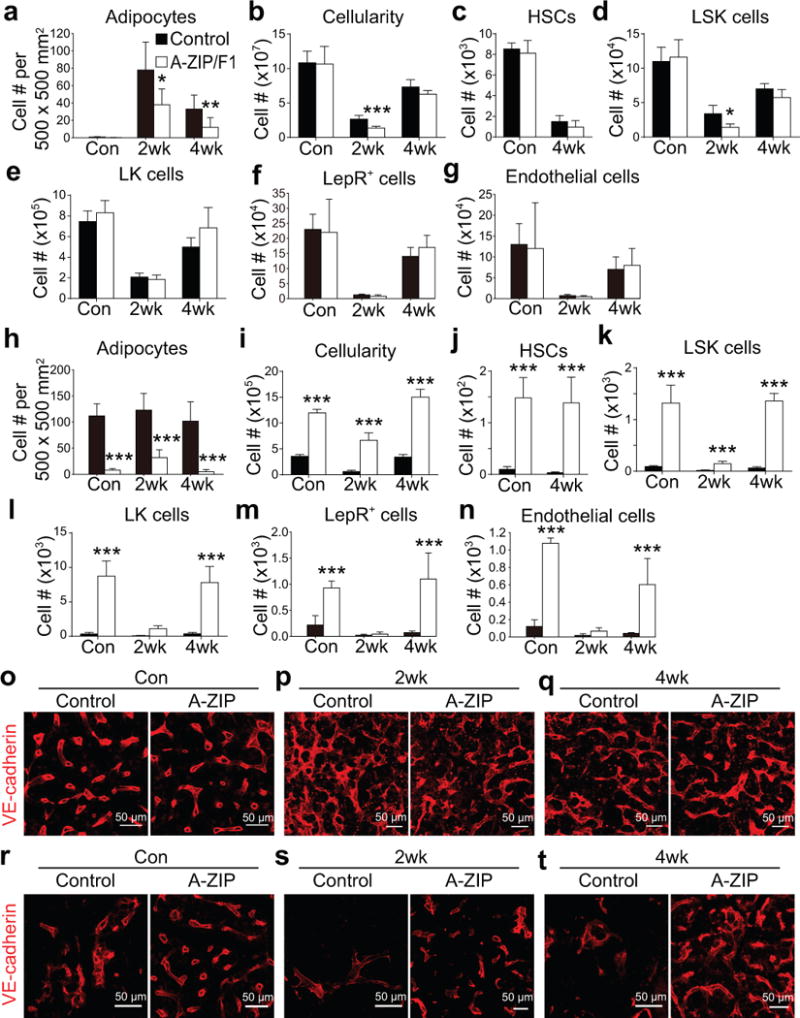
Endothelial cells and leptin receptor+ (LepR+) stromal cells are critical sources of haematopoietic stem cell (HSC) niche factors, including stem cell factor (SCF), in bone marrow. After irradiation or chemotherapy, these cells are depleted while adipocytes become abundant. We discovered that bone marrow adipocytes synthesize SCF. They arise from Adipoq-Cre/ER+ progenitors, which represent ∼5% of LepR+ cells, and proliferate after irradiation. Scf deletion using Adipoq-Cre/ER inhibited haematopoietic regeneration after irradiation or 5-fluorouracil treatment, depleting HSCs and reducing mouse survival. Scf from LepR+ cells, but not endothelial, haematopoietic or osteoblastic cells, also promoted regeneration. In non-irradiated mice, Scf deletion using Adipoq-Cre/ER did not affect HSC frequency in long bones, which have few adipocytes, but depleted HSCs in tail vertebrae, which have abundant adipocytes. A-ZIP/F1 'fatless' mice exhibited delayed haematopoietic regeneration in long bones but not in tail vertebrae, where adipocytes inhibited vascularization. Adipocytes are a niche component that promotes haematopoietic regeneration.


Figures

Figure 1
Figure 1. Irradiation disrupted sinusoids and depleted HSCs, endothelial cells, and LepR+ stromal cells while dramatically increasing adipocytes in the bone marrow
One million bone marrow cells from wild-type mice were transplanted into irradiated wild-type (a–e and m–p) or Leprcre; R26tdTomato (f–l) mice. Statistical significance was assessed using repeated measures one-way ANOVAs with Geisser-Greenhouse sphericity corrections along with Tukey’s multiple comparisons tests (a–e, i–m). * indicates statistical significance relative to control (Con) while # indicates statistical significance of differences between 2 and 4 weeks after irradiation (* or # P<0.05, ** or ## P<0.01, *** or ### P<0.001). All data represent mean±SD. (a–e) Flow cytometric analysis of mechanically dissociated bone marrow cells revealed significant reductions in bone marrow cellularity (a) and the numbers of LineageSca-1+c-kit+ (LSK) cells (b), CD150+CD48LineageSca-1+c-kit+ HSCs (c), Mac1+Gr-1+ myeloid cells (d) and Ter119+ erythroid cells (e) at 2 and/or 4 weeks after irradiation as compared to non-irradiated control mice. Cell numbers reflect two femurs and two tibias per mouse (n=5 mice/treatment from 5 independent experiments). (f–h) Confocal imaging of thin femur sections from non-irradiated Leprcre; R26tdTomato mice (control, f) or at 2 weeks (g) or 4 weeks (h) after irradiation and bone marrow transplantation. Arrows indicate sinusoidal blood vessels and arrowheads indicate arterioles. (i, j) The densities of VE-cadhernbrightlaminindim sinusoids (i) and VE-cadherindimlamininbright arterioles (j) were quantified in sections (n=5 mice/condition from 3 independent experiments). (k, l) Flow cytometric analysis of enzymatically dissociated bone marrow cells from Leprcre; R26tdTomato mice revealed significant reductions in the numbers of VE-cadherin+ endothelial cells (k) and Tomato+ stromal cells (l) after irradiation (n=4 mice/condition from 4 independent experiments). (m) Adipocyte numbers in thick femur sections from non-irradiated mice (Con) or mice at 2 or 4 weeks after irradiation (n=6 mice/condition from 3 independent experiments). (n–p) Whole-mount imaging of thick femur sections (50-μm) from non-irradiated mice (Control, n) or mice 2 (o) or 4 (p) weeks after irradiation and bone marrow transplantation. Adipocytes were identified based on anti-perilipin staining (n=6 mice/condition from 3 independent experiments).
Figure 2
Figure 2. Scf was highly expressed by LepR+ stromal cells and adipocytes in the bone marrow before and after irradiation
One million whole bone marrow cells from wild-type mice were transplanted into irradiated Leprcre; R26tdTomato; ScfGFP (a-d) or ScfGFP (e, f) mice. (a, b) Flow cytometric analysis of enzymatically dissociated bone marrow cells from Leprcre; R26tdTomato; ScfGFP mice showed that Scf-GFP was expressed at a high level by LepR+ stromal cells (a) and at a low level by endothelial cells (b) in non-irradiated mice (Control) and at 2 weeks after irradiation and bone marrow transplantation (representative results from 3 independent experiments). (c, d) Representative femur diaphysis sections showed Scf-GFP expression by Tomato+ stromal cells in the bone marrow of Leprcre; R26tdTomato; ScfGFP mice that were not irradiated (Control, c) or at 2 weeks after irradiation and bone marrow transplantation (d). Tomato+ cells around small arterioles and sinusoids (arrows) expressed Scf-GFP while Tomato+ cells around large arterioles (arrowheads) did not (representative results from 3 independent experiments). (e, f) Representative femur metaphysis sections showed Scf-GFP expression by perilipin+ adipocytes in non-irradiated mice (Control, e) and at 2 weeks after irradiation and bone marrow transplantation (f) (representative results from 6 independent experiments). Note that the subcellular distribution of perilipin and GFP differ. See Supplementary Fig. 2e for serial optical sections showing Scf-GFP expression by a periliplin+ adipocyte. (g) Confocal imaging of thin femur sections from non-irradiated ScfGFP mice co-stained with anti-LepR and anti-perilipin antibodies. LepR+ cells were Scf-GFP+ but perilipin negative (arrows). Perilipin+ cells were Scf-GFP+ but LepR negative (arrowheads; representative results from 3 independent experiments). (h, i) Quantitative RT-PCR analysis of Scf transcript levels (normalized to β-Actin) in CD45+/Ter119+ hematopoietic cells (Hema), Col1a1*2.3-GFP+ osteoblasts (Osteo), VE-cadherin+ endothelial cells (Endo), Tomato+CD45Ter119 bone marrow stromal cells from Leprcre; R26tdTomato mice (LepR+), bone marrow adipocytes (Adip-BM) and intraperitoneal adipocytes (Adip-IP) relative to unfractionated bone marrow cells in mouse (h) and human bone marrow (i). The Scf transcript level in unfractionated bone marrow cells was normalized to 1. Data represent mean±SD (n=3 mice (h) and n=3 human (i) samples, each from 3 independent experiments).
Figure 3
Figure 3. Scf from LepR+ stromal cells, but not endothelial cells, is necessary for hematopoietic regeneration and mouse survival after irradiation
(a–f) White blood cell (a) red blood cell (b), and platelet counts (c), as well as bone marrow (two femurs and two tibias per mouse) cellularity (d) and numbers of LineageSca-1+c-kit+ cells (e) and CD150+CD48LineageSca-1+c-kit+ HSCs (f) from paired Tie2-cre; ScfGFP/fl mice and ScfGFP/fl controls that were non-irradiated (Con) or analyzed 2 or 4 weeks after irradiation and bone marrow transplantation. n=5 mice/genotype/condition from 3 independent experiments. HSCs could not be detected at 2 weeks after irradiation. Two-way ANOVAs with Sidak’s multiple comparisons tests (a-e) or two-tailed Student’s t-tests with Holm-Sidak’s multiple comparisons test (f) were used to assess differences between Tie2-cre; ScfGFP/fl and ScfGFP/fl mice. (g) 106 donor bone marrow cells from the indicated primary recipient mice were transplanted 4 weeks after irradiation along with recipient-type competitor cells into irradiated secondary recipient mice (n=12 recipient mice/genotype from 3 independent experiments). Differences were assessed using two-way ANOVAs with Sidak’s multiple comparisons tests. (h–m) White blood cell (h) red blood cell (i), and platelet counts (j), as well as bone marrow cellularity (k) and numbers of LSK cells (l) and HSCs (m) from paired Lepr-cre; ScfGFP/fl mice and ScfGFP/fl controls that were non-irradiated (Con) or analyzed at 2 or 4 weeks after irradiation and bone marrow transplantation (n=5 mice/genotype/condition from 3 independent experiments). Two-way ANOVAs with Sidak’s multiple comparisons tests (h-l) or two-tailed Student’s t-tests with Holm-Sidak’s multiple comparisons test (m) were used to assess the statistical significance of differences between Lepr-cre; ScfGFP/fl and ScfGFP/fl mice. (n) 106 donor bone marrow cells from the indicated primary recipient mice were transplanted 4 weeks after irradiation along with recipient competitor cells into irradiated secondary recipient mice (n=12 recipient mice/genotype from 3 independent experiments). Differences were assessed using two-way ANOVAs with Sidak’s multiple comparisons test (*P<0.05, **P<0.01, ***P<0.001). (o) Mouse survival after irradiation and transplantation of 2×10⁵ whole bone marrow cells (n=20 mice/genotype/condition from 5 independent experiments). The Gehan-Breslow-Wilcoxon test was used to assess statistical significance. All data in Figure 3 represent mean±SD.
Figure 4
Figure 4. Adipoq-Cre/ER recombines in most adipocytes and in a subset of LepR+ stromal cells in the bone marrow
(a) 0.017±0.008% of bone marrow cells were Tomato+ in enzymatically dissociated bone marrow cells from Adipoq-cre/ER; R26tdTomato mice at 4 weeks after tamoxifen administration. (b) Adipoq-cre/ER; R26tdTomato mice exhibited Tomato expression by perilipin+ adipocytes (arrowheads) and a subset of perilipin negative stromal cells (arrows) in the bone marrow. (c) Only 5.9±3.1% of LepR+ stromal cells were Tomato+ in the bone marrow of Adipoq-cre/ER; R26tdTomato mice at 4 weeks after tamoxifen administration. (d) Tomato expression was rarely detected in bone-lining GFP+ osteoblasts from Adipoq-cre/ER; R26tdTomato; Col1a1*2.3-GFP mice. (e) Tomato expression was not detected in VE-cadherin+CD45/Ter119 endothelial cells in the bone marrow of Adipoq-cre/ER; R26tdTomato mice at 4 weeks after tamoxifen administration. (f) Only 6.2±2.9% of Scf-GFP+ stromal cells were Tomato+ in the bone marrow of Adipoq-cre/ER; R26tdTomato; ScfGFP mice at 4 weeks after tamoxifen administration. (g) While not detected by flow cytometry, perilipin+ adipocytes in bone marrow sections from Adipoq-cre/ER; R26tdTomato; ScfGFP mice were consistently positive for Scf-GFP and Tomato. (h) Percentages of LepR+Tomato or LepR+Tomato+ stromal cells from Adipoq-cre/ER; R26tdTomato mice that formed CFU-F colonies in culture. (i) Percentage of CFU-F colonies that contained Oil-red-O+ adipocytes or Alzarin-red-S+ osteoblastic cells. (j) The average numbers of perilipin+ adipocytes or alkaline phosphatase+ (ALP+) osteogenic cells that spontaneously differentiated per CFU-F colony after 1 week of culture in DMEM plus 20% FBS (n=53 colonies from 3 mice; 3 independent experiments). A two-way ANOVA with Sidak’s multiple comparisons test was used to assess statistical significance. **P<0.01. All data in Figure 4 represent mean±SD and representative images from n=3 mice in 3 independent experiments.
Figure 5
Figure 5. Adipoq-Cre/ER+ bone marrow stromal cells form adipocytes, but rarely osteoblasts, in vivo
(a–d) Percentages of whole bone marrow (WBM) cells (a; by flow cytometry), LepR+ stromal cells (b; by flow cytometry), or adipocytes (c; by microscopy in sections) that were Tomato+ in Adipoq-cre/ER; R26tdTomato mice at 2–24 weeks after tamoxifen administration. Numbers of adipocytes/section (d). Two-way ANOVAs with Sidak’s multiple comparisons tests were used to assess differences among consecutive ages (*P<0.05, **P<0.01, ***P<0.001). (e, f) Four months after tamoxifen treatment, Adipoq-cre/ER; R26tdTomato; Col1a1*2.3-GFP mice had only rare GFP+ osteoblasts that were Tomato+ in bone marrow sections (e) or by flow cytometry (f). (g, h) Based on flow cytometric analysis, the numbers of LepR+Tomato+ cells (g) and LepR+Tomato cells (h) declined in Adipoq-cre/ER; R26tdTomato mice after irradiation and bone marrow transplantation. Differences between non-irradiated (Con) and irradiated mice (at 2 or 4 weeks) were assessed by one-way ANOVAs with Dunnett’s multiple comparisons tests (data from panel g were log2-transformed) (**p<0.01, ***P<0.001). (i) Percentages of LepR+Tomato+ or LepR+Tomato cells that were also DAPI+Annexin V+ in enzymatically dissociated bone marrow cells from Adipoq-cre/ER; R26tdTomato mice one day after irradiation. A two-way ANOVA with Sidak’s multiple comparisons test was used to assess differences among treatments. (j, k) The percentages of LepR+ cells that were Tomato+ (j) declined in Adipoq-cre/ER; R26tdTomato mice after irradiation. In contrast, the number of Tomato+ adipocytes in femur sections increased after irradiation (k). The statistical significance of differences between non-irradiated (Con) and irradiated mice was measured using one-way ANOVAs with Dunnett’s multiple comparisons tests (data of 5k were log2-transformed) (**P<0.01, ***P<0.001). (l) The vast majority of bone marrow adipocytes were Tomato+ in non-irradiated and irradiated Adipoq-cre/ER; R26tdTomato mice. (m, n) Hoechst staining (m) and BrdU incorporation (14 day pulse, n) by Tomato+ bone marrow stromal cells in Adipoq-cre/ER; R26tdTomato mice or Leprcre; R26tdTomato mice that were non-irradiated (Con) or at 2 weeks after irradiation and bone marrow transplantation. Two-way repeated measures ANOVAs with Sidak’s multiple comparisons tests was used to assess differences among treatments. All data in Figure 5 represent mean±SD from n=5 mice/time point from 3 independent experiments.
Figure 6
Figure 6. Scf from adipocytes is required for the regeneration of HSCs and hematopoiesis and mouse survival after irradiation
(a–i) One million WBM cells were transplanted into irradiated Adipoq-cre/ER; ScfGFP/fl mice or ScfGFP/fl controls 2 weeks after tamoxifen treatment. Non-irradiated Adipoq-cre/ER; ScfGFP/fl mice and ScfGFP/fl controls mice were treated with tamoxifen 4 weeks before analysis. (a–f) White blood cell (a) red blood cell (b), and platelet counts (c), as well as WBM cellularity (d) and numbers of LSK cells (e) and HSCs (f) from Adipoq-cre/ER; ScfGFP/fl and ScfGFP/fl mice that were non-irradiated (Con) or analyzed at 2 or 4 weeks after irradiation and bone marrow transplantation. n=5 mice/genotype/condition from 3 independent experiments from two femurs and two tibias per mouse. HSCs could not be detected 2 weeks after irradiation. Two-way ANOVAs with Sidak’s multiple comparisons tests (a–e) or two-tailed Student’s t-tests with Holm-Sidak’s multiple comparisons test (f) were used to assess differences between Adipoq-cre/ER; ScfGFP/fl and ScfGFP/fl mice (*P<0.05, **P<0.01). (g) 3×10⁵ donor WBM cells from the femurs and tibias of non-irradiated mice were transplanted along with equal numbers of recipient WBM cells into irradiated recipient mice. (n=12 recipient mice/genotype from 3 independent experiments). Statistical significance was assessed using two-way repeated measures ANOVAs. (h) 106 donor WBM cells from the indicated primary recipient mice were transplanted 4 weeks after irradiation along with equal numbers of recipient WBM cells into irradiated secondary recipient mice (n=12 recipient mice/genotype from 3 independent experiments). Statistical significance was assessed using two-way repeated measures ANOVAs with Sidak’s multiple comparisons tests (*P<0.05, **P<0.01, ***P<0.001). (i) Mouse survival after irradiation and transplantation of 105 WBM cells (n=20 mice/genotype). (j–l) WBM cellularity (j) and numbers of LSK cells (k) and HSCs (l) from paired Adipoq-cre/ER; ScfGFP/fl mice and ScfGFP/fl controls 12 days after 5-FU treatment (*P<0.05; n=7 mice/genotype). Differences between genotypes were assessed using two-tailed Student’s t-tests. (m) Survival of Adipoq-cre/ER; ScfGFP/fl mice and ScfGFP/fl controls after two doses of 5-FU (on days 1 and 8; n=20 mice/genotype). A Gehan-Breslow-Wilcoxon test was used to assess statistical significance in panels i and m. All data in Figure 6 represent mean±SD.
Figure 7
Figure 7. Scf from adipocytes is required for normal HSC frequency and hematopoiesis in the caudal vertebrae of normal young adult mice
(a) Whole-mount imaging of cross sections of a caudal vertebra showing large numbers of adipocytes in the bone marrow (representative image from 3 independent experiments performed on CA1-CA5 vertebrae). (b) The frequency of LepR+ stromal cells in bone marrow from femurs and tibia versus caudal vertebrae (CA1-CA5). Data represent mean±SD from n=3 mice in 3 independent experiments. A two-tailed Student’s t-test was used to assess the statistical significance between genotypes (data were log2-transformed; **P<0.01). (c–e) Adipoq-Cre/ER recombined in nearly all adipocytes (c, d) but only in a small subset of LepR+ stromal cells (e) four weeks after tamoxifen treatment. Data represent mean±SD from n=3 mice in 3 independent experiments. (f) Adipocytes were abundant in all caudal vertebrae (proximal=CA1-CA5; middle=CA6-CA10; distal=CA11-CA16; representative images from 3 independent experiments). (g) Bone marrow vascularity progressively declined in caudal vertebrae (representative images from 3 independent experiments). (h–k) Endothelial cell frequency (h), LepR+ cell frequency (i), total bone marrow cellularity (j), and HSC frequency (k) in caudal vertebrae from Adipoq-cre/ER; ScfGFP/fl mice and ScfGFP/fl controls that had been administered tamoxifen 4 weeks earlier. Data represent mean±SD from n=5 mice/treatment in 3 independent experiments. Paired, two-tailed Student’s t-tests with Holm-Sidak’s multiple comparisons tests were used to assess statistical significance for j and k (*P<0.05). (l) Competitive reconstitution assay in which 5×10⁵ donor bone marrow cells from middle caudal vertebrae were transplanted along with equal numbers of recipient bone marrow cells into irradiated recipient mice. All data represent mean±SD (n=10 recipient mice/genotype from 3 independent experiments). The statistical significance of differences was assessed using two-way ANOVAs with Sidak’s multiple comparisons tests (*P<0.05, **P<0.01, ***P<0.001).
Figure 8
Figure 8. A-ZIP/F1 ‘fatless’ mice exhibit delayed hematopoietic regeneration in the femur but accelerated regeneration of hematopoiesis and vasculature in caudal vertebrae
All data in panels a-n represent mean±SD from n=5 mice (con and 4wk) or n=8 mice (2wk)/genotype/treatment from 3 independent experiments performed on leg bones (femurs+tibia; a–g) or caudal vertebrae (CA6-CA10, h-n) from non-irradiated control mice (con) or mice at 2 or 4 weeks after irradiation and bone marrow transplantation. Two-way ANOVAs (b–e) or repeated measures two-way ANOVAs (a and f-n) with Sidak’s multiple comparisons tests were used to assess the statistical significance of differences between control and A-ZIP/F1 mice (*P<0.05, **P<0.01, ***P<0.001). Data in some panels (a, b, e, and j–n) were log2-transformed prior to performing these statistical tests because the data showed unequal variance among groups. (a) Perilipin+ adipocytes in thin femur sections. (b–g) Numbers of total bone marrow cells (b), HSCs (c), LSK cells (d), LK cells (e), LepR+ stromal cells (f) and VE-cadherin+ endothelial cells (g) in two femurs and two tibias. (h) Perilipin+ adipocytes in thin caudal vertebra sections. (i–n) Numbers of total bone marrow cells (i), HSCs (j), LSK cells (k), LK cells (l), LepR+ stromal cells (m) and VE-cadherin+ endothelial cells (n) per caudal vertebra. (o–q) Confocal imaging of thin femur sections from control and A-ZIP/F1 mice that were non-irradiated (Con) or analyzed at 2 or 4 weeks after irradiation and bone marrow transplantation. (images are representative of 3 mice/genotype/condition from 3 independent experiments). (r–t) Confocal imaging of thin caudal vertebra sections from control and A-ZIP/F1 mice that were non-irradiated (Con) or analyzed at 2 or 4 weeks after irradiation and bone marrow transplantation. (n=3 mice/genotype/condition from 3 independent experiments).

Comment in

References

    1. Ding L, Saunders TL, Enikolopov G, Morrison SJ. Endothelial and perivascular cells maintain haematopoietic stem cells. Nature. 2012;481:457–62. - PMC - PubMed
    1. Ding L, Morrison SJ. Haematopoietic stem cells and early lymphoid progenitors occupy distinct bone marrow niches. Nature. 2013;495:231–5. - PMC - PubMed
    1. Acar M, et al. Deep imaging of bone marrow shows non-dividing stem cells are mainly perisinusoidal. Nature. 2015;526:126–30. - PMC - PubMed
    1. Zhou BO, Yue R, Murphy MM, Peyer JG, Morrison SJ. Leptin-receptor-expressing mesenchymal stromal cells represent the main source of bone formed by adult bone marrow. Cell Stem Cell. 2014;15:154–68. - PMC - PubMed
    1. Greenbaum A, et al. CXCL12 in early mesenchymal progenitors is required for haematopoietic stem-cell maintenance. Nature. 2013;495:227–30. - PMC - PubMed

Publication types

MeSH terms