. 2017 Jul 17:3:17105.
doi: 10.1038/nplants.2017.105.

Light triggers PILS-dependent reduction in nuclear auxin signalling for growth transition

Affiliations

Light triggers PILS-dependent reduction in nuclear auxin signalling for growth transition

Chloé Béziat et al. Nat Plants. .

Erratum in

Abstract

The phytohormone auxin induces or represses growth depending on its concentration and the underlying tissue type. However, it remains unknown how auxin signalling is modulated to allow tissues transiting between repression and promotion of growth. Here, we used apical hook development as a model for growth transitions in plants. A PIN-FORMED (PIN)-dependent intercellular auxin transport module defines an auxin maximum that is causal for growth repression during the formation of the apical hook. Our data illustrate that growth transition for apical hook opening is largely independent of this PIN module, but requires the PIN-LIKES (PILS) putative auxin carriers at the endoplasmic reticulum. PILS proteins reduce nuclear auxin signalling in the apical hook, leading to the de-repression of growth and the onset of hook opening. We also show that the phytochrome (phy) B-reliant light-signalling pathway directly regulates PILS gene activity, thereby enabling light perception to repress nuclear auxin signalling and to control growth. We propose a novel mechanism, in which PILS proteins allow external signals to alter tissue sensitivity to auxin, defining differential growth rates.


Conflict of interest statement

Competing interests

The authors declare no competing financial interests.

Figures
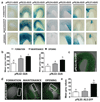
Figure 1
Figure 1. PILS expression during apical hook development.
a, Expression patterns of pPILS1-7::GUS during the formation, maintenance and opening phases. Scale bars, 100 µm. b, Quantification of GUS expression of pPILS2::GUS-GFP (left panel) and pPILS3::GUS-GFP (right panel) expressing seedlings during formation, maintenance and opening phases (n=10) The region of quantification considered was the apical hook zone (inner and outer sides) c, Confocal imaging of asymmetric pPILS2::GUS-GFP signal in apical hooks in maintenance phase. Scale bar: 100 µm. d, Confocal imaging of pPILS5::GUS-GFP during the 3 phases. The white rectangle delimits the region of interest (ROI) used for quantification which depicts spreading of the signal into the apical hooks during opening. e, Quantification of mean grey values of pPILS5 activity in the depicted ROI. The formation, maintenance and opening phases correspond to 15, 40 and 80 hours after germination, respectively. Error bars represent standard error of the mean. Statistical significance was evaluated by one-way ANOVA followed by multiple comparisons Tukey´s test. Distinct letters indicate statistically significant differences (p<0,05).
Figure 2
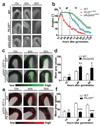
Figure 2. PILS2 and PILS5 requirements for apical hook development.
a, Representative pictures of apical hooks in dark-grown wild type (WT), PILS5OX and pils2 pils5 seedlings during formation (15 hours), maintenance (40 hours) and early opening (60 hours). Scale bars, 300 µm. b, Kinetics of apical hook development in WT, PILS5OX and pils2 pils5 dark-grown seedlings (n≥12). Dashed lines represent the duration of the different phases. F: Formation M: Maintenance O: Opening. Statistical significance was evaluated by non-linear regression and a subsequent Extra Sum of squares F test. End of maintenance phase (X0) and speed of opening (K) were compared to WT (see Supplementary Fig. 2b). *** denotes p<0.0001 for both parameters. c,e, DR5 promoter activity in pils2pils5 (c) and in PILS5OX (e) seedlings compared to WT seedlings at 15, 40 and 60 hours. Colour code (black to green or red) depicts low to high signal intensity of pDR5rev::GFP and pDR5rev::RFP1er. Scale bars, 100 µm. d,f, Quantification of mean grey values of the DR5 promoter activity in pils2pils5 (d) as well as PILS5OX (f) compared to WT seedlings at 15, 40 and 60 hours (n≥5). The region of interest (ROI) was delimited in the inner side of the apical hook quantifying the auxin maxima. Error bars represent standard error of the mean. Statistical significance was evaluated with two-way ANOVA followed by Bonferroni post-hoc test comparing the 2 genotypes of interest at the respective phases; the p value is indicated by *p< 0.05, **p<0.001 ***p<0.0001; ns: non significant; PILS5OX: p35S::PILS5:GFP.
Figure 3
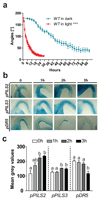
Figure 3. Light-induced apical hook opening correlates with elevated PILS expression.
a, Kinetics of apical hook opening in WT in the dark or after light exposure (n=25). Statistical significance was evaluated by non-linear regression and a subsequent Extra Sum of squares F test. Speed of opening (K) of WT in dark was compared to WT in light (see Supplementary Fig. 2a). *** denotes p<0.0001 b, Expression patterns of pPILS2::GUS, pPILS3::GUS and pDR5::GUS in apical hook maintenance phase of dark-grown seedlings or after 1, 2 or 3 hours of light exposure. Scale bars, 100 µm. c, GUS quantification of the respective lines and treatments (n≥8). The region of quantification was the apical hook region. Error bars represent standard error of the mean. Statistical significance was evaluated by one-way ANOVA followed by multiple comparisons Tukey´s test. Distinct letters indicate statistically significant differences (p<0,05). Each transgenic line was analysed independently (indicated by dashed lines).
Figure 4
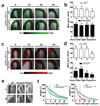
Figure 4. Light-induced apical hook opening is PILS-dependent manner.
a,c, DR5 promoter activity kinetics in pils2 pils5 (a) and PILS5OX seedlings (c) compared to WT seedlings in the dark and after 1 to 3 hours of light exposure. Colour code (black to green or red) depicts low to high signal intensity of pDR5rev::GFP/RFPer. Scale bars, 100 µm. b,d, Quantification of mean grey values of the DR5 promoter activity in pils2pils5 (b) as well as PILS5OX (d) compared to WT seedlings in the dark, and after 1 to 3 hours of light exposure (n≥5). The region of interest (ROI) was delimited in the inner side of the hooks. Error bars represent standard error of the mean. Statistical significance was evaluated by one-way ANOVA followed by multiple comparisons Tukey´s test. Distinct letters indicate statistically significant differences (p<0,05). e, Representative pictures of apical hooks dark-grown or after being exposed 5 hours to light in wild type (WT), pils2 pils5, PILS5OX seedlings. Scale bars, 150 µm f, Kinetics of apical hook opening during light exposure in pils2 pils5 and PILS5OX dark-grown seedling compared to WT (n=15) . Error bars represent standard error of the mean. Statistical significance was evaluated by non-linear regression and a subsequent Extra Sum of squares F test. Speed of opening (K) was compared to WT (see Supplementary Fig. 2a). *** denotes p<0.0001. PILS5OX: p35S::PILS5:GFP.
Figure 5
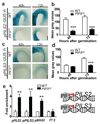
Figure 5. Phytochrome interacting factor 5 represses PILS expression.
a,c, Expression patterns of pPILS2::GUS (a) or pPILS3::GUS (c) in WT and PIF5OX dark grown seedlings at 40 and 72 hours after germination. Scale bars, 100 µm. b,d, Quantification of GUS expression of pPILS2::GUS (b) and pPILS3::GUS (d) in WT and PIF5OX dark grown seedlings at 40 and 72 hours after germination (n=10). e, ChIP analysis of PIF5-HA binding to PILS2 and PILS3 promoters in PIF5OX-HA as compared to WT. G-box of WAG2 (pWAG2) and 3’UTR of FT were used as a positive and negative control, respectively. The data presented are from 3 independent biological ChIP experiments (left panel). Mode of action of PIF5-HA on PILS2 and PILS3 promoters (right panel). Error bars represent standard error of the mean. Statistical significance was evaluated with two-way ANOVA followed by Bonferroni post-hoc test; the p values are indicated by *p<0.05, **p<0.001 ***p<0.0001. PIF5OX: p35S::PIF5:HA
Figure 6
Figure 6. phyB/PIF5 pathway regulates PILS dependent growth transition during apical hook early opening.
a-d, Kinetics of apical hook development in WT, phyB, PILS5OX, and PILS5OX phyB dark-grown seedlings (a); in WT, PILS3OX, PIF5OX, and PILS3OX PIF5OX expressing dark-grown seedlings (b); in WT, PILS3OX, PIF5OX, and PILS3OX PIF5OX expressing seedlings (exposed to light at the end of maintenance phase) (c); and in WT, pils3, pif5, pils3 pif5 expressing dark-grown seedlings (d) (n≥12). Statistical significance was evaluated by non-linear regression and a subsequent Extra Sum of squares F test. End of maintenance phase (X0) and speed of opening (K) (see Supplementary Fig. 2b) were compared to PILS5OX phyB (a), or PILS3OX PIF5OX (b) or pils3 pif5 (d). Significance of X0 is most informative here and hence indicated in the graphs a,b,d *p<0.05, **p<0.001 ***p<0.0001; ns: non significant; However, K was also highly significant (p<0.0001) for all kinetics excepted WT compared to PILS5OX phyB (p<0.05). In c, speed of opening (K) were compared to PILS3OX PIF5OX and is indicated in the graph ***p<0.0001. Error bars represent standard error of the mean. e, Model illustrations: phyB/PIF5 light perception module directly impacts on PILS2 and PILS3 transcription, controlling auxin-dependent growth transition (repression to promotion) for apical hook opening (left panel). During the formation phase of the apical hook, growth is repressed which correlates with a progressive increase in auxin signalling in a PIN dependent manner. Ethylene is able to prolong this repression. During the maintenance phase, no growth is occurring. Light induces PILS expression terminates the maintenance phase and induces growth by decreasing auxin signalling. PILS5OX: p35S::PILS5:GFP. PILS3OX: p35S::GFP:PILS3. PIF5OX: p35S::PIF5:HA

References

    1. Dharmasiri N, Dharmasiri S, Estelle M. The F-box protein TIR1 is an auxin receptor. Nature. 2005;435:441–445. - PubMed
    1. Kepinski S, Leyser O. The Arabidopsis F-box protein TIR1 is an auxin receptor. Nature. 2005;435:446–451. - PubMed
    1. Rosquete MR, Barbez E, Kleine-Vehn J. Cellular auxin homeostasis: gatekeeping is housekeeping. Molecular plant. 2012;5:772–786. - PubMed
    1. Evans ML, Ishikawa H, Estelle MA. Responses of Arabidopsis roots to auxin studied with high temporal resolution: comparison of wild type and auxin-response mutants. Planta. 1994;194:215–222.
    1. Abbas M, Alabadí D, Blázquez MA. Differential growth at the apical hook: all roads lead to auxin. Front Plant Sci. 2013;4:441. - PMC - PubMed

MeSH terms

LinkOut - more resources