. 2017 Sep;49(9):1403-1407.
doi: 10.1038/ng.3917. Epub 2017 Jul 17.

The promise of discovering population-specific disease-associated genes in South Asia

Affiliations

The promise of discovering population-specific disease-associated genes in South Asia

Nathan Nakatsuka et al. Nat Genet. 2017 Sep.

Abstract

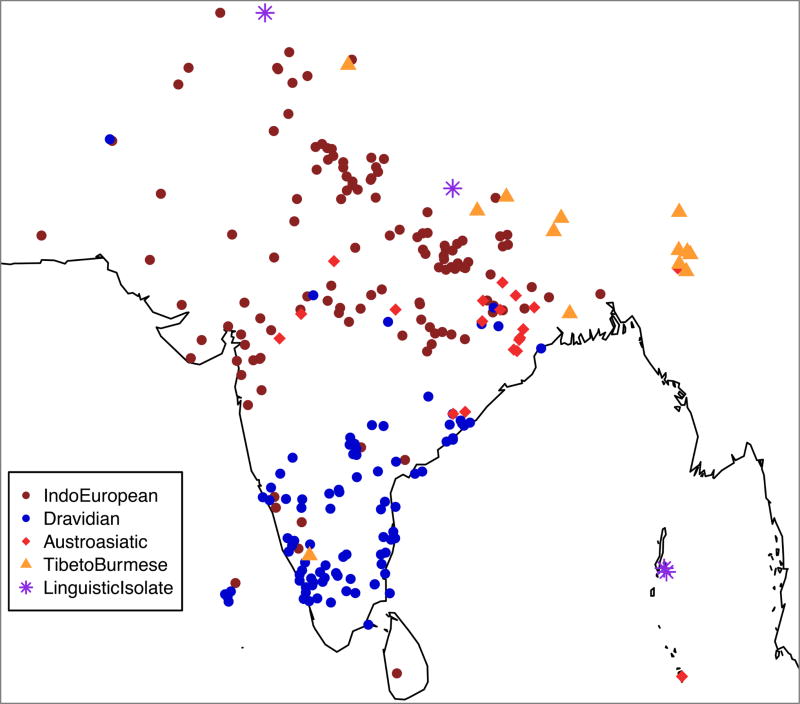
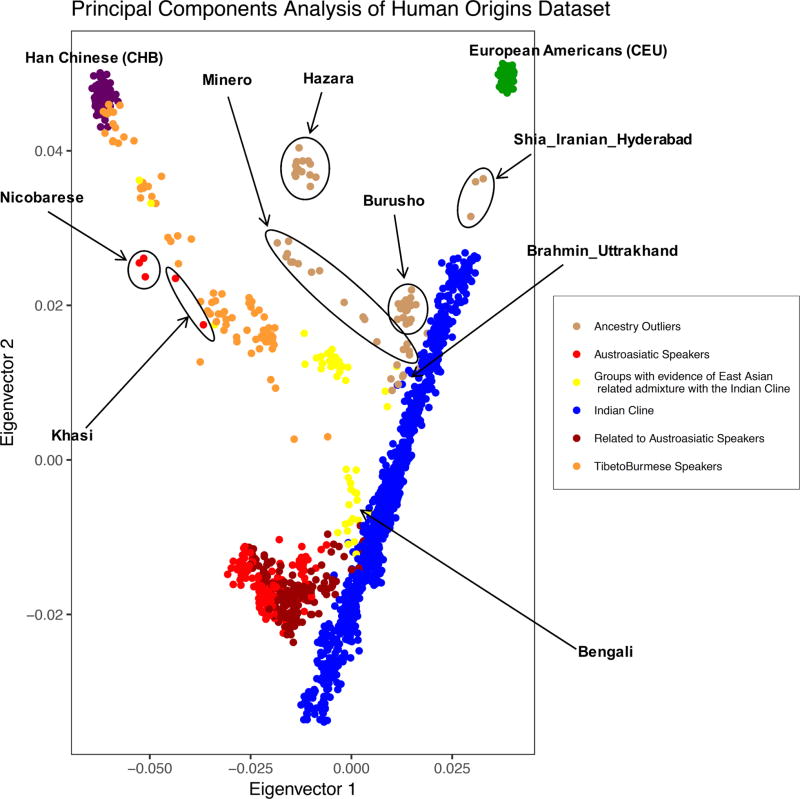
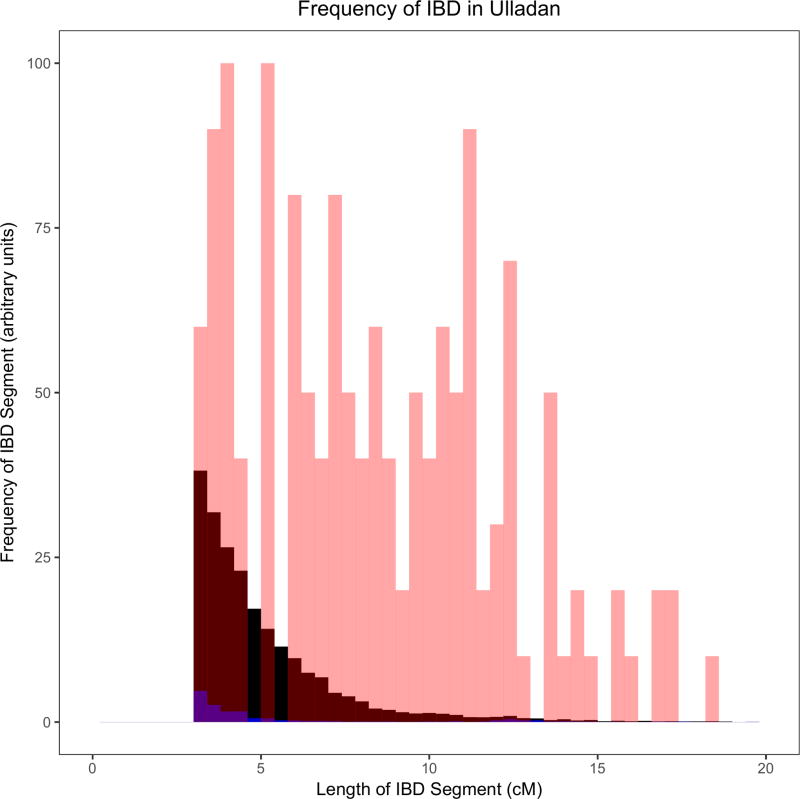
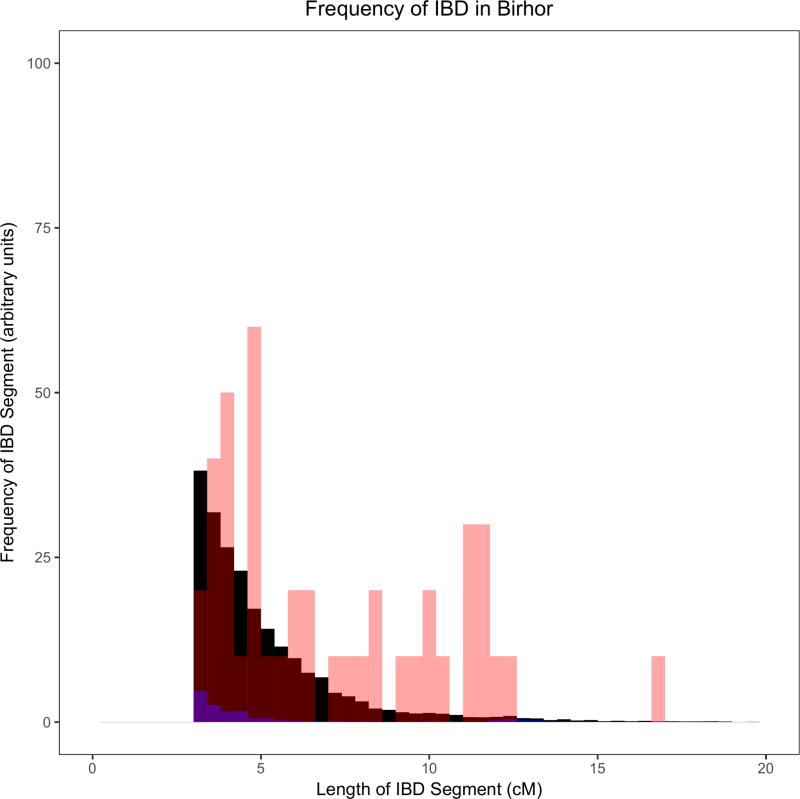
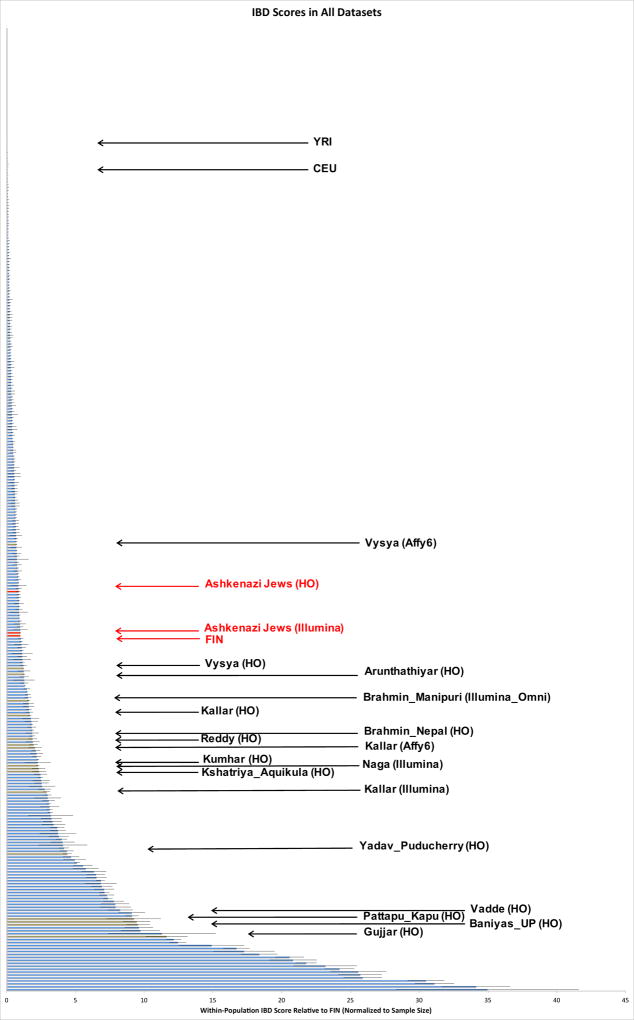
The more than 1.5 billion people who live in South Asia are correctly viewed not as a single large population but as many small endogamous groups. We assembled genome-wide data from over 2,800 individuals from over 260 distinct South Asian groups. We identified 81 unique groups, 14 of which had estimated census sizes of more than 1 million, that descend from founder events more extreme than those in Ashkenazi Jews and Finns, both of which have high rates of recessive disease due to founder events. We identified multiple examples of recessive diseases in South Asia that are the result of such founder events. This study highlights an underappreciated opportunity for decreasing disease burden among South Asians through discovery of and testing for recessive disease-associated genes.


Conflict of interest statement

Competing Financial Interests:

The authors declare no competing financial interests.

Figures

Figure 1
Figure 1. Dataset overview
(a) Sampling locations for all analyzed groups. Each point indicates a distinct group (random jitter was added to help in visualization at locations where there are many groups). (b) PCA of Human Origins dataset along with European Americans (CEU) and Han Chinese (CHB). There is a large cluster (blue) of IndoEuropean and Dravidian speaking groups that stretch out along a line in the plot and that are well-modeled as a mixture of two highly divergent ancestral populations (the “Indian Cline”). There is another larger cluster of Austroasiatic speakers (light red) and groups that cluster with them genetically (dark red). Finally, there are groups with genetic affinity to East Asians that include Tibeto-Burman speakers (orange) and those that speak other languages (yellow).
Figure 2
Figure 2. Example histograms of IBD segments to illustrate the differences between groups with founder events of different magnitudes
These histograms provide visual illustrations of differences between groups with different IBD scores. As a ratio relative to Finns (FIN; black), these groups (red) have IBD scores of: (A) ~26 in Ulladan, (B) ~3 in Birhor, (C) ~0.9 in Ashkenazi Jews, and (D) ~0.1 in Mahadeo_Koli. In each plot, we also show European Americans (CEU) with a negligible founder event in blue. Quantification of these founder events is shown in Figure 3 and Supplementary Table 5. The IBD histograms were normalized for sample size by dividing their frequency by {(2n2)n}, where n is the number of individuals in the sample. All data for the figure are based on the Human Origins dataset.
Figure 3
Figure 3. IBD scores relative to Finns (FIN)
Histogram ordered by IBD score, roughly proportional to the per-individual risk for recessive disease due to the founder event. (These results are also given quantitatively for each group in Online Table 1.) We restrict to groups with at least two samples, combining data from all four genotyping platforms onto one plot. Data from Ashkenazi Jews and Finns are highlighted in red, and from South Asian groups with significantly higher IBD scores than that of Finns and census sizes of more than a million in brown. Error bars for each IBD score are standard errors calculated by weighted block jackknife over each chromosome. YRI=Yoruba (West African); CEU=European American.

References

    1. Mastana SS. Unity in diversity: an overview of the genomic anthropology of India. Ann Hum Biol. 2014;41:287–99. - PubMed
    1. Bamshad MJ, et al. Female gene flow stratifies Hindu castes. Nature. 1998;395:651–2. - PubMed
    1. Basu A, et al. Ethnic India: a genomic view, with special reference to peopling and structure. Genome Res. 2003;13:2277–90. - PMC - PubMed
    1. Reich D, Thangaraj K, Patterson N, Price AL, Singh L. Reconstructing Indian population history. Nature. 2009;461:489–94. - PMC - PubMed
    1. Lim ET, et al. Distribution and medical impact of loss-of-function variants in the Finnish founder population. PLoS Genet. 2014;10:e1004494. - PMC - PubMed