. 2017 Sep;18(9):1046-1057.
doi: 10.1038/ni.3795. Epub 2017 Jul 17.

Translation is actively regulated during the differentiation of CD8+ effector T cells

Affiliations

Translation is actively regulated during the differentiation of CD8+ effector T cells

Koichi Araki et al. Nat Immunol. 2017 Sep.

Abstract

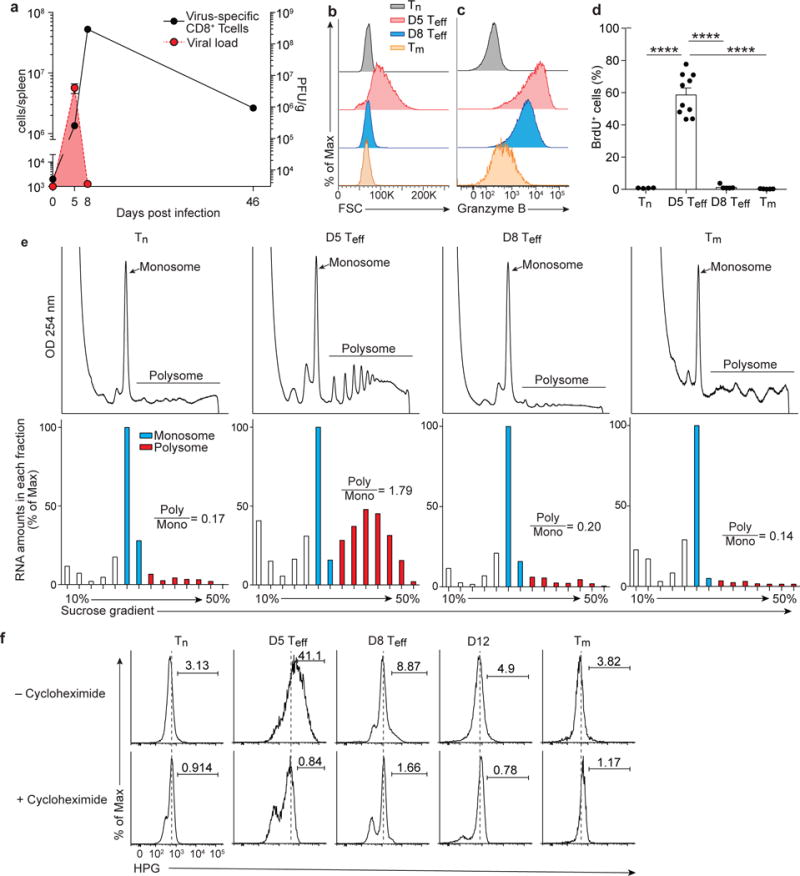
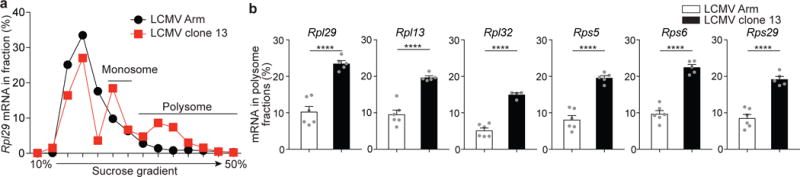
Translation is a critical process in protein synthesis, but translational regulation in antigen-specific T cells in vivo has not been well defined. Here we have characterized the translatome of virus-specific CD8+ effector T cells (Teff cells) during acute infection of mice with lymphocytic choriomeningitis virus (LCMV). Antigen-specific T cells exerted dynamic translational control of gene expression that correlated with cell proliferation and stimulation via the T cell antigen receptor (TCR). The translation of mRNAs that encode translation machinery, including ribosomal proteins, was upregulated during the T cell clonal-expansion phase, followed by inhibition of the translation of those transcripts when the CD8+ Teff cells stopped dividing just before the contraction phase. That translational suppression was more pronounced in terminal effector cells than in memory precursor cells and was regulated by antigenic stimulation and signals from the kinase mTOR. Our studies show that translation of transcripts encoding ribosomal proteins is regulated during the differentiation of CD8+ Teff cells and might have a role in fate 'decisions' involved in the formation of memory cells.


Conflict of interest statement

Competing financial interests

The authors declare no competing financial interests.

Figures

Figure 1
Figure 1. Activated CD8+ T cells change their translational activity
(a) Number of virus-specific P14 CD8+ T cells and viral titer in spleen of LCMV-infected mice in which P14 transgenic CD8+ T cells were adoptively transferred before infection. (b and c) Histograms showing cell size (forward scatter: FSC, b) and granzyme B expression (c) in P14 CD8+ T cells obtained from spleen of LCMV-infected mice. (d) BrdU+ P14 cells in spleen 2 hours after BrdU i.p. injection into LCMV-infected mice. (e) Sucrose ultracentrifugation showing polysome profiles (top) of purified P14 cells in spleen at the indicated time points. The amount of RNA (bottom) isolated from the sucrose gradients of the polysome profiles. The number showing ratio of the RNA amount of polysomes to that of monosomes (Poly/Mono). Signals observed in polysome fractions of the memory polysome profile data are noise due to much lower numbers of P14 cells. (f) Histograms showing HPG (homopropargylglycine) staining in P14 cells of splenocytes cultured with HPG for 2 hours in the presence or absence of cycloheximide. Naive P14 cells were obtained from uninfected P14 transgenic mice. Effector and memory P14 cells (40–60 days after infection) were obtained from LCMV-Arm infected mice in which naive P14 cells were adoptively transferred before infection. Data are representative of at least three independent experiments with samples pooled from 3–10 mice for each time point (a, e), or are representative of two independent experiments (n=3–6 mice per group) (b, c, f). Data in (d) were obtained from two independent experiments (n=4–10). Tn, D5 Teff, D8 Teff, and Tm indicate naive, day 5 effector, day 8 effector, and memory CD8+ T cells, respectively. Error bars are mean +/− s.e.m. ****p<0.0001 (one-way ANOVA).
Figure 2
Figure 2. Translational activity of Ifng in effector CD8+ T cells is distinct from that of Tbx21
(a, f) qRT-PCR data showing mRNA expression of Ifng (a) and Tbx21 (f) in total mRNA isolated from P14 cells in spleen. (b, c, g, h) qRT-PCR data showing the amount of Ifng (b) or Tbx21 (g) mRNA in fractions of sucrose gradient of P14 cell lysate, calculated as a percentage of the total in all fractions. The portion in polysome fractions, Ifng (c) or Tbx21 (h), *p<0.05 (unpaired t-test). (d) IFN-γ protein levels in serum after LCMV infection, *p<0.05, **p<0.01, ****p<0.0001 (one-way ANOVA). (e) Direct ex vivo intracellular cytokine staining (ICS) showing the frequency of IFN-γ+ cells in P14 cells of splenocytes harvested at days 5 and 8 after infection, **p<0.01 (unpaired t-test). Naive P14 cells were obtained from uninfected P14 transgenic mice. Effector P14 cells were obtained from LCMV-Arm infected mice in which naive P14 cells were adoptively transferred before infection. Data of mRNA distribution in the sucrose gradient are representative of 3 independent experiments with samples pooled from 3-10 mice per each time point (b and g). The mRNA levels in total mRNA (a and f) and polysome fractions (c and h) was calculated from the 3 independent experiments. Data of IFN-γ protein levels in serum (d) were obtained from two independent experiments (n=5–10 per each time point). n=6 per each time point for direct ex vivo ICS (e). Error bars are mean +/− s.e.m. Tn, D5 Teff, D8 Teff indicate naive, day 5 effector, and day 8 effector CD8+ P14 T cells, respectively.
Figure 3
Figure 3. Genome-wide translational activity in CD8+ T cells
(a) Relationship between gene expression levels in total mRNA microarray data and translation activity, calculated by dividing expression values in polysome-associated mRNA microarray data by those in total mRNA microarray data. Red dot plots showing 4 groups of genes; I) low mRNA levels, efficient recruitment to polysome, II) low mRNA levels, inefficient recruitment to polysome, III) high mRNA levels, efficient recruitment to polysome, IV) high mRNA levels, inefficient recruitment to polysome. Tn, D5 Teff, and D8 Teff indicate naive, day 5 effector and day8 effector P14 CD8+ T cells. (b) Metascape analysis showing corresponding biological processes associated with genes in 4 groups categorized in (a). Effector P14 CD8+ T cells were purified from spleen of LCMV-infected mice, in which naive P14 cells were adoptively transferred before infection. Naive P14 cells were purified from uninfected P14 transgenic mice. Total RNA was isolated before sucrose gradient separation. Total RNA and polysome-associated RNA were analyzed by microarray. Data are from three independent experiments with samples pooled from 3-10 mice per each time point.
Figure 4
Figure 4. Translatome reveals translatinally regulated genes in CD8+ T cells
(a) Microarray analysis showing correlation of the fold changes of gene expression of effector P14 CD8+ T cells relative to that of naive P14 CD8+ T cells in total mRNA (x-axis) and polysome-associated mRNA (y-axix), D5 Teff / Tn (top), D8 Teff / Tn (bottom). Pearson correlation r2 and p-values are shown.(b) Bar graphs showing the percentage of translationally regulated genes (fold change of translation activity; <−1.5 fold change or >1.5 fold change) among gene probes transcriptionally up-regulated (>2 fold change), down-regulated (<−2 fold change), or unchanged in effector P14 CD8+ T cells compared to naive P14 CD8+ T cells, D5 Teff / Tn (top), D8 Teff / Tn (bottom). The number of gene probes is shown next to the bars. (c) Venn diagram showing overlap of translationally regulated genes in day 5 effector and day 8 effector P14 CD8+ T cells compared to naive P14 cells identified in b. Tn, D5 Teff, D8 Teff indicate naive, day 5 effector, and day 8 effector CD8+ P14 T cells, respectively. Microarray data in Fig. 3 were used for this analysis.
Figure 5
Figure 5. Translational regulation links to cellular activity during effector CD8+ T cell differentiation
(a) Gene set enrichment analysis (GSEA) showing biological themes and pathways up- or down-regulated in total or polysome-associated RNA (Tn vs D5 Teff, Tn vs D8 Teff, and D5 Teff vs D8 Teff). Gene sets were obtained from Molecular Signatures Database (MSigDB); c2 canonical pathways, c5 gene ontology, and hallmark gene sets were combined. Mutually overlapping gene sets cluster together. Each row represents an individual gene set. Heat maps showing FDR values of GSEA data. (b) Classification of genes responsible for translationally downregulated-gene sets (ribosome/translation, biosynthetic process/translation initiation, panel (a)) in D8 Teff cells in comparison with either Tn or D5 Teff cells. (c) Corresponding gene ontology terms by metascape analysis for genes responsible for translational upregulation of the immune related gene set cluster in panel (a) in D8 Teff cells compared to D5 Teff cells. (d) Corresponding gene ontology terms for translationally up- or down-regulated genes identified from GSEA analysis using immune signature database (ImmuneSigDB) in D8 Teff cells compared to D5 Teff cells (see supplementary Fig. 3). Microarray data in Fig. 3 were used for this analysis. Tn, D5 Teff, D8 Teff indicate naive, day 5 effector, and day 8 effector CD8+ P14 T cells, respectively.
Figure 6
Figure 6. Translational inhibition of ribosomal protein mRNAs and 5′TOP mRNAs occurs in effector CD8+ T cells when the cells stopped dividing just before the contraction phase
(a) Fold changes of translation activity of all ribosomal protein (RP) mRNAs in effector CD8+ T cells compared to all mRNAs in microarray data obtained in Fig. 3. μ and σ indicate mean and standard deviation, respectively. Fold changes of translation activity, D5 Teff relative to Tn (top), D8 Teff relative to Tn (middle), D8 Teff relative to D5 Teff (bottom). (b) qRT-PCR data showing the amount of Rpl29 mRNA in fractions of sucrose gradient of Tn, D5 Teff, and D8 Teff P14 cell lysate, calculated as a percentage of the total in all fractions. (c) Percentage of RP mRNAs in polysome fractions. (d) Fold changes of RP mRNA amount per cell in polysome fractions. (e) Percentage of 80S ribosomes- (monosome and polysome) free RP mRNAs. (f) Fold changes of translation activity of 5′TOP mRNAs except for RP mRNAs in effector CD8+ T cells. Microarray data in Fig. 3 were used for this analysis. In (b)-(e), Teff P14 cells were obtained from spleen of LCMV-infected mice, in which P14 transgenic CD8+ T cells were adoptively transferred before infection. Naive P14 cells were isolated from spleen of uninfected P14 transgenic mice. Data (b) are representative of three independent experiments with samples pooled from 3-10 mice per each group. The mean mRNA level in polysomes (c-e) was calculated from 3 independent experiments with samples pooled from 3-10 mice per each group. Error bars are mean +/− s.e.m. *p<0.05, **p<0.01, ***p<0.001, ****p<0.0001 (one-way ANOVA). Tn, D5 Teff, D8 Teff indicate naive, day 5 effector, and day 8 effector CD8+ P14 T cells, respectively.
Figure 7
Figure 7. More profound translational inhibition of ribosomal protein mRNAs in terminal effector cells compared to memory precursor cells
(a) qRT-PCR data showing the amount of Rpl29 mRNA in fractions of sucrose gradient of CD127lo TTE and CD127hi TMP P14 cells obtained from spleen of day 8 LCMV infected mice. LCMV specific P14 transgenic CD8+ T cells were adoptively transferred into B6 mice, followed by LCMV Armstrong infection. (b) The portion of ribosomal protein mRNAs in monosome fractions. Horizontal doted lines indicating the average percentage of each gene in monosome fractions in naive CD8+ T cells (this was calculated from the data of Fig. 6). Data (a) are representative of six independent experiments with samples pooled from 3-5 mice per each group. Data in c were obtained from six independent experiments with samples pooled from 3-5 mice per each group. *p<0.05, **p<0.01, ***p<0.001 (unpaired t-test). TTE and TMP indicate terminal effector and memory precursor CD8+ T cells. (see also Supplementary Fig.6. for purification of CD127lo TTE and CD127hi TMP P14 cells and Cd8a mRNA amounts as a control.).
Figure 8
Figure 8. Antigen stimulation contributes to translational regulation of ribosomal protein mRNAs in virus-specific CD8+ T cells
(a) qRT-PCR data showing mRNA amount of Rpl29 in sucrose gradient fractions of Teff P14 CD8+ T cells obtained from spleen of either LCMV Arm- or LCMV clone 13-infected mice at day 8 post-infection. P14 cells were adoptively transferred before infection. (b) The portion of ribosomal protein mRNAs in polysome fractions of D8 Teff P14 cells obtained from spleen. Data (a) are representative of 5-6 independent experiments with samples pooled from 3-5 mice per each group. Data (b) were obtained from 5-6 independent experiments with samples pooled from 3-5 mice per each group. Error bars are mean +/− s.e.m. ****p<0.0001 (unpaired t-test).

References

    1. Kaech SM, Cui W. Transcriptional control of effector and memory CD8+ T cell differentiation. Nature reviews Immunology. 2012;12(11):749–761. - PMC - PubMed
    1. Wherry EJ, Ha SJ, Kaech SM, Haining WN, Sarkar S, Kalia V, et al. Molecular signature of CD8+ T cell exhaustion during chronic viral infection. Immunity. 2007;27(4):670–684. - PubMed
    1. Kaech SM, Hemby S, Kersh E, Ahmed R. Molecular and functional profiling of memory CD8 T cell differentiation. Cell. 2002;111(6):837–851. - PubMed
    1. Russ BE, Olshanksy M, Smallwood HS, Li J, Denton AE, Prier JE, et al. Distinct epigenetic signatures delineate transcriptional programs during virus-specific CD8(+) T cell differentiation. Immunity. 2014;41(5):853–865. - PMC - PubMed
    1. Shin HM, Kapoor VN, Guan T, Kaech SM, Welsh RM, Berg LJ. Epigenetic modifications induced by Blimp-1 Regulate CD8(+) T cell memory progression during acute virus infection. Immunity. 2013;39(4):661–675. - PMC - PubMed

MeSH terms