Editorial
. 2017 Sep;284(18):2955-2980.
doi: 10.1111/febs.14175. Epub 2017 Aug 16.

An engineered photoswitchable mammalian pyruvate kinase

Affiliations
Editorial

An engineered photoswitchable mammalian pyruvate kinase

Stefanie Gehrig et al. FEBS J. 2017 Sep.

Abstract

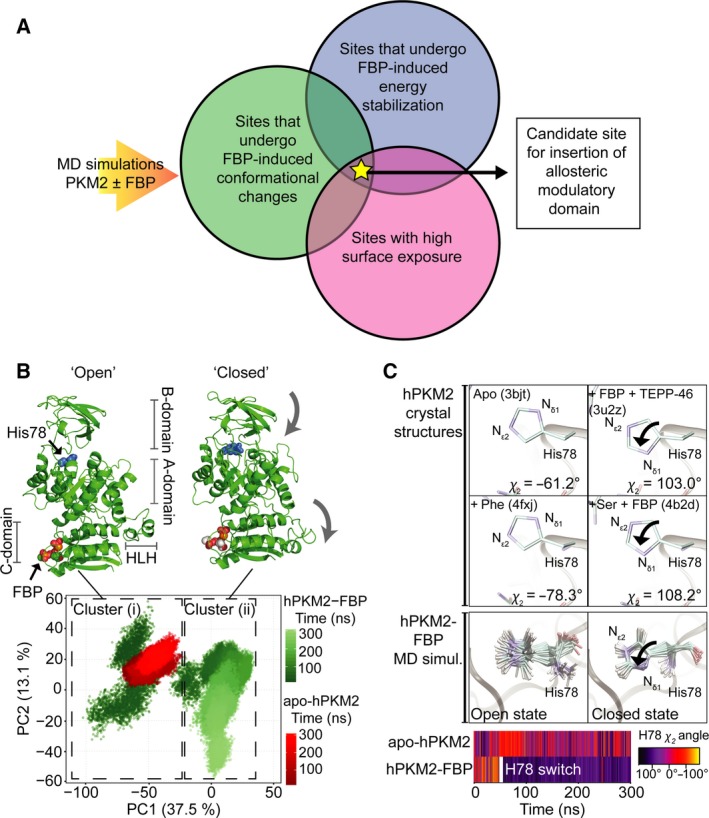
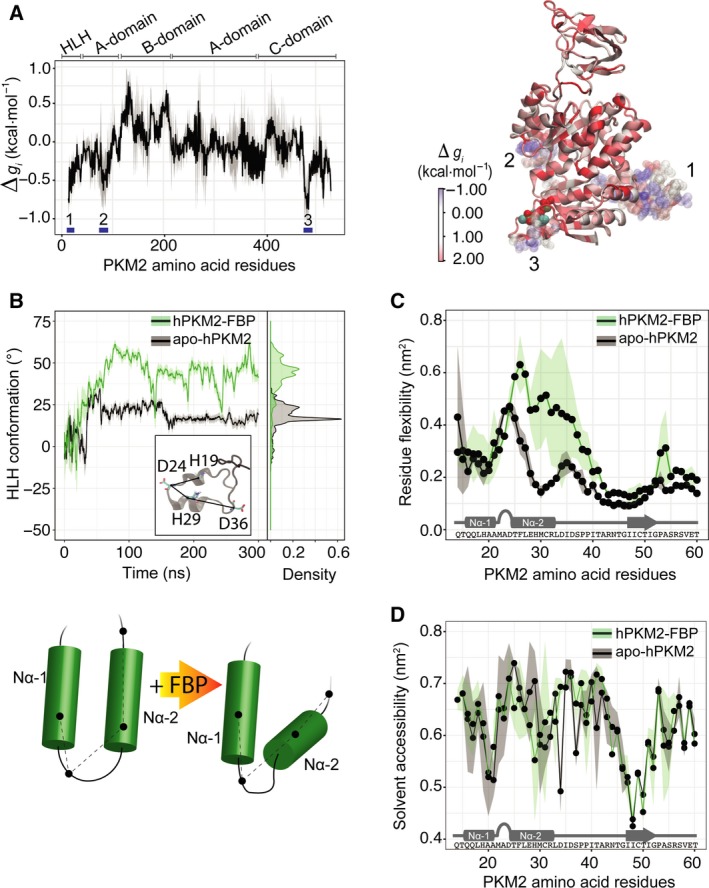
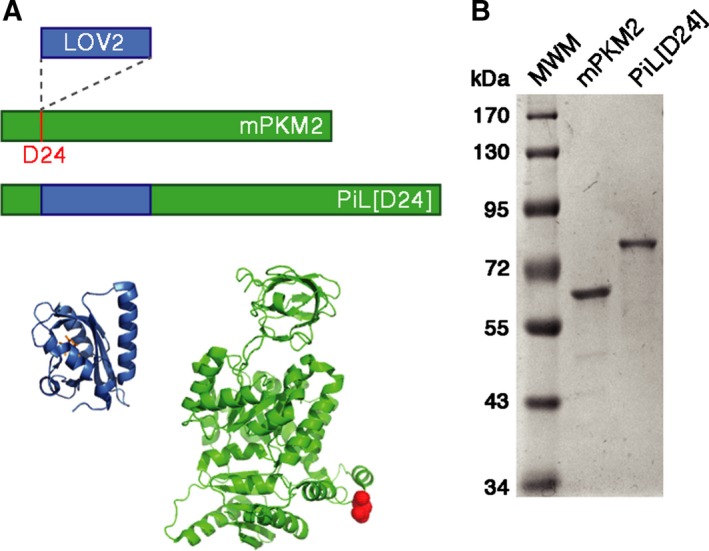
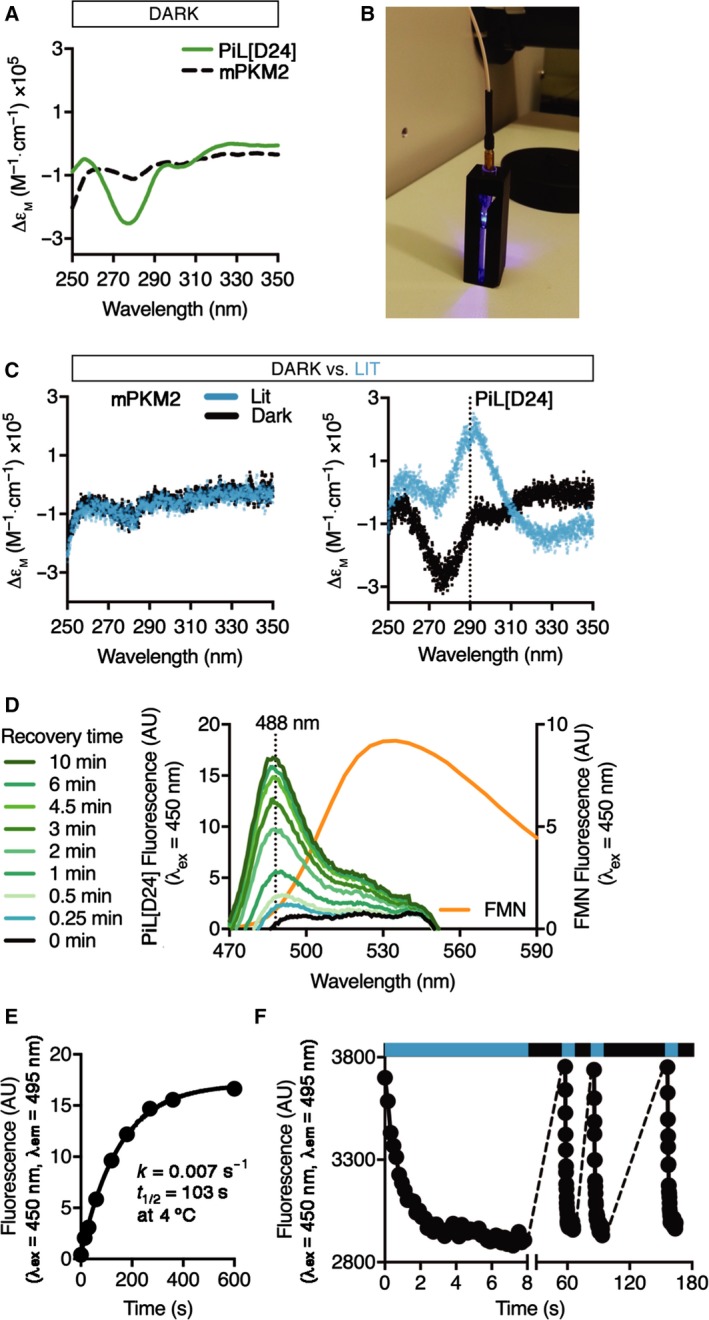
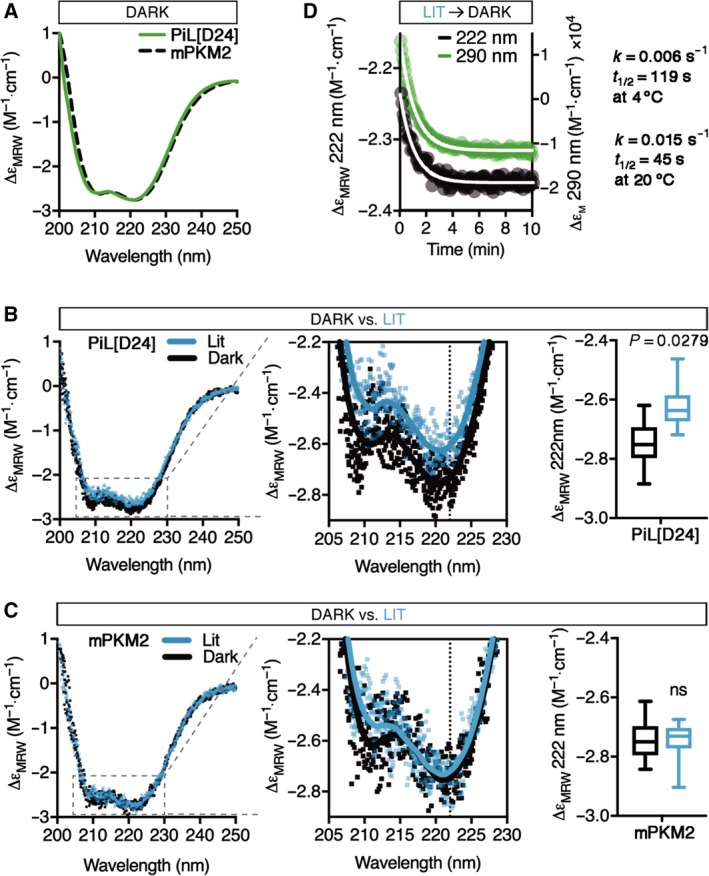
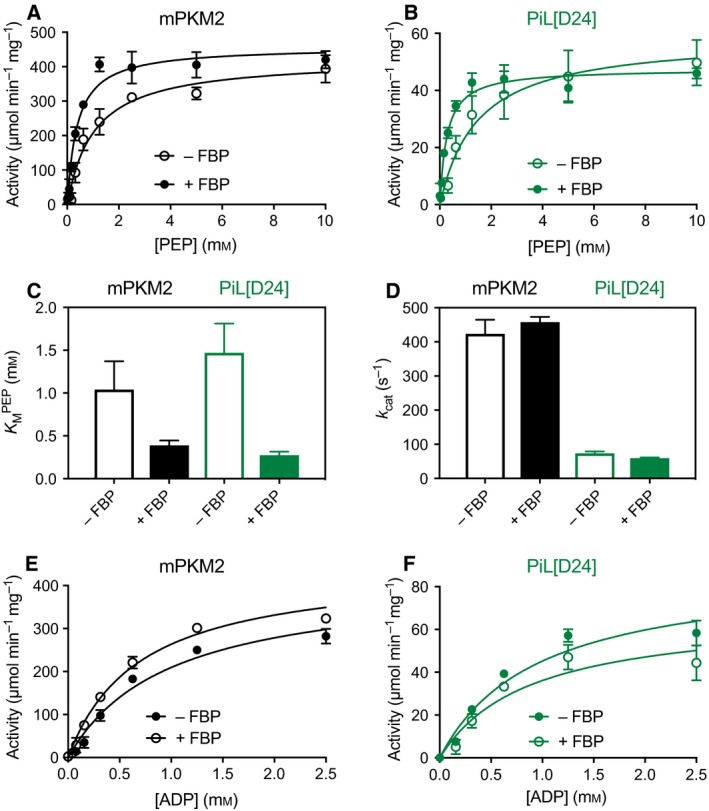
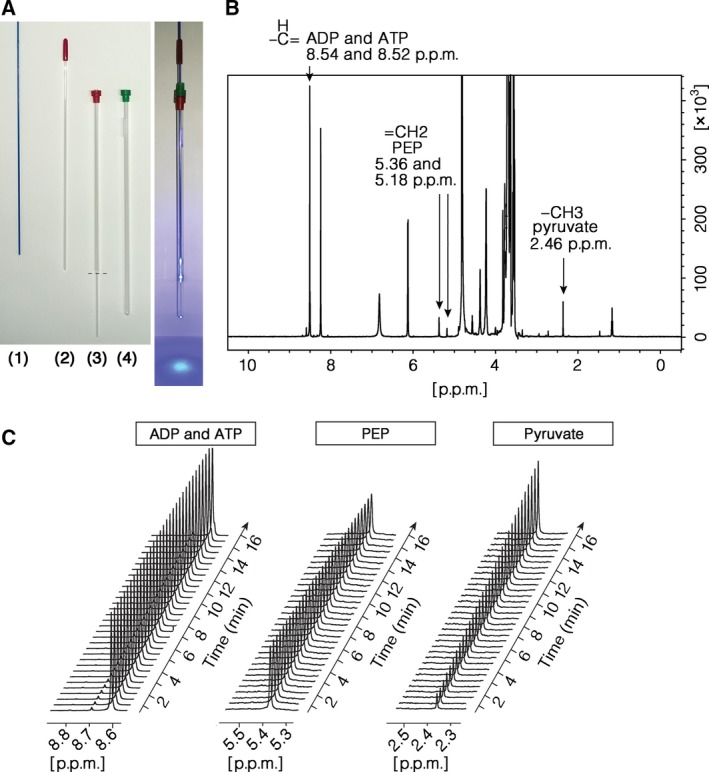
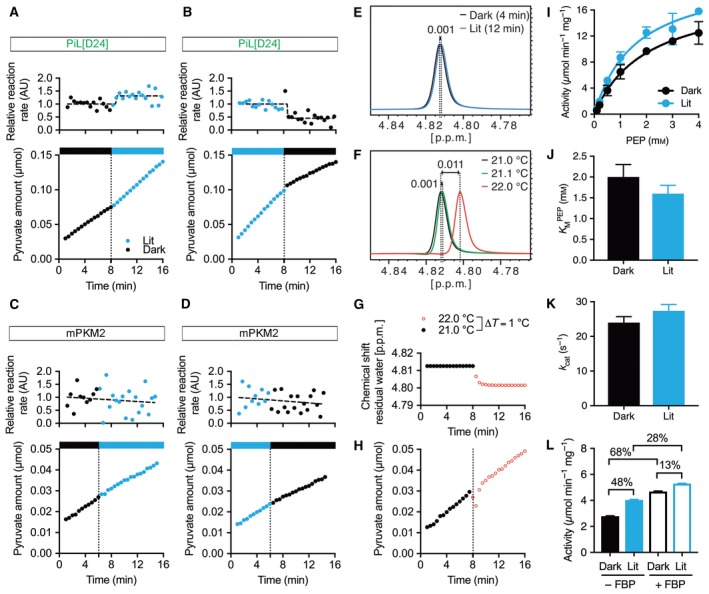
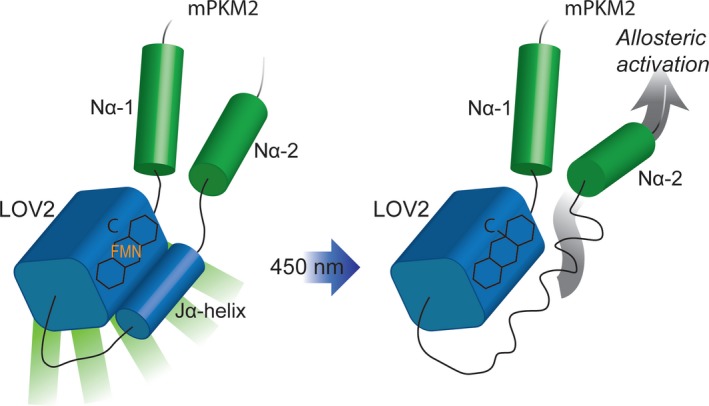
Changes in allosteric regulation of glycolytic enzymes have been linked to metabolic reprogramming involved in cancer. Remarkably, allosteric mechanisms control enzyme function at significantly shorter time-scales compared to the long-term effects of metabolic reprogramming on cell proliferation. It remains unclear if and how the speed and reversibility afforded by rapid allosteric control of metabolic enzymes is important for cell proliferation. Tools that allow specific, dynamic modulation of enzymatic activities in mammalian cells would help address this question. Towards this goal, we have used molecular dynamics simulations to guide the design of mPKM2 internal light/oxygen/voltage-sensitive domain 2 (LOV2) fusion at position D24 (PiL[D24]), an engineered pyruvate kinase M2 (PKM2) variant that harbours an insertion of the light-sensing LOV2 domain from Avena Sativa within a region implicated in allosteric regulation by fructose 1,6-bisphosphate (FBP). The LOV2 photoreaction is preserved in the PiL[D24] chimera and causes secondary structure changes that are associated with a 30% decrease in the Km of the enzyme for phosphoenolpyruvate resulting in increased pyruvate kinase activity after light exposure. Importantly, this change in activity is reversible upon light withdrawal. Expression of PiL[D24] in cells leads to light-induced increase in labelling of pyruvate from glucose. PiL[D24] therefore could provide a means to modulate cellular glucose metabolism in a remote manner and paves the way for studying the importance of rapid allosteric phenomena in the regulation of metabolism and enzyme control.

Keywords: LOV2; PKM2; metabolism; molecular dynamics; optogenetics.


Figures

Figure 1
Figure 1
MD reveals conformational changes on PKM2 upon FBP binding. (A) Summary of criteria that led to the identification of a candidate site used for inserting a heterologous allosteric domain to generate a photoswitchable pyruvate kinase. MD simulations of PKM2 with and without the allosteric activator FBP were used to identify residues that undergo FBP‐induced conformational changes (green circle), show energetic stabilisation indicative of allosteric communication with the FBP‐binding pocket (blue circle) and were surface‐exposed (pink circle). A site that fulfilled all three criteria was used to insert a light‐sensory domain. (B) MD simulations of apo‐hPKM2 (red) and hPKM2‐FBP (green) were projected onto the first two principal components (PCs) determined from the PCA of the hPKM2‐FBP trajectory. The time evolutions of both the apo‐ and FBP‐bound hPKM2 MD trajectories, from 0 to 300 ns, are represented as colour gradients. A k‐means clustering of the PCA plot identified two distinct Clusters (i) and (ii) (dashed boxes) that explained 100% of the point variability of the data set. Single most dominant conformations of hPKM2‐FBP were extracted from each of these two clusters and are shown in cartoon representations; FBP and the catalytic histidine (His78, blue) are shown as spacefill representations. Comparison of the structures extracted from Cluster (i) and Cluster (ii) revealed two dominant conformational motions (indicated with the grey arrows) as the protein transitioned from Cluster (i) to Cluster (ii): closure of the B‐domain and flipping downward of the HLH, which led us to assign Clusters (i) and (ii) as ‘open’ and ‘closed’ conformation respectively. (C) A superimposition of hPKM2 active site residues revealed that His78 adopts an altered side‐chain conformation in the crystal structure when the protein is bound to activators fructose 1,6‐bisphosphate (FBP) and TEPP‐46 (PDB ID: 3u2z) and when bound to L‐serine and FBP (PDB ID: 4b2d), compared to crystal structures of apo‐hPKM2 (PDB ID: 3bjt) and hPKM2 in complex with the allosteric inhibitor L‐phenylalanine (PDB ID: 4fxj). In the structures bound to the activators, the Nδ1 nitrogen group is positioned pointing towards the substrate‐binding pocket, and is flipped away from the substrate‐binding pocket in the apo‐ and phenylalanine‐bound structures. Consistent with this change following allosteric ligand binding, the conformation of His78 can provide a read‐out for whether PKM2 is in the catalytically active or inactive state. Below, 18 evenly spaced snap‐shots of the conformation of His78 are shown for a MD simulation of hPKM2‐FBP in the ‘open’ and following the transition to the ‘closed’ states. In the ‘open’ state [Cluster (i) in Fig. 1B], the side chain of His78 is flexible and switches into a conformation seen in that of the active crystal structures following the transition of the simulation into cluster ii [Cluster (ii) in Fig. 1B]. The time evolution of the χ2 dihedral angle of His78 along MD simulations of apo‐hPKM2 and hPKM2‐FBP, colour‐coded according to the scale on the right. The His78 switch occurs after ~ 50 ns (hPKM2‐FBP), while apo‐hPKM2 remains flexible for the duration of the simulation.
Figure 2
Figure 2
Identification of D24 as a candidate site for insertion of the LOV2 domain. (A) The per‐residue free energy difference ∆g i between the apo‐ and FBP‐bound MD simulations were calculated according to the method presented in 27, giving the difference in the amount of configurational work exerted on each residue i due to allosteric ligand binding. The numbers and blue bars indicate the HLH 1, FBP‐binding pocket 3 and a third site encompassing residues 86–97 2 that are energetically stabilised by FBP binding (negative on the ∆g i scale). Conversely, residues in the B‐domain yield a significant increase of configurational work (positive on the ∆g i scale) as a result of allosteric communication between sites. The right panel shows a cartoon representation of these data coloured according to the configurational work exerted per residue in the corresponding part of the protein (negative values in blue showing energetic stabilisation; and positive values in red showing increase in local configurational work). (B) A planar dihedral angle was defined between the Cα atoms of His19, Asp24, His29 and Asp36 (see inset) to quantify, in a time‐resolved manner, conformational changes of the N‐terminal HLH in the MD simulations of apo‐hPKM2 (black) and hPKM2‐FBP (green). Running averages and standard deviations of the dihedral angle over the trajectories were calculated with sliding windows of 1 ns and are shown as solid and transparent lines respectively. A density histogram showing the distribution of the dihedral angle is shown. The lower panel shows a cartoon representing the observed displacement of the Nα‐2 helix by a hinge‐like motion. (C) The root‐mean‐square deviations of the Cα atoms were measured from the apo‐hPKM2 and hPKM2‐FBP MD simulations averaged over three replicates for each state respectively. The points indicate the averaged root‐mean‐square deviation over the three replicates and the shading shows the standard deviation of the mean. The second helix (Nα2) in the HLH motif is more flexible upon FBP binding, permitting the observed ‘flipping’ down in the presence of the allosteric activator. (D) Plotting of the time‐averaged solvent accessibility calculated from the MD simulations of apo‐hPKM2 and hPKM2‐FBP shown for the first 60‐amino‐acid residues, which reveals that residues in the interhelical loop are highly solvent exposed (including residue D24). The points indicate the averaged solvent accessibility over the three replicates and the shading shows the standard deviation of the mean.
Figure 3
Figure 3
Construction of PiL[D24], a chimera of LOV2 and the LOV2 photosensory domain. (A) Schematic of the engineered PiL[D24] chimera showing the insertion of the light‐sensory LOV2 domain between residues Asp24 (D24) and Thr25 in mPKM2 to generate a light‐controlled PKM2 variant. Bottom panel left: Crystal structure of the Avena Sativa LOV2 domain (PDB ID: 2V0U) in blue with bound FMN in orange. Bottom panel right: Crystal structure of PKM2 (PDB ID: 3U2Z) in green. D24 is shown as red spheres and highlights the insertion site of LOV2 in the N‐terminal HLH of PKM2. (B) Coomassie‐stained SDS/PAGE of recombinant PKM2 (60 kDa) and PiL[D24] (75 kDa; 0.5 μg each) expressed in Escherichia coli and purified by affinity and SEC. MWM, molecular weight markers.
Figure 4
Figure 4
PiL[D24] is fluorescent and undergoes a reversible photoreaction. (A) Near‐UV CD spectra of purified recombinant PiL[D24] compared to mPKM2 showing a characteristic strong negative band at 278 nm for FMN. ∆εm, molar extinction coefficient. (B) Setup for sample illumination in CD experiments. The optic fibre was positioned with a cut pipette tip on top of the sample in the quartz cuvette and were placed in the instrument. (C) Overlay of consecutive single near‐UV CD spectral scans of mPKM2 (left panel) and PiL[D24] (right panel) before (Dark) and after (Lit) repeated blue light illumination for 2 min (n = 5). (D) Fluorescence emission spectra of purified recombinant PiL[D24] at 4°C obtained by consecutive emission scans at the indicated recovery time following blue light (λex = 450 nm) illumination. The dotted line at 488 nm marks the emission maximum of PiL[D24]. For comparison, the emission scan of free FMN, also at λex = 450 nm is shown in orange. (E) Fluorescence at the emission maximum (488 nm) measured in (D) was plotted against time and showed a first‐order exponential reaction with k = 0.007 s−1 and t 1/2 = 103 s. (F) Repeated photoswitching of purified recombinant PiL[D24] observed at its emission maximum (495 nm, λex = 450 nm). Blue stripe highlights light exposure and black stripe no light.
Figure 5
Figure 5
Light induces conformational changes in PiL[D24] that are synchronous to changes in its fluorescence. (A) Far‐UV CD spectra of purified recombinant PiL[D24] compared to mPKM2 showing indistinguishable secondary structure profiles that are characteristic of α‐helix‐rich proteins. ∆εMRW: extinction coefficient of MRW. (B) Overlay of consecutive single far‐UV CD spectral scans of PiL[D24] before (Dark) and after (Lit) continuous blue light illumination for 2 min, n = 5. Zoom‐in highlights loss of α‐helical CD signal under the Lit condition. Solid lines represent the smoothed average of single scans. The dotted line at 222 nm marks the α‐helical signature CD peak where we observed a significant loss of signal (P = 0.0279, unpaired parametric t‐test) under the Lit condition, as shown on the adjacent bar graph. (C) Overlay of consecutive single far‐UV CD spectral scans or mPKM2 as in (B), acquired and quantified as in (B), n = 5 (P = 0.2320, unpaired parametric t‐test). Zoom‐in shows no loss of CD signal for mPKM2 under Lit condition. (D) Kinetics of secondary structure recovery measured by the CD signal at 222 nm (black circles, right y‐axis) compared to the kinetic of the FMN photoreaction recovery measured at 290 nm (green circles, left y‐axis) after 2 min of blue light exposure at 20 °C. Both signals recover with identical first‐order kinetics (k = 0.015 s−1 and t 1/2=45 s).
Figure 6
Figure 6
PiL[D24] has lower activity in the Dark state than mPKM2, but maintains the capacity to be activated by FBP. (A) Steady‐state enzyme kinetics of purified mPKM2 at varying concentrations of phosphoenolpyruvate. Initial velocity curves were fitted using Michaelis–Menten kinetics. For all phosphoenolpyruvate concentrations, ADP was added at a constant concentration of 2.5 mm in the absence (open circles) or presence (closed circles) of 400 μm FBP. (B) Steady‐state enzyme kinetics of purified PiL[D24] as in (A). (C) Plotting of the measured K M PEP from (A) and (B) showing the effects of FBP addition on mPKM2 and PiL[D24]. (D) Comparison of the k cat for mPKM2 and PiL[D24] measured from (A) and (B). (E) Steady‐state enzyme kinetics of purified mPKM2 at varying concentrations of phosphoenolpyruvate (ADP). Initial velocity curves were fitted using Michaelis–Menten kinetics. For all ADP concentrations, phosphoenolpyruvate was added at a constant concentration of 10 mm in the absence (open circles) or presence (closed circles) of 400 μm FBP. (F) Steady‐state enzyme kinetics of purified PiL[D24] as in (E). In all plots, the mean of three technical replicates is plotted and error bars indicate the standard deviation of the mean.
Figure 7
Figure 7
Monitoring of the pyruvate kinase reaction in real time by NMR. (A) Setup of optic fibre to illuminate the sample in the NMR tube (right picture). The fibre (1) is inserted into an inner tube (2) that is then placed into the coaxial insert (3) with its stem cut off (dotted line). This holds the fibre at the centre of the NMR tube (4). The fully assembled setup with the fibre illuminated is shown on the right picture. (B) 1D 1H NMR spectrum of reactants acquired in Tris/HCl buffer referenced to H2O/D2O and acquired with water suppression. Assigned hydrogens from pyruvate, phosphoenolpyruvate, ADP and ATP are indicated with arrows. (C) The time evolution of pyruvate kinase reaction shown by staged peaks for ADP and ATP, phosphoenolpyruvate and pyruvate extracted from sequential NMR spectra (as in B) that were acquired at 30‐s intervals.
Figure 8
Figure 8
Light induces a reversible increase in the enzymatic activity of PiL[D24]. (A) Pyruvate production in PiL[D24] activity assay, quantified from a time‐resolved series of 1H NMR spectra, before (0–8 min, Dark, black stripe) and after (8–16 min, Lit, blue stripe) switching the blue light on (dotted line at 8 min). The top panel shows reaction rates over time and demonstrates increased activity in the Lit state. (B) Pyruvate production in PiL[D24] activity assay as in (A) but with inverse light conditions, starting the reaction under Lit conditions and switching the light off (Dark). Time‐dependent slopes demonstrate a decrease of activity for withdrawing blue light. (C) Pyruvate production in mPKM2 activity assay as in (A). (D) Pyruvate production in mPKM2 activity assay as in (B). (E) Water peaks from NMR spectra, at 4 min and 12 min, of the experiments shown in (A), showing a change in chemical shift of −0.001 p.p.m. after illumination. See Methods for details on calculating temperature change from the residual water resonance peak shift. (F) NMR spectra of water in the PK reaction buffer without enzymes at the indicated temperatures. (G) Temperature‐dependent change in the chemical shift of water in a PiL[D24] reaction, shown in (H), at 21.0 °C (0–8 min, black filled circles) and after the temperature was increased to 22.0 °C (8–16 min, red open circles). (H) Pyruvate production in PiL[D24] activity assay, quantified from a time‐resolved series of 1H NMR spectra under Dark conditions. The reaction started at 21.0 °C (black filled circles) and progressed for 8 min, at which point (dotted line) the temperature in the NMR tube was increased to 22.0 °C (red open circles). (I) Michaelis–Menten curve fittings (solid lines) of PiL[D24] activity measured with various concentrations of phosphoenolpyruvate ranging from 0.1 to 4 mm under in Lit and Dark state (mean ± SD, P = 0.0059, paired parametric t‐test, n = 3–4 activity measurements for each phosphoenolpyruvate concentration). (J) Bar graph representation of the KMPEP (mean ± SD) calculated from data shown in (E). Also see Table 3. (K) Bar graph representation of the k cat (mean ± SD) calculated from data shown in (E). Also see Table 3. (L) Activity of PiL[D24] under Dark and Lit conditions in the absence or presence of 100 μm FBP with 1 mm phosphoenolpyruvate (value ± error of the linear fit of activity progress curves from three technical replicates). Percentages show change in activity between the corresponding conditions.
Figure 9
Figure 9
PiL[D24], expressed in HeLa cells, undergoes photoswitching. (A) Western blot of lysates from control empty vector (EV) or PiL[D24]‐expressing HeLa cells, probed with a PKM2 antibody, revealed a higher molecular weight band, which is only present in HeLa‐PiL[D24] cells and corresponds to the expected size for PiL[D24] (75 kDa) compared to the endogenous hPKM2 (lower band). (B) LOV2 fluorescence (upper panel) and transmitted light images (lower panel) in cultured HeLa cells expressing PiL[D24] in comparison to mPKM2 expressing HeLa cells. (C) Fluorescence switching in HeLa‐PiL[D24] cells demonstrates loss of fluorescence under fast acquisition (1 frame/0.6 s) and recovery under sparse (1 frame/15 s and 1 frame/30 s) imaging regimes (n = 36, mean ± SD). Blue stripe highlights light exposure and black stripe no light in the imaging time course.
Figure 10
Figure 10
Blue light increases pyruvate kinase activity in cells expressing PiL[D24]. (A) Picture of the BlueCell unit (top) and of a plate places within the unit (bottom), which we constructed for illumination of cultured cells. BlueCell is based on an LED light array that can be placed within a humidified CO2 incubator and is operated via a raspberry pi in the control unit (upper panel, grey box). The led array has the capacity to deliver continuous or pulsed light with variable intensity (1–10 mW·cm−2). Throughout the experiment, the incident light experienced by cells and the actual temperature in the LED unit chamber are monitored with optical and temperature sensors that are embedded next to the cell culture plate (bottom image). Integrated fans can be used as needed to dissipate the heat generated by the LEDs. (B) Example of measured light intensity and temperature output showing increased temperature in the chamber due to LED heating which increases with higher light intensities. Use of the embedded fans (‘fan ON’) alleviates this effect and allows the maintenance of a stable temperature. The two traces indicate readings from two separate sensors within the unit. (C) Fraction of pyruvate that is fully labelled from U‐13C‐glucose (upper panel) and pyruvate abundance (lower panel) in control (HeLa EV) and HeLa‐PiL[D24] cells. Cells were seeded in replicates (four for HeLa‐PiL[D24], three for HeLa EV) at t = −18 h in six‐well plates and cells were preilluminated for 1 h (t = −1 h) for Lit condition or left in the Dark. U‐13C‐glucose was then added to the media (t = 0 min) while the Dark or Lit conditions were maintained for the respective groups. Cells were quenched and harvested at the indicated time points. The polar fractions of the respective cell extracts were analysed by GC‐MS to quantify 13C labelling and total abundance of pyruvate (mean ± SD). (D) Fraction of phosphoenolpyruvate that is fully labelled from U‐13C‐glucose (upper panel) and phosphoenolpyruvate abundance (lower panel) in control (HeLa EV) and HeLa‐PiL[D24] cells as described in (C). Raw natural abundance‐corrected GC‐MS data are shown in Table S1.
Figure 11
Figure 11
Proposed model for the light‐dependent activation of PiL[D24]. In the Dark state (left), PiL[D24] fluoresces (denoted by the green bars emanating out of the LOV2 domain). Light induces a conformational change in LOV2 that is transmitted (grey arrow on the right cartoon) to the flanking PKM2 part of the chimera, leading to an increase in its pyruvate kinase activity. Light activation leads to the loss of PiL[D24] fluorescence. C: cysteine in the LOV2 PAS domain; shown forming a cysteinyl adduct with FMN on the right.

References

    1. Liu J & Nussinov R (2016) Allostery: an overview of its history, concepts, methods, and applications. PLoS Comput Biol 12, e1004966. - PMC - PubMed
    1. Macpherson JA & Anastasiou D (2017) Allosteric regulation of metabolism in cancer: endogenous mechanisms and considerations for drug design. Curr Opin Biotechnol 48, 102–110. - PubMed
    1. Changeux JP (2012) Allostery and the Monod‐Wyman‐Changeux model after 50 years. Annu Rev Biophys 41, 103–133. - PubMed
    1. Fenton AW (2008) Allostery: an illustrated definition for the ‘second secret of life’. Trends Biochem Sci 33, 420–425. - PMC - PubMed
    1. Motlagh HN, Wrabl JO, Li J & Hilser VJ (2014) The ensemble nature of allostery. Nature 508, 331–339. - PMC - PubMed

Publication types

MeSH terms

LinkOut - more resources