. 2017 Jul 17;13(7):e1006899.
doi: 10.1371/journal.pgen.1006899. eCollection 2017 Jul.

A unique enhancer boundary complex on the mouse ribosomal RNA genes persists after loss of Rrn3 or UBF and the inactivation of RNA polymerase I transcription

Affiliations

A unique enhancer boundary complex on the mouse ribosomal RNA genes persists after loss of Rrn3 or UBF and the inactivation of RNA polymerase I transcription

Chelsea Herdman et al. PLoS Genet. .

Abstract

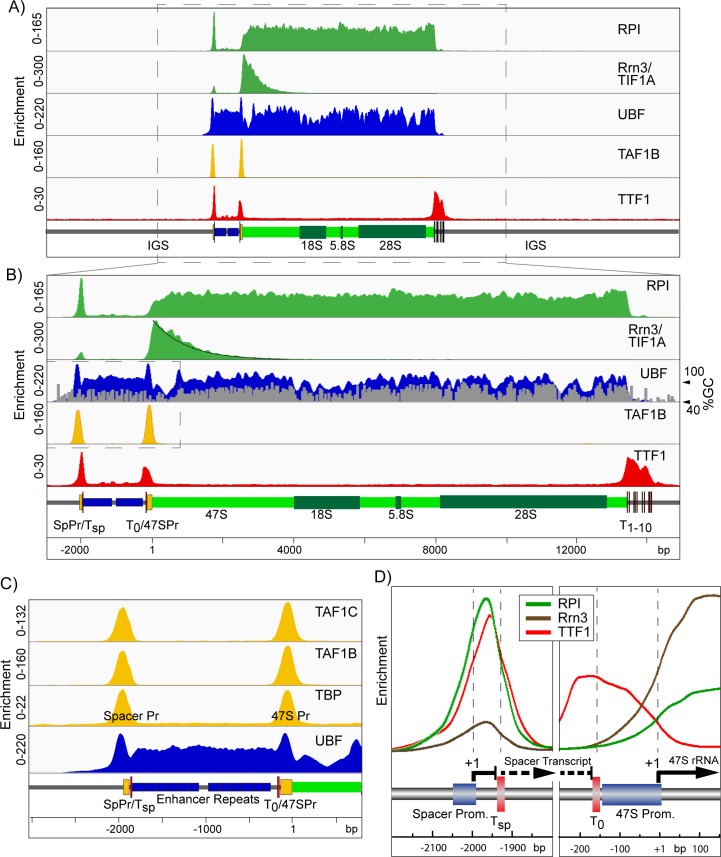
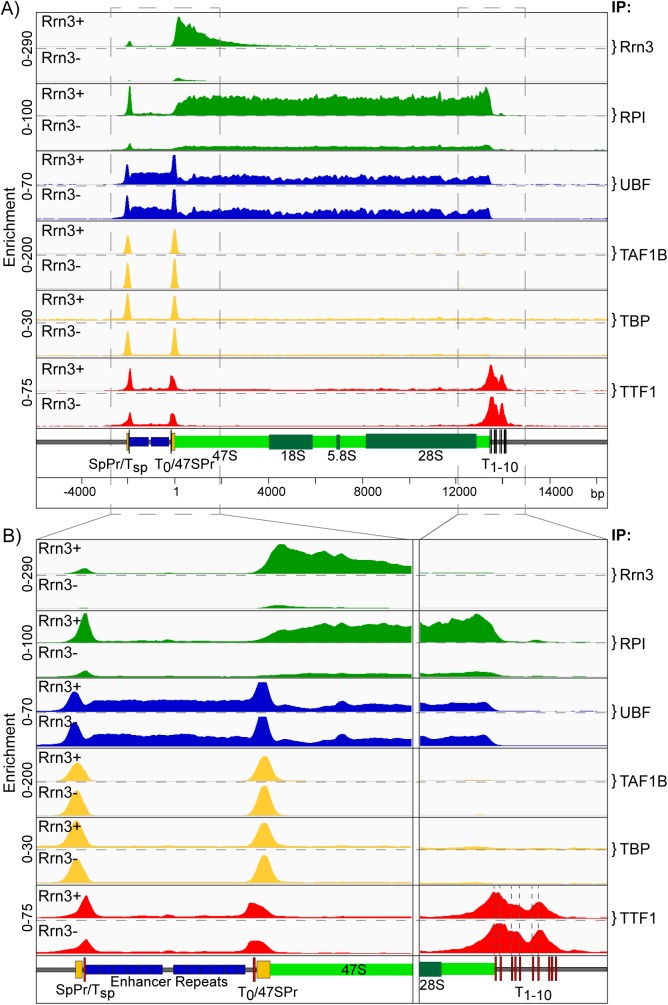
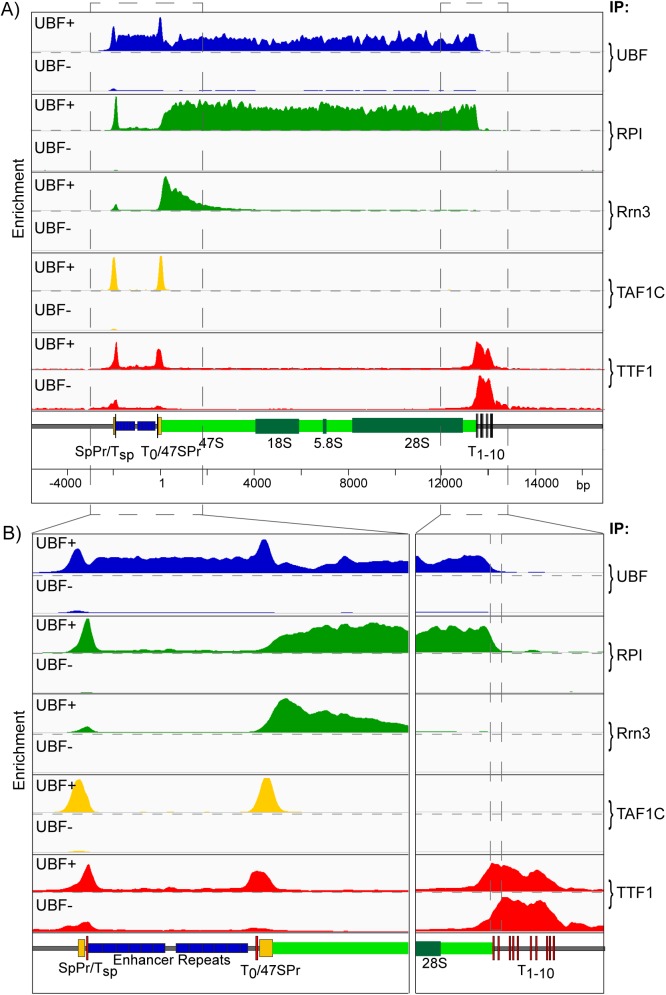
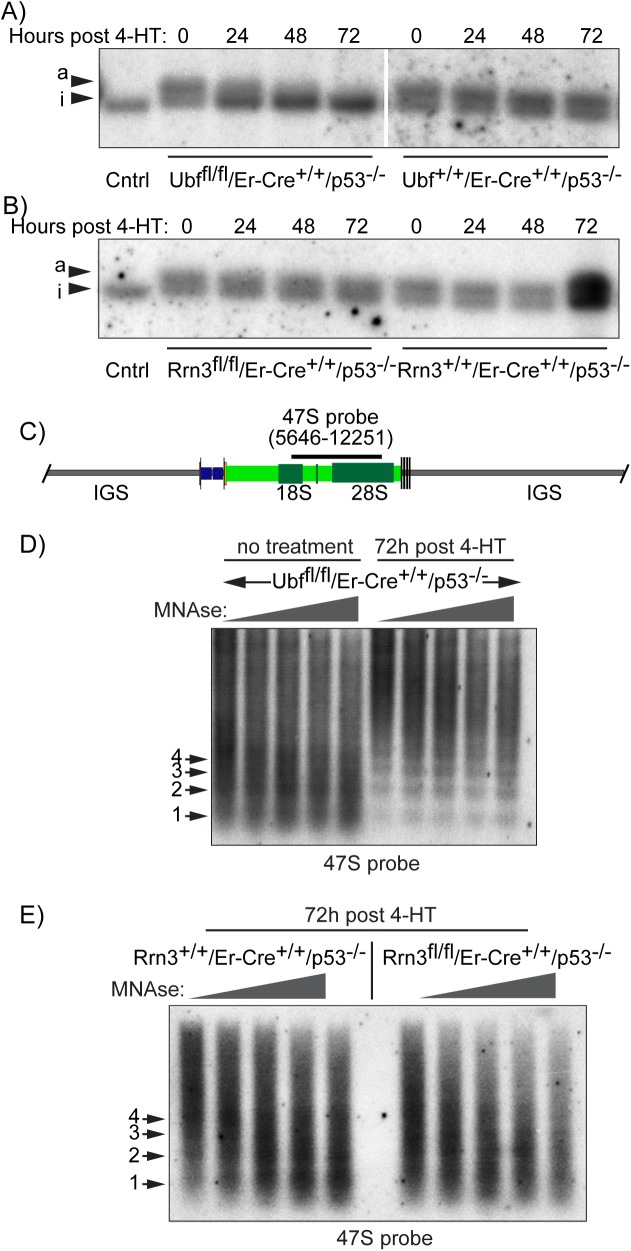
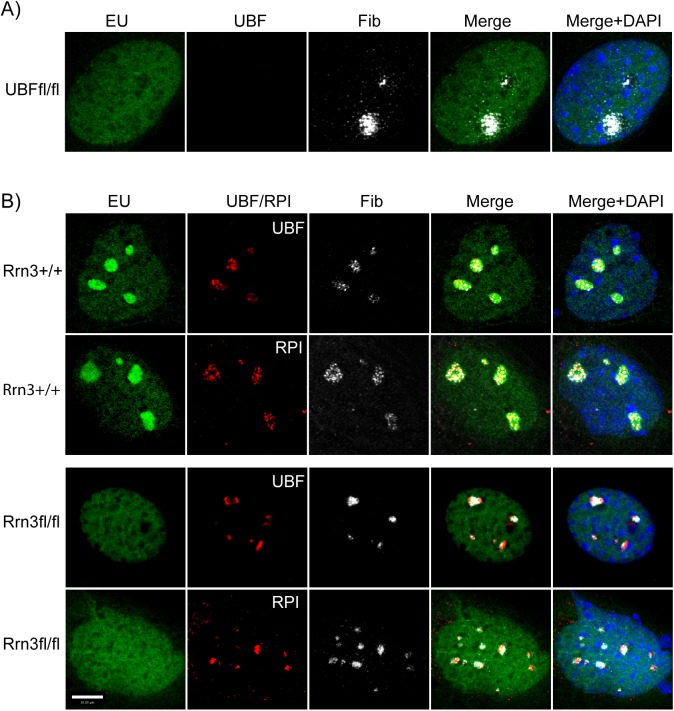
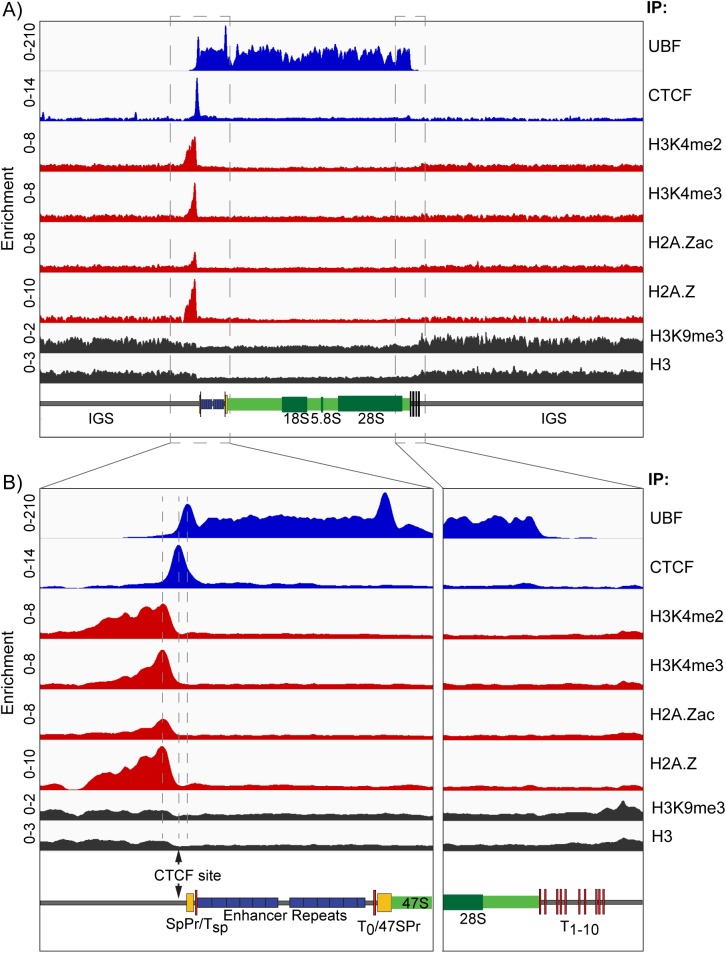
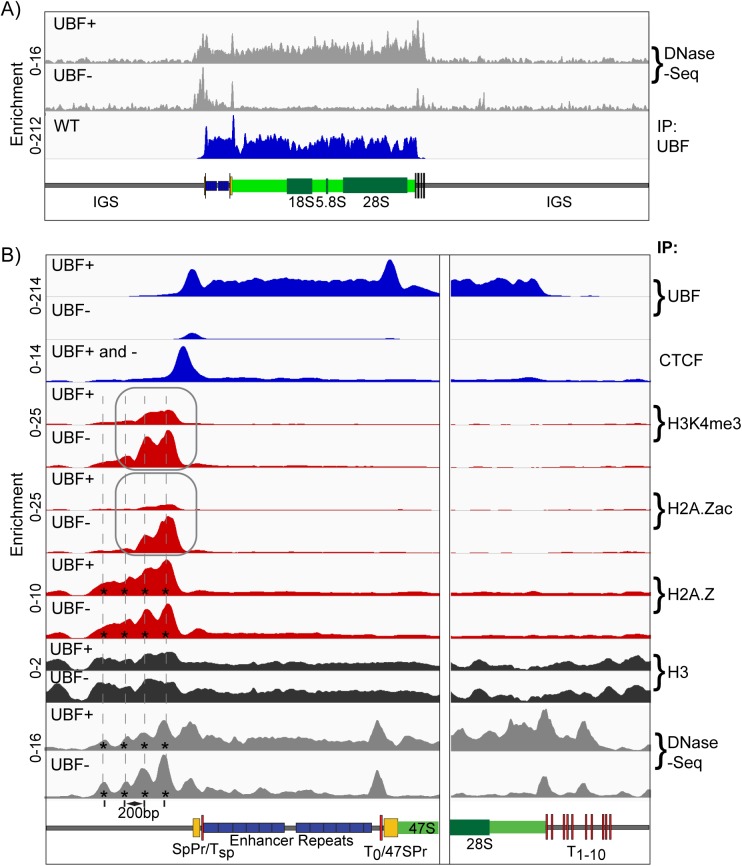
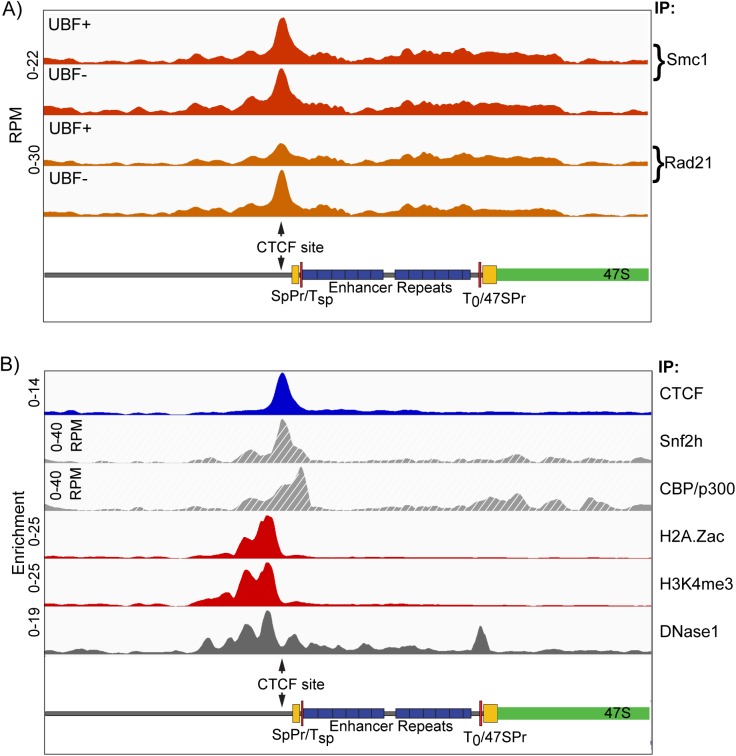
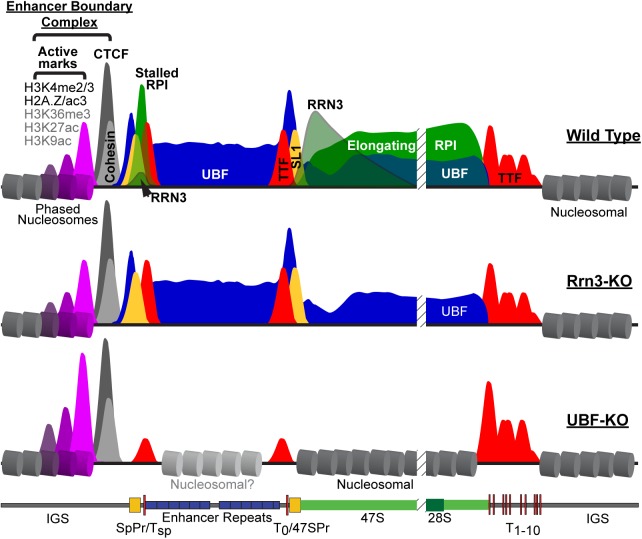
Transcription of the several hundred of mouse and human Ribosomal RNA (rRNA) genes accounts for the majority of RNA synthesis in the cell nucleus and is the determinant of cytoplasmic ribosome abundance, a key factor in regulating gene expression. The rRNA genes, referred to globally as the rDNA, are clustered as direct repeats at the Nucleolar Organiser Regions, NORs, of several chromosomes, and in many cells the active repeats are transcribed at near saturation levels. The rDNA is also a hotspot of recombination and chromosome breakage, and hence understanding its control has broad importance. Despite the need for a high level of rDNA transcription, typically only a fraction of the rDNA is transcriptionally active, and some NORs are permanently silenced by CpG methylation. Various chromatin-remodelling complexes have been implicated in counteracting silencing to maintain rDNA activity. However, the chromatin structure of the active rDNA fraction is still far from clear. Here we have combined a high-resolution ChIP-Seq protocol with conditional inactivation of key basal factors to better understand what determines active rDNA chromatin. The data resolve questions concerning the interdependence of the basal transcription factors, show that preinitiation complex formation is driven by the architectural factor UBF (UBTF) independently of transcription, and that RPI termination and release corresponds with the site of TTF1 binding. They further reveal the existence of an asymmetric Enhancer Boundary Complex formed by CTCF and Cohesin and flanked upstream by phased nucleosomes and downstream by an arrested RNA Polymerase I complex. We find that the Enhancer Boundary Complex is the only site of active histone modification in the 45kbp rDNA repeat. Strikingly, it not only delimits each functional rRNA gene, but also is stably maintained after gene inactivation and the re-establishment of surrounding repressive chromatin. Our data define a poised state of rDNA chromatin and place the Enhancer Boundary Complex as the likely entry point for chromatin remodelling complexes.


Conflict of interest statement

The authors have declared that no competing interests exist.

Figures

Fig 1
Fig 1. High resolution ChIP-Seq maps of RPI, the RPI basal factors and TTF1 across the mouse rDNA repeat unit of Ubf+/+/Rrn3+/+p53-/- control MEFs.
A) and B) show the ChIP enrichment profile maps for RPI, Rrn3, UBF, the SL1 component TAF1B and TTF1, A) over the full mouse rDNA repeat and, B) at higher resolution for just the functional rRNA gene unit (boxed region in A). The UBF enrichment profile in B) is overlayed with the GC-content profile of the rDNA sequence, see also S1 Fig, and an exponential curve fit to the Rrn3 enrichment profile (black) is shown downstream of the 47S initiation site (+1). C) An enlargement of the enrichment profiles (boxed region in B) for the SL1 components TAF1C, TAF1B and TBP in comparison with that for UBF across the Spacer Promoter, Enhancer Repeat and 47S Promoter. D) Shows the superimposed enrichment profiles of RPI, Rrn3 and TTF1 at the Spacer and 47S Promoters. The enrichment scale for each factor is the same in left and right panels. In A) to D) a scale map of the rDNA sequence elements is given below each panel. ChIP enrichment for each factor is given as; ChIP-Seq reads per million (RPM)/Input DNA RPM.
Fig 2
Fig 2. Conditional deletion of the Rrn3 gene inhibits RPI transcription but does not affect pre-initiation complex formation.
As in Fig 1., A) and B) show the ChIP enrichment profile maps before (Rrn3+) and after (Rrn3-) Rrn3 gene inactivation (72h 4-HT time point, S3B and S3F Fig). The binding profiles (IP) for Rrn3, RPI, UBF, the SL1 components TAF1B and TBP, and TTF1 are shown in A) over the functional mouse rRNA gene unit and, B) at higher resolution for the upstream Enhancer and Promoter elements and the 47S termination site, (boxed regions in A). As in Fig 1, a scale map of the rDNA sequence elements is given below each panel, and ChIP enrichments for each factor are given as; ChIP-Seq RPM/Input DNA RPM.
Fig 3
Fig 3. Conditional deletion of the UBF gene not only ablates RPI transcription but also prevents preinitiation complex formation.
A) and B) show the ChIP enrichment profile maps before (UBF+) and after (UBF-) UBF gene inactivation (72h 4-HT time point, S3E and S3F Fig). The binding profiles (IP) for UBF RPI, Rrn3, the SL1 component TAF1C, and TTF1 are shown; A) over the functional mouse rRNA gene unit and, B) at higher resolution for the upstream Enhancer and Promoter elements and the 47S termination site. As in Fig 1, a scale map of the rDNA sequence elements is given below each panel, and ChIP enrichments for each factor are given as; ChIP-Seq RPM/Input DNA RPM.
Fig 4
Fig 4. UBF determines the activated state of the rDNA chromatin.
A) and B) show psoralen accessibility analyses during the time course of UBF and Rrn3 gene deletion (see 4HT time course S3 Fig). The high accessibility so-called active “a” gene fraction, and the low accessibility inactive. “i” gene fraction were detected using the 47S probe. C) The mapped position of the hybridization probe relative to the start of the 47S rRNA is indicated above a diagram of the rDNA repeat. D) The profiles of increasing MNase cleavage of chromatin from UBF conditional MEFs either before or after (72h post 4-HT) inactivation of the UBF gene. E) The profiles of increasing MNase cleavage of chromatin from Rrn3 wild type and conditional (floxed) MEFs after 72h of treatment with 4-HT. The data in D) and E) was obtained using the 47S hybridization probe shown in C), and the positions of mono- (1), di- (2), etc nucleosomes are indicated. More complete datasets of the MNase analyses are given in S5 Fig.
Fig 5
Fig 5. Comparative nucleolar structures before and after UBF or Rrn3 gene inactivation.
A) In situ RNA labeling (EU) and UBF and fibrillarin (Fib) staining of Ubffl/fl/ER-Cre+/+/p53-/- MEFs 72h post 4-HT treatment. B) In situ RNA labeling (EU), and fibrillarin (Fib) and UBF or RPI staining of Rrn3wt/wt/ER-Cre+/+/p53-/- and Rrn3fl/fl/ER-Cre+/+/p53-/- MEFs 72h post 4-HT treatment. Cultures were also counterstained with DAPI.
Fig 6
Fig 6. The UBF binding domain is delineated by an Enhancer Boundary Complex.
A) The ChIP enrichment profile maps for UBF, CTCF, H3K4me2, H3K4me3, H2A.Zac, H2A.Z, H3K9me3 and H3 across the full rDNA repeat unit. B) Higher resolution maps for the upstream Enhancer and Promoter elements and the 47S termination site (boxed in A). The position of the predicted CTCF binding site [67] is indicated. As in Fig 1, a scale map of the rDNA sequence elements is given below each panel, and ChIP enrichments for each factor are given as; ChIP-Seq RPM/Input DNA RPM.
Fig 7
Fig 7. The Enhancer Boundary Complex exists independently of UBF and rDNA activity.
A) DNase-Seq analysis of Ubfwt/wt/ER-Cre+/+/p53-/- (UBF+) and Ubffl/fl/ER-Cre+/+/p53-/- (UBF-) MEFs 72h post 4-HT treatment across the full rDNA repeat unit as compared to the UBF ChIP-Seq profile of Ubfwt/wt/ER-Cre+/+/p53-/- (WT) MEFs also 72h post 4-HT treatment. B) Higher resolution ChIP enrichment profile maps for UBF, CTCF, H3K4me3, H2A.Zac, H2A.Z and H3 across the upstream Enhancer and Promoter elements and the downstream 47S termination site of Ubffl/fl/ER-Cre+/+/p53-/- MEFs either untreated (UBF+) or 72h post 4-HT (UBF-). Binding of CTCF (UBF+ and -) was unaffected by UBF loss. Higher resolution DNase-Seq profiles are also given in panel B) as are the positions of phased nucleosomes (*). Scale maps of the rDNA sequence elements are provided below each panel. Enrichments for each track are given as; Sample DNA RPM/Input DNA RPM.
Fig 8
Fig 8. Cohesin subunits and chromatin remodelers also map to the Enhancer Boundary.
A) Distribution of Cohesin subunits Smc1 and Rad21 across the rDNA repeat unit of Ubffl/fl/ER-Cre+/+/p53-/- MEFs either untreated (UBF+) or 72h post 4-HT (UBF-). B) Comparative distribution of CTCF, H2A.Zac, H3K4me3 and DNase1 cleavage across the mouse rDNA from the present study and Snf2h (GSE53583) [91] and CPB/p300 (GSE54453) [92]. Scale maps of the rDNA sequence elements are provided below each panel. Enrichments for each track are given either as; Sample DNA RPM/Input DNA RPM, or directly in RPM as indicated.
Fig 9
Fig 9. Diagrammatic summary of factor binding and chromatin structure across the active mouse rDNA repeat (Wild Type) and after deletion of Rrn3 (Rrn3-KO) or UBF (UBF-KO).
UBF is indicated in blue, RPI in green, Rrn3 in grey/green, TTF1 in red, SL1 in yellow, CTCF in dark grey and Cohesin in light grey. The CTCF adjacent phased nucleosomes are indicated in magenta and their degree of modification indicated by the height of corresponding peaks.

References

    1. Moss T, Langlois F, Gagnon-Kugler T, Stefanovsky V. A housekeeper with power of attorney: the rRNA genes in ribosome biogenesis. Cell Mol Life Sci. 2007;64(1):29–49. doi: 10.1007/s00018-006-6278-1 . - DOI - PMC - PubMed
    1. Hinnebusch AG, Ivanov IP, Sonenberg N. Translational control by 5'-untranslated regions of eukaryotic mRNAs. Science. 2016;352(6292):1413–6. Epub 2016/06/18. doi: 10.1126/science.aad9868 . - DOI - PMC - PubMed
    1. Loreni F, Mancino M, Biffo S. Translation factors and ribosomal proteins control tumor onset and progression: how? Oncogene. 2014;33(17):2145–56. Epub 2013/05/07. doi: 10.1038/onc.2013.153 . - DOI - PubMed
    1. Brar GA, Weissman JS. Ribosome profiling reveals the what, when, where and how of protein synthesis. Nat Rev Mol Cell Biol. 2015;16(11):651–64. Epub 2015/10/16. doi: 10.1038/nrm4069 . - DOI - PMC - PubMed
    1. Ingolia NT, Lareau LF, Weissman JS. Ribosome Profiling of Mouse Embryonic Stem Cells Reveals the Complexity and Dynamics of Mammalian Proteomes. Cell. 2011;147(4):789–802. doi: 10.1016/j.cell.2011.10.002 - DOI - PMC - PubMed

MeSH terms

Substances