

Explaining variation in adult Anopheles indoor resting abundance: the relative effects of larval habitat proximity and insecticide-treated bed net use
- PMID: 28716087
- PMCID: PMC5514485
- DOI: 10.1186/s12936-017-1938-1
Explaining variation in adult Anopheles indoor resting abundance: the relative effects of larval habitat proximity and insecticide-treated bed net use
Abstract
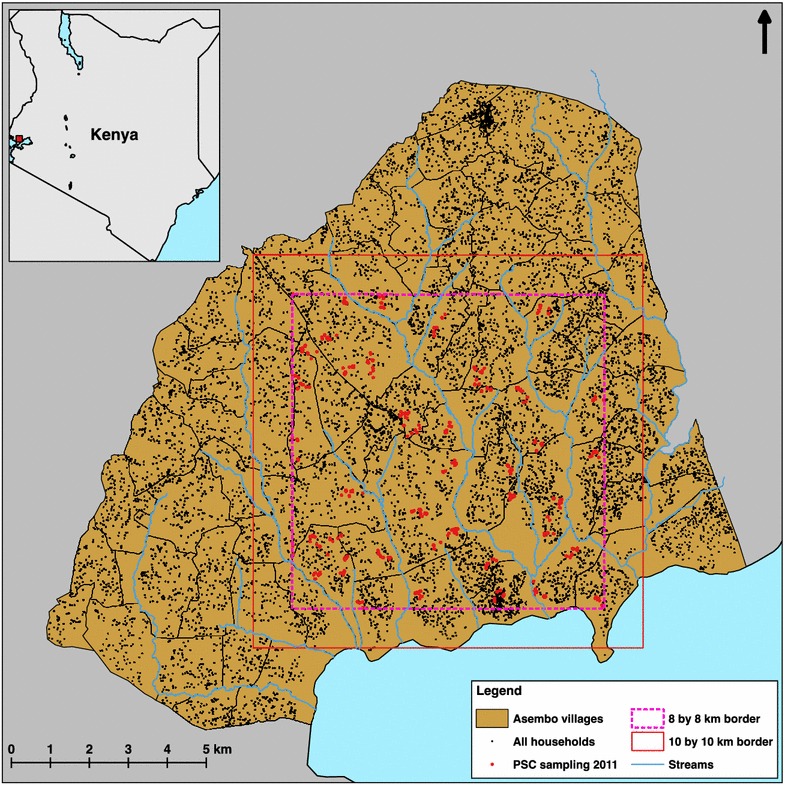
Background: Spatial determinants of malaria risk within communities are associated with heterogeneity of exposure to vector mosquitoes. The abundance of adult malaria vectors inside people's houses, where most transmission takes place, should be associated with several factors: proximity of houses to larval habitats, structural characteristics of houses, indoor use of vector control tools containing insecticides, and human behavioural and environmental factors in and near houses. While most previous studies have assessed the association of larval habitat proximity in landscapes with relatively low densities of larval habitats, in this study these relationships were analysed in a region of rural, lowland western Kenya with high larval habitat density.
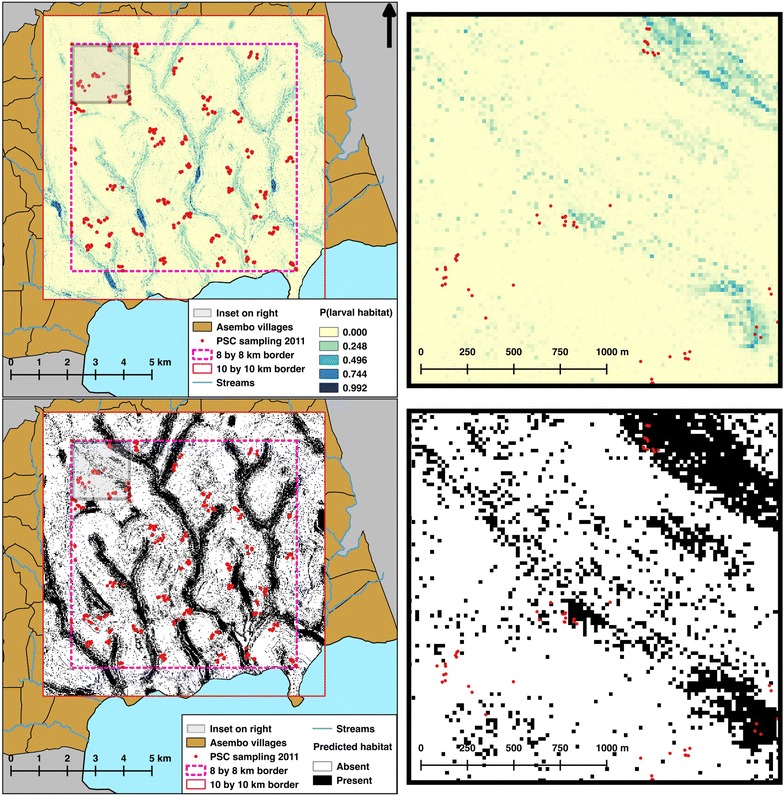
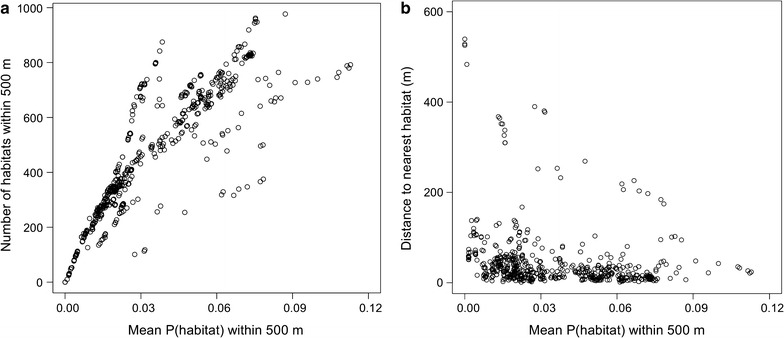
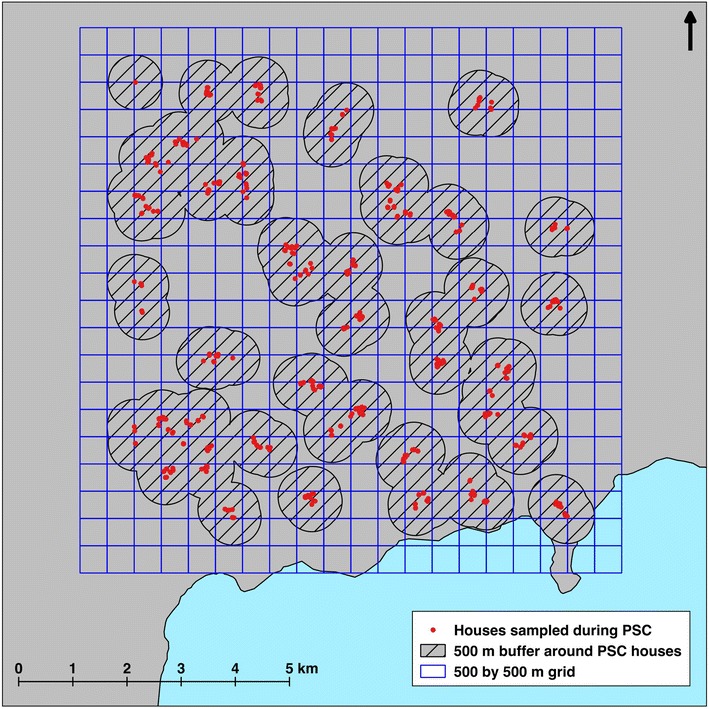
Methods: 525 houses were sampled for indoor-resting mosquitoes across an 8 by 8 km study area using the pyrethrum spray catch method. A predictive model of larval habitat location in this landscape, previously verified, provided derivations of indices of larval habitat proximity to houses. Using geostatistical regression models, the association of larval habitat proximity, long-lasting insecticidal nets (LLIN) use, house structural characteristics (wall type, roof type), and peridomestic variables (cooking in the house, cattle near the house, number of people sleeping in the house) with mosquito abundance in houses was quantified.
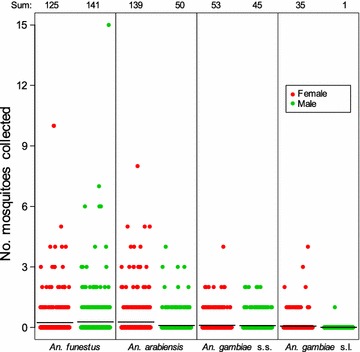
Results: Vector abundance was low (mean, 1.1 adult Anopheles per house). Proximity of larval habitats was a strong predictor of Anopheles abundance. Houses without an LLIN had more female Anopheles gambiae s.s., Anopheles arabiensis and Anopheles funestus than houses where some people used an LLIN (rate ratios, 95% CI 0.87, 0.85-0.89; 0.84, 0.82-0.86; 0.38, 0.37-0.40) and houses where everyone used an LLIN (RR, 95% CI 0.49, 0.48-0.50; 0.39, 0.39-0.40; 0.60, 0.58-0.61). Cooking in the house also reduced Anopheles abundance across all species. The number of people sleeping in the house, presence of cattle near the house, and house structure modulated Anopheles abundance, but the effect varied with Anopheles species and sex.
Conclusions: Variation in the abundance of indoor-resting Anopheles in rural houses of western Kenya varies with clearly identifiable factors. Results suggest that LLIN use continues to function in reducing vector abundance, and that larval source management in this region could lead to further reductions in malaria risk by reducing the amount of an obligatory resource for mosquitoes near people's homes.
Keywords: Anopheles arabiensis; Anopheles funestus; Anopheles gambiae; Generalized linear models; Geostatistical models; Larval habitats; Malaria vectors; Spatial heterogeneity.
Figures
References
-
- Boyd MF. Historical overview. In: Boyd MF, editor. Malariology: a comprehensive survey of all aspects of this group of diseases from a global standpoint. Philadelphia: W.B. Saunders Co; 1949. pp. 3–25.
MeSH terms
Grants and funding
LinkOut - more resources
Full Text Sources
Other Literature Sources
