. 2017 Sep 4;216(9):2979-2989.
doi: 10.1083/jcb.201607048. Epub 2017 Jul 17.

Microglia control the glycinergic but not the GABAergic synapses via prostaglandin E2 in the spinal cord

Affiliations

Microglia control the glycinergic but not the GABAergic synapses via prostaglandin E2 in the spinal cord

Yasmine Cantaut-Belarif et al. J Cell Biol. .

Abstract

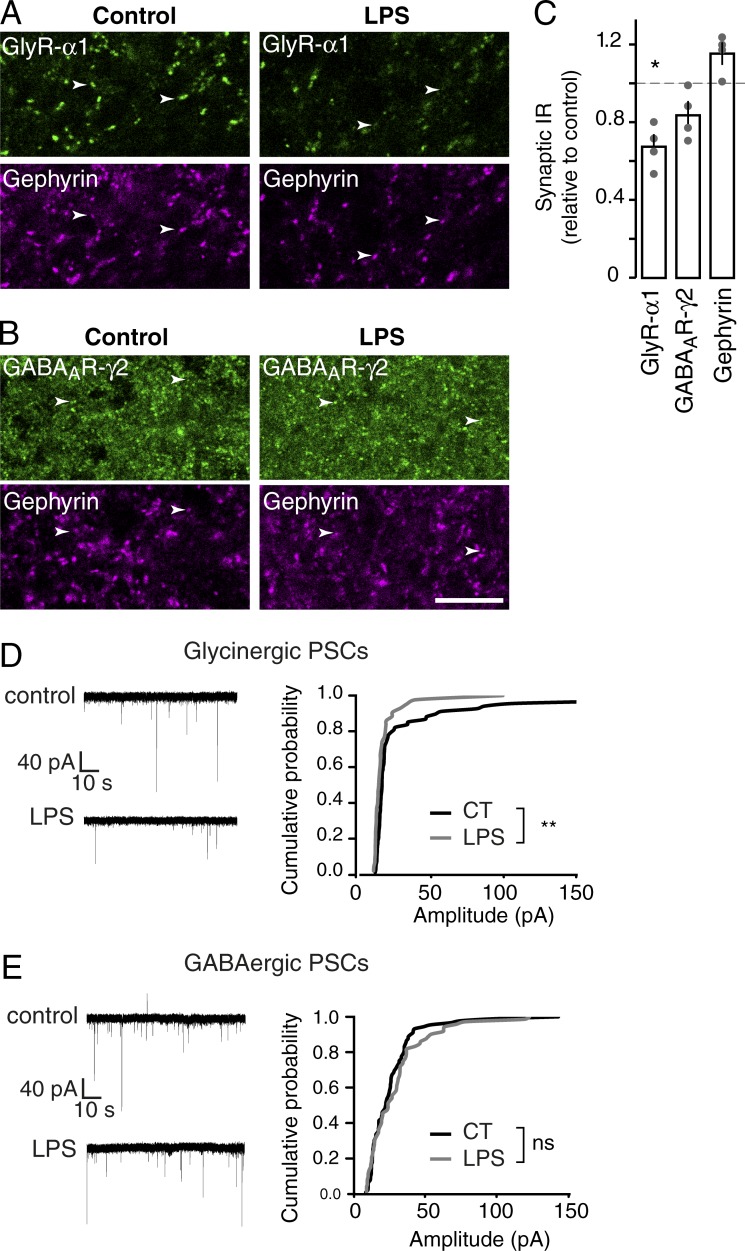
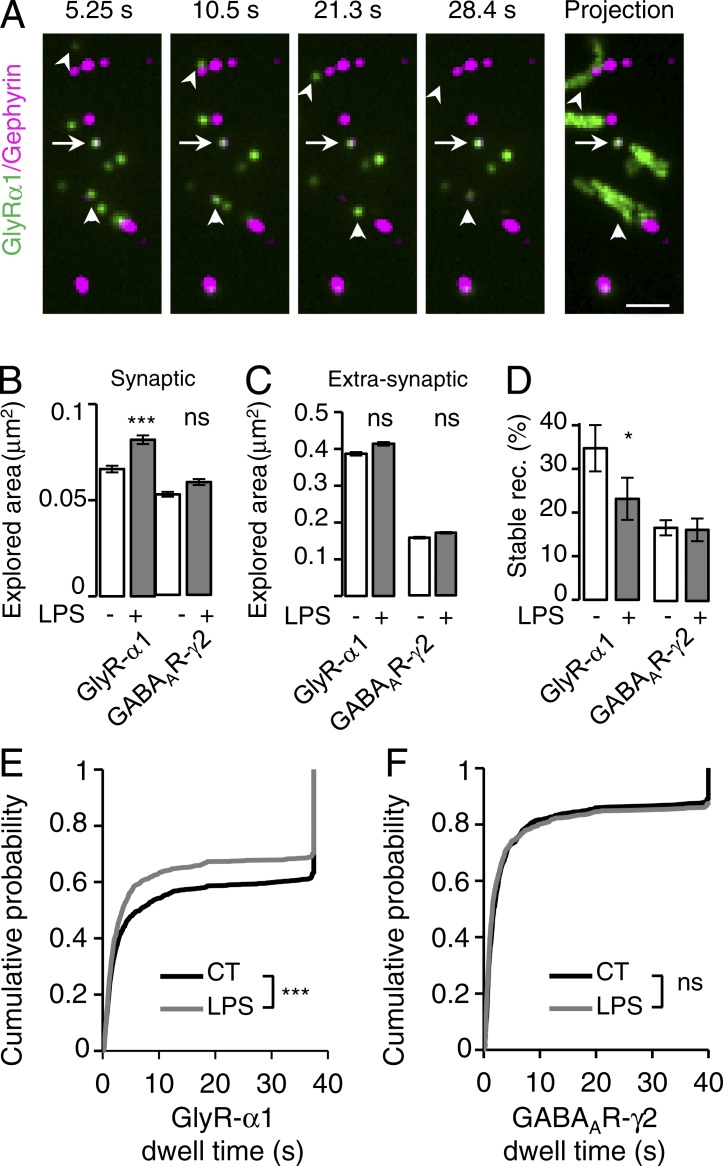
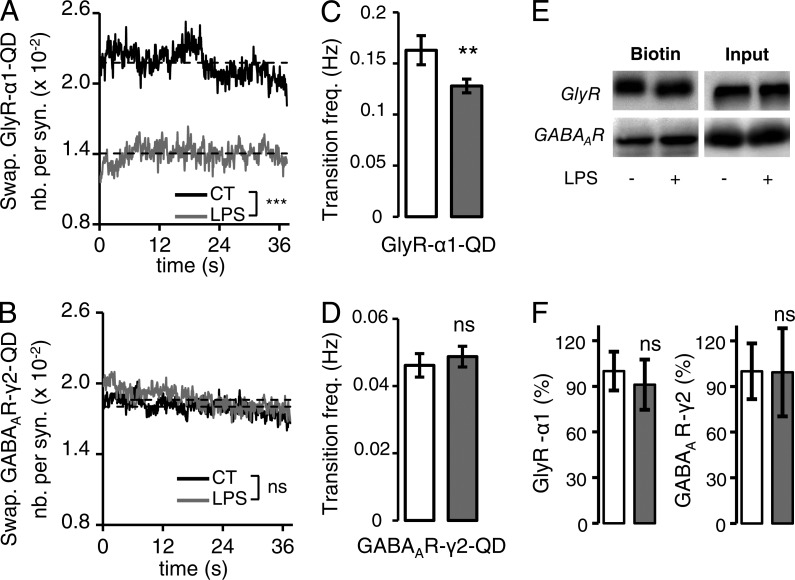
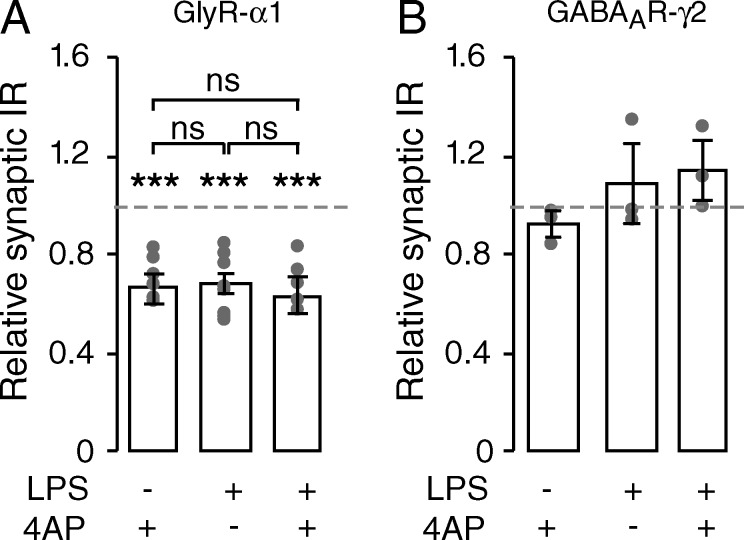
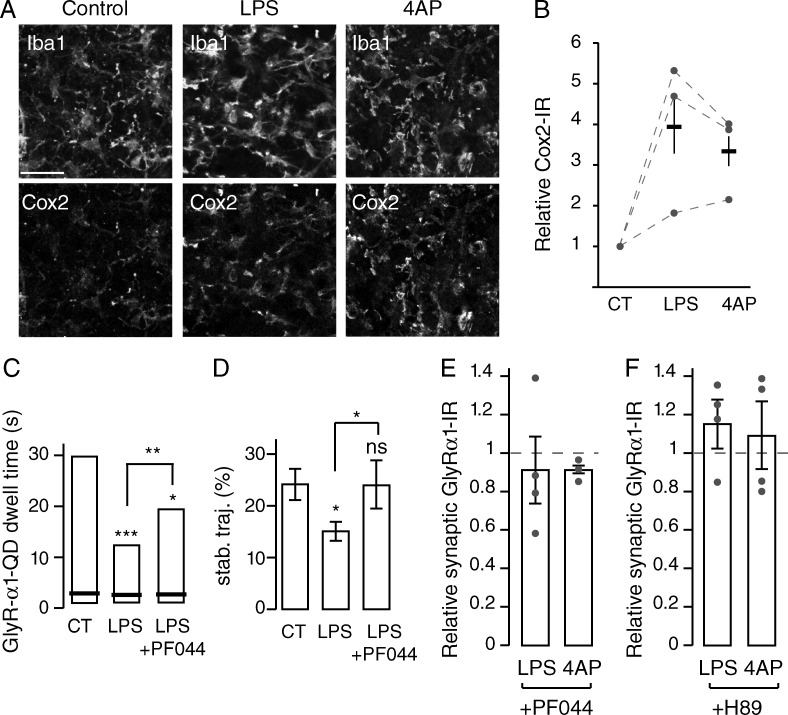
Microglia control excitatory synapses, but their role in inhibitory neurotransmission has been less well characterized. Herein, we show that microglia control the strength of glycinergic but not GABAergic synapses via modulation of the diffusion dynamics and synaptic trapping of glycine (GlyR) but not GABAA receptors. We further demonstrate that microglia regulate the activity-dependent plasticity of glycinergic synapses by tuning the GlyR diffusion trap. This microglia-synapse cross talk requires production of prostaglandin E2 by microglia, leading to the activation of neuronal EP2 receptors and cyclic adenosine monophosphate-dependent protein kinase. Thus, we now provide a link between microglial activation and synaptic dysfunctions, which are common early features of many brain diseases.


Figures

Figure 1.
Figure 1.
Short-term stimulation of microglia specifically decreases GlyR synaptic accumulation and spontaneous glycinergic PSCs. (A and B) Double detection of GlyR α1 IR (A) and GABAAR γ2-IR (B, top) with postsynaptic marker gephyrin (bottom) in the dorsal horn of thoracic spinal cord 30 min after intrathecal injection of vehicle (left) or LPS (right). Arrowheads show clusters of receptors colocalizing with gephyrin clusters. Bar, 10 µm. (C) Quantitative analysis of synaptic GlyR α1 IR and GABAAR γ2 IR colocalized with gephyrin IR in the dorsal horn 30 min after LPS injection. Data are expressed as a percentage of fluorescence intensity in control condition (dotted line). Circles represent single animals. *, P = 0.0209; Mann-Whitney test. (D and E) Representative traces (left) and cumulative histogram of amplitudes (right) of spontaneous glycinergic (D) and GABAergic (E) PSCs recorded from substantia gelatinosa neurons in control conditions and after LPS application. Amplitudes in cumulative graphs are recorded from the same neurons in control conditions (black) and after LPS application (gray). **, P < 0.01; Kolmogorov-Smirnov test.
Figure 2.
Figure 2.
Microglia tune GlyR but not GABAAR synaptic stability through lateral diffusion. (A) Representative time-lapse recording of GlyR α1 QDs (green) and mRFP–gephyrin fluorescent domains (purple). A maximum intensity projection of 500 frames recorded at 13 Hz is also shown (right). Stable GlyR α1 QDs stay at mRFP–gephyrin synapses during the whole recording session (arrows). Mobile GlyR α1 QDs (arrows) swapped between synaptic and extrasynaptic compartments. Bar, 1 µm. (B and C) Explored area of synaptic (B) and extrasynaptic (C) receptors in control (white) and after LPS application (gray). n = 4 and 5 independent cultures for GlyR α1 IR and GABAAR γ2 IR, respectively. Mean ± SEM; ***, P < 0.001; t test. (D) Percentage of stable synaptic receptors detected during the imaging session. Mean ± SEM; *, P < 0.05; t test). (E and F) Synaptic dwell time distributions in control (black) and after LPS application (gray). GlyR: nCT = 1,384 and nLPS = 1,130 trajectories. GABAAR: nCT = 795 and nLPS = 909 trajectories. ns, P > 0.05; ***, P < 0.001; Kolmogorov-Smirnov test.
Figure 3.
Figure 3.
Short-term stimulation of microglia decreases the proportion of synaptic swapping trajectories. (A and B) SC of swapping GlyR α1 (A) and GABAAR γ2 (B) in control (black) and after LPS application (gray). (C and D). Transition frequency of GlyR α1 QDs (C) and GABAAR γ2 QDs (D) in and out of the synapses. Mean ± SEM; ns, P > 0.05; **, P < 0.01; t test. (E) Representative Western blots of GlyR α1 and GABAAR γ2 in the total amount of protein (input) or in the biotinylated fraction at the cell surface (biotin) in control of LPS-treated cells. (F) Mean ratio (±SEM) of surface-to-total GABAAR γ2 and GlyR α1 levels in control condition (white) and after LPS application (gray). Data are expressed as a percentage of control (n = 5 and 4 cultures, respectively; ns, P > 0.05; t test).
Figure 4.
Figure 4.
The adaptive plastic regulation of GlyR is modulated by microglia. Fluorescence intensities relative to control (mean ± SEM) of synaptic GlyR α1 IR (A) and GABAAR γ2 IR (B) after 15-min application of 4AP preceded (or not) by 30-min LPS stimulation of microglia in organotypic slices of spinal cords. The effects of 4AP and LPS treatments are not additive. Circles represent single cultures; ns, P > 0.05; ***, P < 0.001; Mann-Whitney test.
Figure 5.
Figure 5.
PGE2 mediates microglial regulation of synaptic GlyR accumulation via EP2 receptors. (A) Double labeling of organotypic slices showing Cox-2 and Iba1 IRs in control condition and after 30-min LPS application or 15-min 4AP application. Cox-2 IR is restricted to microglia. Bar, 20 µm. (B) Quantification (mean ± SEM) of Cox-2 fluorescence intensities over the corresponding Iba1 profiles in control (CT), LPS, and 4AP conditions. Circles represent single experiments. (C and D) The modulation of GlyR α1 QD synaptic dwell time (C) and stability (D) in control (CT), after LPS application (LPS), and after LPS and PF04418948 treatment (LPS + PF044). (C) Synaptic dwell time distributions indicating 25, 50 (black bar), and 75% of all trajectories. *, P < 0.05; **, P < 0.01; ***, P < 0.001; Kolmogorov-Smirnov test. (D) Percentage of stable synaptic trajectories detected during the imaging session (n = 3 independent experiments; mean ± SEM; ns, P > 0.05; *, P < 0.05; t test). (E and F) Fluorescence intensities relative to control of synaptic GlyR α1 IR after application of LPS or 4AP in the presence of EP2 receptor antagonist PF04418948 (E) or the PKA antagonist H-89 (F) in organotypic slices. Mean ± SEM; circles represent single experiments.

References

    1. Ahmadi S., Lippross S., Neuhuber W.L., and Zeilhofer H.U.. 2002. PGE(2) selectively blocks inhibitory glycinergic neurotransmission onto rat superficial dorsal horn neurons. Nat. Neurosci. 5:34–40. 10.1038/nn778 - DOI - PubMed
    1. Bannai H., Lévi S., Schweizer C., Dahan M., and Triller A.. 2006. Imaging the lateral diffusion of membrane molecules with quantum dots. Nat. Protoc. 1:2628–2634. 10.1038/nprot.2006.429 - DOI - PubMed
    1. Basbaum A.I., Bautista D.M., Scherrer G., and Julius D.. 2009. Cellular and molecular mechanisms of pain. Cell. 139:267–284. 10.1016/j.cell.2009.09.028 - DOI - PMC - PubMed
    1. Béchade C., Cantaut-Belarif Y., and Bessis A.. 2013. Microglial control of neuronal activity. Front. Cell. Neurosci. 7:32 10.3389/fncel.2013.00032 - DOI - PMC - PubMed
    1. Berta T., Park C.-K., Xu Z.-Z., Xie R.-G., Liu T., Lü N., Liu Y.-C., and Ji R.-R.. 2014. Extracellular caspase-6 drives murine inflammatory pain via microglial TNF-α secretion. J. Clin. Invest. 124:1173–1186. 10.1172/JCI72230 - DOI - PMC - PubMed

Publication types

MeSH terms

LinkOut - more resources