. 2017 Sep 4;214(9):2671-2693.
doi: 10.1084/jem.20162040. Epub 2017 Jul 17.

Protein kinase D at the Golgi controls NLRP3 inflammasome activation

Affiliations

Protein kinase D at the Golgi controls NLRP3 inflammasome activation

Zhirong Zhang et al. J Exp Med. .

Abstract

The inflammasomes are multiprotein complexes sensing tissue damage and infectious agents to initiate innate immune responses. Different inflammasomes containing distinct sensor molecules exist. The NLRP3 inflammasome is unique as it detects a variety of danger signals. It has been reported that NLRP3 is recruited to mitochondria-associated endoplasmic reticulum membranes (MAMs) and is activated by MAM-derived effectors. Here, we show that in response to inflammasome activators, MAMs localize adjacent to Golgi membranes. Diacylglycerol (DAG) at the Golgi rapidly increases, recruiting protein kinase D (PKD), a key effector of DAG. Upon PKD inactivation, self-oligomerized NLRP3 is retained at MAMs adjacent to Golgi, blocking assembly of the active inflammasome. Importantly, phosphorylation of NLRP3 by PKD at the Golgi is sufficient to release NLRP3 from MAMs, resulting in assembly of the active inflammasome. Moreover, PKD inhibition prevents inflammasome autoactivation in peripheral blood mononuclear cells from patients carrying NLRP3 mutations. Hence, Golgi-mediated PKD signaling is required and sufficient for NLRP3 inflammasome activation.


Figures

Figure 1.
Figure 1.
Activation of NLRP3 inflammasome induces DAG enrichment in the Golgi. (A) Confocal fluorescence imaging of LPS-primed WT BMDMs ectopically expressing a GFP-tagged DAG probe pretreated with DMSO or 10 µM U71322 for 1 h, followed by 7.5 µM nigericin stimulation for 20 min in the presence of DMSO or 10 µM U71322. Cells were immunostained using an antibody against giantin (a marker for Golgi). Nuclei were stained with DAPI. Regions of interest (ROI) are indicated by boxes. Bars: 10 µm; [region of interest (ROI)] 2 µm. (B) Confocal fluorescence imaging of LPS-primed NLRP3-KO BMDMs ectopically expressing a GFP-tagged DAG probe (GFP) pretreated with DMSO or 10 µM U71322 for 1 h, followed by 7.5 µM nigericin stimulation for 20 min in presence of DMSO or 10 µM U71322. Cells were immunostained with an antibody against giantin. Nuclei were stained with DAPI. Bar, 10 µm. Data shown are representative of three independent experiments.
Figure 2.
Figure 2.
Activation of NLRP3 inflammasome induces mitochondrial clustering around the Golgi. (A) Confocal fluorescence imaging of LPS-primed WT and NLRP3-KO BMDMs treated or not with 5 mM ATP or 15 µM nigericin for 20 min or with 500 µg/ml alum or 125 µg/ml nano-SiO2 for 6 h. Cells were coimmunostained using antibodies against Tom20 (a marker for mitochondria) and giantin. Nuclei were stained with DAPI. Bars, 10 µm. (B) Confocal fluorescence imaging of PMA-differentiated THP-1 cells treated or not with 15 µM nigericin for 20 min, 500 µg/ml alum, or 125 µg/ml nano-SiO2 for 6 h. Cells were coimmunostained with anti-Tom20 and anti-giantin antibodies. Nuclei were stained with DAPI. Bar, 10 µm. (C) Confocal fluorescence imaging of LPS-primed BMDMs treated or not with 1 µg/ml poly(dA:dT) for 4 h, 0.5 µg/ml flagellin for 4 h, or 0.1 nM Tcd B for 2 h. Cells were coimmunostained using antibodies against Tom20 and giantin. Nuclei were stained with DAPI. Bar, 10 µm. Data shown are representative of three independent experiments.
Figure 3.
Figure 3.
Disruption of Golgi integrity blocks the NLRP3 inflammasome activation. (A) Immunoblotting of culture supernatants (Sup) and lysates (Lys) from LPS-primed BMDMs pretreated with ethanol (control) or 1 µg/ml, 5 µg/ml, or 25 µg/ml BFA for 1 h, followed by 7.5 µM nigericin treatment for 40 min in the presence of ethanol or BFA at the indicated concentration. Antibodies against caspase-1 (recognizing both cleaved [p20] and uncleaved protein) and IL-1β (recognizing both cleaved and uncleaved protein) were used. Tubulin was used as a loading control. (B) ELISA measurements of IL-1β in culture supernatants from LPS-primed BMDMs treated as in A. The values are expressed as means ± SEM. ***, P < 0.001 (t test); n.s., not significant. (C) Confocal fluorescence imaging of LPS-primed BMDMs pretreated with ethanol or 5 µg/ml BFA for 1 h, followed by 7.5 µM nigericin treatment for 40 min in the presence of ethanol or 5 µg/ml BFA. Cells were coimmunostained with antibodies against ASC and giantin. Nuclei were stained with DAPI. Bars: 10 µm; (ROI) 2 µm. Arrowheads indicate the ASC foci. (D) Quantification of cells containing ASC foci shown in C. ***, P < 0.001 (t test). Data shown are representative of three independent experiments.
Figure 4.
Figure 4.
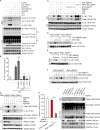
Deficiency of PKD specifically blocks the activation of the NLRP3 inflammasome. (A) Immunoblotting of culture supernatants (Sup) and lysates (Lys) from LPS-primed BMDMs pretreated with DMSO, 5 µM Gö 6983, 10 µM CRT 0066101, 5 µM Gö 6976, 30 µM CID 755673, or 50 µM 2-APB for 1 h, followed by ATP treatment for 40 min in the presence of DMSO or indicated inhibitors. l.e., long exposure; s.e., short exposure. (B) ELISA measurements of IL-1β in culture supernatants from LPS-primed BMDMs treated as in A. The values are expressed as means ± SEM. p-values were calculated between ATP alone–treated group and ATP plus inhibitor–treated group. ***, P < 0.001 (t test); N.D., not detected; n.s., not significant. (C) Immunoblotting of culture supernatants (Sup) and lysates (Lys) from LPS-primed PBMCs pretreated with DMSO or 10 µM CRT 0066101 for 1 h, followed by treatment with 5 mM ATP for 40 min, 15 µM nigericin for 40 min, 250 or 500 µg/ml alum for 6 h, or 125 or 250 µg/ml nano-SiO2 for 6 h in the presence of DMSO or 10 µM CRT 0066101. (D–F) Immunoblotting of culture supernatants (Sup) and lysates (Lys) from BMDMs isolated from LysM-Cre–negative floxed PKD1-PKD3 (PKD1-PKD3fl/fl) control mice and LysM-Cre–positive myeloid-specific PKD1-PKD3 double-KO (PKD1-PKD3Δmy) mice. Cells were primed with LPS for 4 h. After pretreatment with DMSO or CRT 0066101 for 1 h, cells were stimulated with ATP for 40 min (D), alum (E), or nano-SiO2 (F) as indicated for 6 h in the presence of DMSO or 10 µM CRT 0066101. (G) Immunoblotting of culture supernatants (Sup) and lysates (Lys) from BMDMs isolated from PKD1-PKD3fl/fl control mice and PKD1-PKD3Δmy mice. Cells were transfected with control siRNA (siControl) or siRNA against PKD2 (siPKD2) as indicated for 36 h. After LPS priming for 4 h, cells were treated or not with 5 mM ATP or 7.5 µM nigericin for 40 min. (H) Quantitative PCR analysis of BMDMs isolated from PKD1-PKD3fl/fl control mice and PKD1-PKD3Δmy mice were transfected with control siRNA (siControl) or siRNA against PKD2 (siPKD2) as indicated for 36 h. The level of PKD2 mRNA relative to Hprt mRNA was analyzed by quantitative PCR. The values are expressed as means ± SEM. **, P < 0.01 (t test). (I) Immunoblotting of culture supernatants (Sup) and lysates together with culture supernatants (Lys + Sup) from Raw-ASC WT, Caspase-1–KO (Casp1 ko), NLRP3-KO (NLRP3 ko), GSDMD-KO (GSDMD ko), and PKD1/PKD2/PKD3 triple-KO (PKD1/2/3 ko) cells. LPS-primed cells were treated with or without 10 µM nigericin for 1 h. Asterisk (*) represents unspecific bands. Data shown are representative of at least three independent experiments.
Figure 5.
Figure 5.
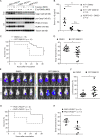
PKD activity is required for NLRP3 inflammasome activation in vivo. (A) Immunoblotting of culture supernatants (Sup) and lysates (Lys) from BMDMs isolated from PKD1-PKD3fl/fl control mice, PKD1-PKD3Δmy mice, and NLRP3-KO mice. LPS-primed cells were infected with E. coli DH5α or S. aureus at indicated multiplicity of infection (MOI) for 3 h. (B) ELISA analysis of serum IL-1β from LPS-injected mice. Mice were intraperitoneally pretreated with DMSO or 10 mg/kg CRT 0066101 as indicated for 1 h, followed by intraperitoneal injection of 20 mg/kg LPS. Blood were collected at 2 h after LPS injection. The values are expressed as means ± SEM. **, P < 0.01; ***, P < 0.001; n.s., not significant (Mann–Whitney test). (C) The survival curve of S. aureus–infected mice. WT mice were intraperitoneally pretreated with DMSO (n = 15) or 10 mg/kg CRT 0066101 (n = 15) for 1 h, followed by intraperitoneal infection of S. aureus (7 × 10⁸ per mouse). **, P < 0.01 (Gehan–Breslow–Wilcoxon test). (D–F) Analysis of S. aureus–infected mice shown in C. Body temperature (D) and bacterial load (E and F) of each mouse was measured at 6 h after infection. The bacterial loads were shown in percentage of luminescence at 0 h. The values are expressed as means ± SEM. *, P < 0.05; **, P < 0.01 (Mann–Whitney test). (G) The survival curve of S. aureus–infected PKD1-PKD3fl/fl mice (n = 8) and PKD1-PKD3Δmy (n = 7) mice. Mice were treated by i.p. infection of S. aureus (7 × 10⁸ per mouse). *, P < 0.05 (Gehan–Breslow–Wilcoxon test). (H) Body temperature of mice shown in G at 6 h after infection. The values are expressed as means ± SEM. *, P < 0.05 (Mann–Whitney test). Data shown in A are the representative of three independent experiments, whereas images in D are representative of 15 mice in each group.
Figure 6.
Figure 6.
Deficiency of PKD blocks recruitment of ASC to the NLRP3 inflammasome. (A) Fluorescence imaging of LPS-primed BMDMs pretreated with DMSO or 10 µM CRT 0066101 for 1 h, followed by stimulation with 5 mM ATP in presence of DMSO or 10 µM CRT for 20 min. Cells were immunostained with an anti-ASC antibody. Nuclei were stained with DAPI. Bar, 10 µm. Merged pictures with bright-field (BF) microscopy signals are shown. Arrowheads indicate the ASC specks. (B) Quantification of ASC speck–containing BMDMs of experiments represented in A. The values are expressed as means ± SEM. ***, P < 0.001 (t test). (C) Fluorescence imaging of differentiated THP-1 cells pretreated with DMSO or 10 µM CRT 0066101 for 1 h, followed by stimulation with 15 µM nigericin in presence of DMSO or 10 µM CRT for 30 min. Cells were immunostained with an anti-ASC antibody. Nuclei were stained with DAPI. Bar, 50 µm. Arrowheads indicate ASC specks. (D) Quantification of ASC speck–containing THP-1 cells of experiments represented in C. The values are expressed as means ± SEM. ***, P < 0.001 (t test). (E) Immunoblotting of culture supernatants (Sup), lysates (Lys), and cross-linked pellets (Pellet) from differentiated THP-1 cells pretreated with DMSO, 10 µM CRT, or 25 µM BAPTA-AM for 1 h, followed by treatment with 15 µM nigericin in presence of DMSO, 10 µM CRT, or 25 µM BAPTA-AM for 40 min. (F) Quantification of ASC speck–containing LPS-primed BMDMs isolated from PKD1-PKD3fl/fl and PKD1-PKD3Δmy mice. Cells were treated with 2.5 mM ATP or 7.5 µM nigericin for 20 min. The values are expressed as means ± SEM. ***, P < 0.001 (t test). Data shown are representative of at least three independent experiments.
Figure 7.
Figure 7.
PKD inhibition results in NLRP3 retention at MAMs close to Golgi. (A) Confocal fluorescence imaging of PMA-differentiated THP-1 cells pretreated with DMSO or 10 µM CRT for 1 h, followed by stimulation with 15 µM nigericin in the presence of DMSO or CRT for 30 min. Cells were coimmunostained with anti-NLRP3 and anti-ASC antibodies. PMA-differentiated NLRP3-KO THP-1 cells treated with nigericin and CRT was used as a negative control for anti-NLRP3 antibody immunostaining. Nuclei were stained with DAPI. Regions of interest (ROIs) are indicated by boxes. Bars: 10 µm; (ROI) 2 µm. Arrowheads indicate small NLRP3 foci; arrows indicate NLRP3 disc-like structures. (B) Quantification of cells containing small foci or disc-like structures in experiments represented in A. The values are expressed as means ± SEM. ***, P < 0.001 (t test); N.D., not detected. (C) Confocal fluorescence imaging of THP-1 cells pretreated with DMSO or 10 µM CRT for 1 h, followed by stimulation with 15 µM nigericin in the presence of DMSO or CRT for 30 min. Cells were coimmunostained with antibodies against NLRP3 and GM130. Nuclei were stained with DAPI. ROIs are indicated by boxes. Bars: 10 µm; (ROI) 2 µm. The arrowhead indicates a NLRP3 small focus, whereas the arrow indicates NLRP3 distributed in a disc-like structure. (D) 3D-SIM superresolution microscopy of differentiated THP-1 cells pretreated with 10 µM CRT for 1 h, followed by stimulation with 15 µM nigericin in the presence of 10 µM CRT for 30 min. Cells were coimmunostained with antibodies against NLRP3 and GM130. Nuclei were stained with DAPI. ROIs are indicated by boxes. Bars: 10 µm; (ROI) 2 µm. (E) Immunoblotting of lysates from indicated fractionations (Mc, crude mitochondria; Mp, pure mitochondria) isolated from THP-1 cells pretreated with DMSO or 10 µM CRT for 1 h, followed by stimulation with 15 µM nigericin (Ni) in the presence of DMSO or CRT (Ni + CRT) for 30 min. Data shown are representative of at least three independent experiments.
Figure 8.
Figure 8.
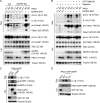
PKD phosphorylates NLRP3 at Ser293 (in mouse, Ser295 in human) to release it from MAMs. (A) Coimmunoprecipitation of exogenous FLAG-tagged NLRP3 with HA-tagged PKD1 and vice versa in HEK293t cells. (B) Coimmunoprecipitation of exogenous FLAG-tagged WT (WT) NLRP3, NLRP3 lacking the pyrin domain (ΔPyrin), NLRP3 lacking the nucleotide-binding domain (ΔNBD), or NLRP3 lacking the leucine-rich repeats (ΔLRR) with GFP-tagged constitutively active mutant (ca) PKD1 in HEK293t cells. Asterisk (*) represents a band corresponding to autophosphorylation of GFP-tagged PKD1. (C) Coimmunoprecipitation of exogenous FLAG-tagged WT NLRP3, ΔNBD f1, ΔNBD f2, ΔNBD f3, S219A, T231A, S263;T6;9;76A (S263A; T266A; T269A; T276A), S293A, T318A, or S331;332A (S331A; S333A) NLRP3 with GFP-tagged constitutively active mutant (ca) PKD1 in HEK293t cells. Asterisk (*) represents a band corresponding to autophosphorylation of GFP-tagged PKD1. (D) Immunoblotting of lysates from HEK293t cells ectopically expressing FLAG-tagged WT or S293A mutant NLRP3 together with GFP-tagged WT or ca PKD1. (E) Immunoprecipitation of endogenous NLRP3 in BMDMs isolated from WT and NLRP3-KO mice. LPS-primed BMDMs were treated with or without 5 mM ATP or 7.5 µM nigericin as indicated for 30 min. Asterisk (*) represents an unspecific band. (F) Confocal fluorescence imaging of differentiated THP-1 cells pretreated with DMSO or 10 µM CRT 0066101 for 1 h, followed by 15 µM nigericin treatment in the presence of DMSO or 10 µM CRT 0066101 for 30 min. Cells were coimmunostained with antibodies against NLRP3 and p-NLRP3 (Ser293). Nuclei were stained with DAPI. Bar, 10 µm. The arrowhead indicates a small NLRP3 focus colocalizing with p-NLRP3 signal, whereas the arrow indicates NLRP3 distributed in a disc-like structure lacking the p-NLRP3 signal. (G) Immunoblotting of culture supernatants (Sup) and lysates (Lys) from WT and NLRP3-KO THP-1 cells reconstituted with empty vector (e.v.), WT, S293A, or S293E mutant NLRP3. PMA-differentiated cells were treated with 15 µM nigericin for 30 min. (H) ELISA measurements of IL-1β in culture supernatants from cells treated as in G. The values are expressed as means ± SEM. ***, P < 0.001 (t test). (I) Confocal fluorescence imaging of NLRP3-KO THP-1 cells reconstituted with WT, S293A, or S293E mutant NLRP3. Cells were coimmunostained with antibodies against NLRP3 and GM130. Nuclei were stained with DAPI. Bar, 10 µm. The arrowhead indicates a small NLRP3 focus, whereas the arrow indicates NLRP3 distributed in a disc-like structure. (J) Quantification of cells containing small foci or disc-like structures in experiments represented in I. The values are expressed as means ± SEM. **, P < 0.01; ***, P < 0.001 (t test). N.D., not detected. Data shown are representative of three independent experiments.
Figure 9.
Figure 9.
PKD activity at the Golgi is required and sufficient to activate the NLRP3 inflammasome. (A) Immunoblotting of culture supernatants (Sup) and lysates (Lys) from THP-1 WT and NLRP3-KO cells infected with lentiviruses as indicated. Cells were treated with 100 nM PMA for 3 h, followed by replacement of fresh medium for 12 h. e.v., empty vector. (B) Immunoblotting of culture supernatants (Sup) and lysates (Lys) from THP-1 NLRP3-KO cells infected with lentiviruses as indicated. PMA-differentiated cells were pretreated with DMSO or 10 µM CRT 0066101 for 1 h, followed by 15 µM nigericin treatment in the presence of DMSO or 10 µM CRT 0066101 for 30 min. e.v., empty vector. (C and D) Immunoblotting of culture supernatants (Sup) and lysates (Lys) from stable THP-1 cell lines ectopically expressing GFP, GFP-tagged PKD1 WT, or a PKD1 mutant without the cysteine-rich domain (ΔCRD; C), GFP-GRIP-tagged WT, constitutively active (ca), or KD PKD1 (D). Cells were treated with 100 nM PMA for 3 h, followed by replacement of fresh medium for 12 h. Asterisk (*) represents an unspecific band. Data shown are representative of three independent experiments.
Figure 10.
Figure 10.
PKD activity is required for activation of the NLRP3 inflammasome in cells from CAPS patients. (A and B) Immunoblotting of culture supernatants (Sup) and lysates (Lys) from PBMCs isolated from CAPS patients carrying the NLRP3 T436N mutation (A) or the R260W mutation (B). Cells were left untreated or treated with 1 µg/ml LPS in the presence of DMSO or CRT 0066101 10 µM for 4 h. (C) Confocal fluorescence imaging of PBMCs isolated from CAPS patients carrying the NLRP3 T436N mutation were left untreated or treated with 1 µg/ml LPS in the presence of DMSO or 10 µM CRT 0066101 for 4 h. Cells were coimmunostained with antibodies against NLRP3 and ASC. Nuclei were stained with DAPI. Regions of interest (ROIs) are indicated by boxes. Bars: 10 µm; (ROI) 2 µm. (D) Model implementing identified mechanisms in the activation of the NLRP3 inflammasome. The dashed black ellipse highlights the interaction of the Golgi with the MAM. Data shown in A to C are representative of experiments using PBMCs isolated from two CAPS patients carrying the same mutation.

References

    1. Abe K., Fuchs H., Boersma A., Hans W., Yu P., Kalaydjiev S., Klaften M., Adler T., Calzada-Wack J., Mossbrugger I., et al. . 2011. A novel N-ethyl-N-nitrosourea-induced mutation in phospholipase Cγ2 causes inflammatory arthritis, metabolic defects, and male infertility in vitro in a murine model. Arthritis Rheum. 63:1301–1311. 10.1002/art.30280 - DOI - PubMed
    1. Agostini L., Martinon F., Burns K., McDermott M.F., Hawkins P.N., and Tschopp J.. 2004. NALP3 forms an IL-1β-processing inflammasome with increased activity in Muckle–Wells autoinflammatory disorder. Immunity. 20:319–325. 10.1016/S1074-7613(04)00046-9 - DOI - PubMed
    1. Aksentijevich I., Putnam C.D., Remmers E.F., Mueller J.L., Le J., Kolodner R.D., Moak Z., Chuang M., Austin F., Goldbach-Mansky R., et al. . 2007. The clinical continuum of cryopyrinopathies: Novel CIAS1 mutations in North American patients and a new cryopyrin model. Arthritis Rheum. 56:1273–1285. 10.1002/art.22491 - DOI - PMC - PubMed
    1. Barker S.A., Caldwell K.K., Pfeiffer J.R., and Wilson B.S.. 1998. Wortmannin-sensitive phosphorylation, translocation, and activation of PLCγ1, but not PLCγ2, in antigen-stimulated RBL-2H3 mast cells. Mol. Biol. Cell. 9:483–496. 10.1091/mbc.9.2.483 - DOI - PMC - PubMed
    1. Baroja-Mazo A., Martín-Sánchez F., Gomez A.I., Martínez C.M., Amores-Iniesta J., Compan V., Barberà-Cremades M., Yagüe J., Ruiz-Ortiz E., Antón J., et al. . 2014. The NLRP3 inflammasome is released as a particulate danger signal that amplifies the inflammatory response. Nat. Immunol. 15:738–748. 10.1038/ni.2919 - DOI - PubMed