. 2017 Aug 1;114(31):8277-8282.
doi: 10.1073/pnas.1706643114. Epub 2017 Jul 17.

MitoNEET-dependent formation of intermitochondrial junctions

Affiliations

MitoNEET-dependent formation of intermitochondrial junctions

Alexandre Vernay et al. Proc Natl Acad Sci U S A. .

Abstract

MitoNEET (mNEET) is a dimeric mitochondrial outer membrane protein implicated in many facets of human pathophysiology, notably diabetes and cancer, but its molecular function remains poorly characterized. In this study, we generated and analyzed mNEET KO cells and found that in these cells the mitochondrial network was disturbed. Analysis of 3D-EM reconstructions and of thin sections revealed that genetic inactivation of mNEET did not affect the size of mitochondria but that the frequency of intermitochondrial junctions was reduced. Loss of mNEET decreased cellular respiration, because of a reduction in the total cellular mitochondrial volume, suggesting that intermitochondrial contacts stabilize individual mitochondria. Reexpression of mNEET in mNEET KO cells restored the WT morphology of the mitochondrial network, and reexpression of a mutant mNEET resistant to oxidative stress increased in addition the resistance of the mitochondrial network to H2O2-induced fragmentation. Finally, overexpression of mNEET increased strongly intermitochondrial contacts and resulted in the clustering of mitochondria. Our results suggest that mNEET plays a specific role in the formation of intermitochondrial junctions and thus participates in the adaptation of cells to physiological changes and to the control of mitochondrial homeostasis.

Keywords: CISD1; endoplasmic reticulum; intermitochondrial junctions; mitoNEET; mitochondria.


Conflict of interest statement

The authors declare no conflict of interest.

Figures

Fig. S1.
Fig. S1.
MEF mNEET KO cells. (A) Genomic sequence of the murine mNEET. The first exon is in uppercase and the following intron in lowercase. The sequence targeted by the guide RNA is underlined and the cutting site of the nuclease is indicated with an arrow. The sequence of each allele is indicated for three independent mutant clones. A dash (-) indicates a deletion, an asterisk (*) a mutation, and bold characters an insertion. (B) Immunofluorescence staining of parental and mNEET KO cells with an antibody specific for mNEET (MRB251) confirms the absence of mNEET in KO cells. (C) WT MEF cells were transfected with mito-RFPand endogenous mNEET stained with MRB251, revealing the presence of endogenous mNEET in mitochondria. (D) To check the general organization of WT cells (Upper) and mNEET KO cells (Lower), both cell lines were transfected with a marker of the ER (Left, YFP-KDEL), or of the Golgi apparatus (Center, B4GALT1-GFP), or the tubulin was stained with an antitubulin antibody, then revealed by an Alexa Fluor-488 secondary antibody. (Scale bars, 10 µm.)
Fig. 1.
Fig. 1.
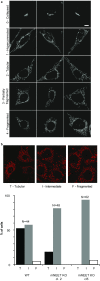
Genetic inactivation of mNEET decreases connectivity of the mitochondrial network. (A) Mito-RFP was expressed in WT (Left) or in mNEET KO MEFs cells (Right) and cells were observed by fluorescence microscopy. (Scale bar, 10 µm.) (B) For each cell, the connectivity of the mitochondrial network was graded 4 (totally fragmented), 3 (partially fragmented), 2 (tubular), or 1 (hyperconnected). The quantification was performed on blinded samples. The average and SEM of 14 independent experiments are indicated. (C) The tubulation index was calculated as described in Materials and Methods. *P < 0.001 (Student t test).
Fig. S2.
Fig. S2.
(A) Evaluation of mitochondrial network connectivity. Fixed cells expressing mito-RFP were examined individually in blinded samples. The mitochondrial network of each cells was scored as hyperconnected (score 1), when mitochondria appeared very long and highly connected; tubular (score 2), when mitochondria were mostly elongated and only a few appeared shorter; partially fragmented (score 3), when most of the mitochondria were short and only a few of them tubular; totally fragmented (score 4), when all mitochondria were short and round. (Scale bar, 10 µm.) Collapsed mitochondria (score 0) were only observed in cells overexpressing mNEET-GFP. Three representative pictures corresponding to these different morphologies are shown. (B) Connectivity of the mitochondrial network in live cells. Live unfixed cells expressing mito-RFP were observed and their mitochondrial network classified as fragmented (F), tubular (T), or intermediate (I). Comparison of WT and mNEET KO cells revealed a more fragmented network in mNEET KO cells. (Scale bar, 10 μm.)
Fig. 2.
Fig. 2.
IMJs are less abundant in mNEET KO cells than in WT cells. WT or mNEET KO cells were fixed, processed for EM, and analyzed in a Helios Dualbeam SEM to generate complete sets of images scanning the whole-cell volume. Mitochondria from three independent experiments were analyzed for WT and for mNEET KO cells. (A) The size of mitochondria was evaluated by counting the number of sections through which individual mitochondria extended along the z axis (z-size) and was not significantly different in WT and mNEET KO cells. (B) A selection of serial pictures showing an IMJ. Pictures were taken with a 10-nm interval, and one picture every five sections is shown. Arrowheads indicate regions of close contact between two adjacent mitochondria. The distance from each section to the first section shown is indicated. (Scale bar, 50 nm.) (C) The percentage of mitochondria engaged in IMJs diminished significantly in mNEET KO cells compared with WT cells. #P = 0.012 Fisher’s exact test; n.s., not significant.
Fig. 3.
Fig. 3.
Conventional EM indicates that the frequency of IMJs is reduced by genetic inactivation of mNEET. WT or mNEET KO cells were fixed and sections were visualized in a TEM. (A) IMJs were defined as regions of close contact between two mitochondria (<20 nm; arrowheads). (Scale bar, 500 nm.) (B) The frequency of IMJs was significantly decreased in mNEET KO cells compared with WT cells. #P = 0.0009 Fisher’s exact test.
Fig. 4.
Fig. 4.
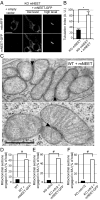
Overexpression of mNEET increases the connectivity of the mitochondrial network. (A) mNEET KO cells were cotransfected with plasmids expressing mitoRFP (Upper) and mNEET-GFP (Lower). As a control, an empty vector replaced the mNEET-GFP plasmid (Left). A mild expression of mNEET-GFP (Center) restored the connectivity of the mitochondrial network, whereas a high overexpression (Right) resulted in the collapse of the mitochondrial network. (Scale bar, 10 µm.) (B) The connectivity of the mitochondrial network in cells expressing low levels of mNEET-GFP was determined as described in the legend to Fig. 1. The mean ± SEM of seven independent experiments are presented. *P < 0.001 (Student t test). Expression of mNEET-GFP increased the connectivity of the mitochondrial network to a WT level. (C) To analyze the effect of mNEET overexpression on IMJs, WT MEF cells were transfected with a plasmid expressing mNEET-GFP. Cells expressing mNEET-GFP were sorted by flow cytometry, and then fixed and processed for EM 1 d later. Arrowheads indicate intermitochondrial contacts where electron-dense structures tethering apposed membranes are visible. (Scale bar, 500 nm.) (D) The frequency of IMJs was quantified as described in the legend to Fig. 3. IMJs were more abundant in transfected cells than in WT cells. (E) The frequency of IMJs was determined in mfn2 KO cells and in mfn2 KO cells overexpressing mNEET-GFP as described above. (F) Similar experiments were performed using cells where both mfn1 and mfn2 were genetically inactivated. #P < 0.001 Fisher’s exact test.
Fig. 5.
Fig. 5.
Regulation of mitochondrial morphology in mNEET KO cells. (A) WT or mNEET KO cells expressing mito-RFP were incubated for 6 h in medium containing 25 µg/mL cycloheximide or not. Cells were then fixed and the connectivity of the mitochondrial network was determined as described in the legend to Fig. 1. The mean ± SEM of three (WT) and eight (mNEET KO) independent experiments is indicated. Mitochondrial fusion was stimulated by cycloheximide in both WT and mNEET KO cells. NT, not treated. (B) WT and mNEET KO cells expressing mito-RFP were exposed to various concentrations of H2O2 for 1 h. They were then fixed and examined, and degree of connectivity of the mitochondrial network determined. The mean ± SEM of seven (WT) and four (mNEET KO) independent experiments is indicated. Mitochondrial connectivity was also determined in mNEET KO cells expressing mNEET-GFP, or mNEET-4Cys-GFP.
Fig. 6.
Fig. 6.
Establishment of ER–mitochondrial contact sites is independent on mNEET. (A) WT, mNEET KO, or mNEET-overexpressing cells were fixed and processed for conventional EM. Sites of juxtaposition of ER and mitochondrial membranes were visualized (arrowheads), and quantified. (Scale bar, 500 nm.) (B) Approximately 6% of mitochondrial membrane was engaged into contacts with the ER in WT cells. This figure did not change significantly in cells overpressing mNEET, and increased slightly in mNEET KO cells.
Fig. S3.
Fig. S3.
Mitochondrial respiration of WT and mNEET KO cells. The basal respiration (Bas.) was first calculated as the oxygen consumption at steady state. The addition of 1 µM oligomycin allowed the identification of the oxygen consumption associated with the production of ATP (13). The addition of 300 nm FCCP revealed the maximal amount of oxygen consumed by the mitochondria (Max.). Finally, the addition of 0.5 µM antimycin A and rotenone enabled the calculation of the nonmitochondrial respiration (NM). In each well the amount of protein was determined, and the oxygen consumption corrected accordingly. *P < 0.05 (Mann–Whitney test, n = 25 independent samples in three independent experiments).

References

    1. Montgomery MK, Turner N. Mitochondrial dysfunction and insulin resistance: An update. Endocr Connect. 2015;4:R1–R15. - PMC - PubMed
    1. Giampazolias E, Tait SW. Mitochondria and the hallmarks of cancer. FEBS J. 2016;283:803–814. - PubMed
    1. Archer SL. Mitochondrial dynamics–Mitochondrial fission and fusion in human diseases. N Engl J Med. 2013;369:2236–2251. - PubMed
    1. Hoppins S, Lackner L, Nunnari J. The machines that divide and fuse mitochondria. Annu Rev Biochem. 2007;76:751–780. - PubMed
    1. Colca JR, et al. Identification of a novel mitochondrial protein (“mitoNEET”) cross-linked specifically by a thiazolidinedione photoprobe. Am J Physiol Endocrinol Metab. 2004;286:E252–E260. - PubMed

Publication types

LinkOut - more resources