Comparative Study
. 2017 Sep 15;292(37):15408-15425.
doi: 10.1074/jbc.M117.784090. Epub 2017 Jul 17.

Surface Toll-like receptor 3 expression in metastatic intestinal epithelial cells induces inflammatory cytokine production and promotes invasiveness

Affiliations
Comparative Study

Surface Toll-like receptor 3 expression in metastatic intestinal epithelial cells induces inflammatory cytokine production and promotes invasiveness

Marit Bugge et al. J Biol Chem. .

Abstract

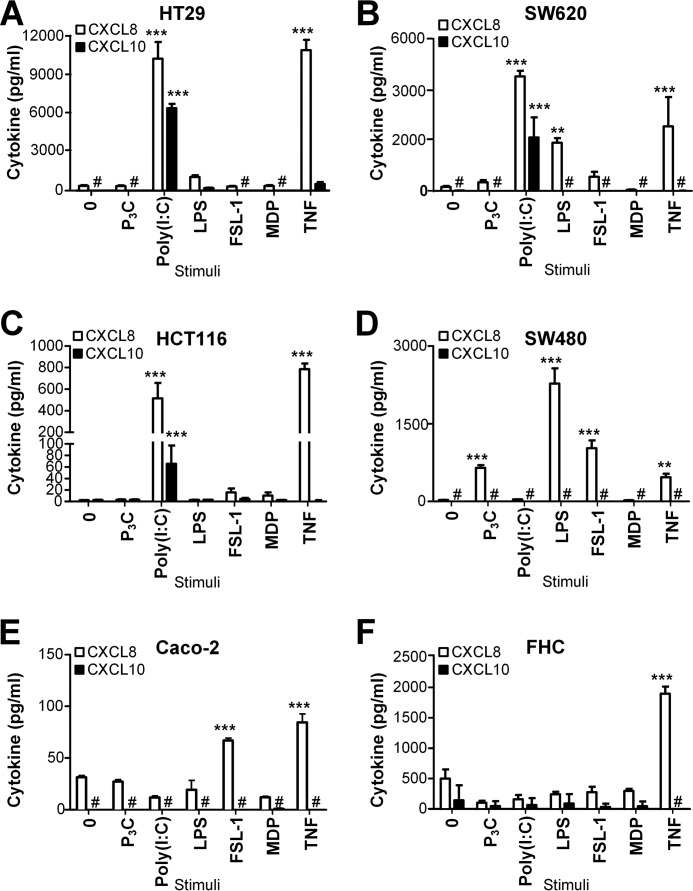
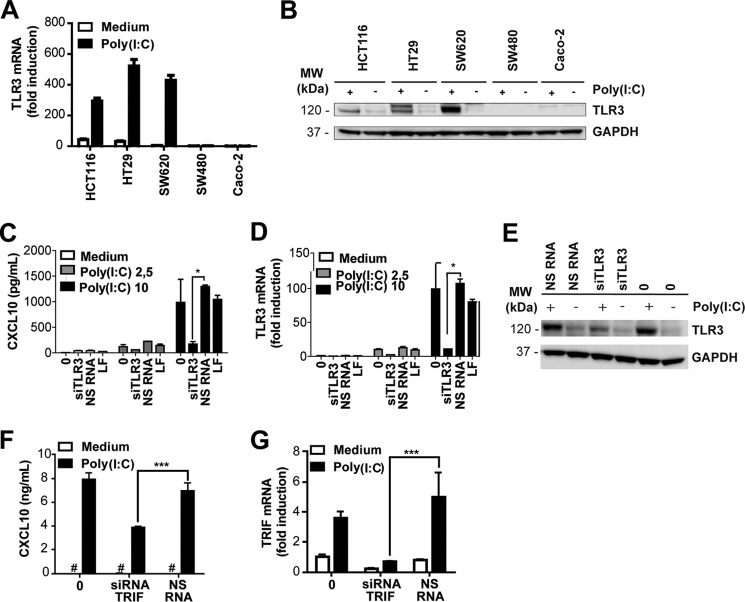
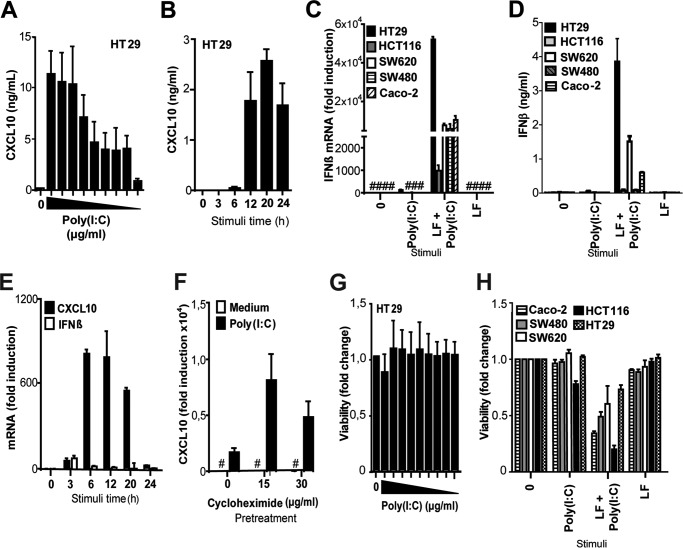
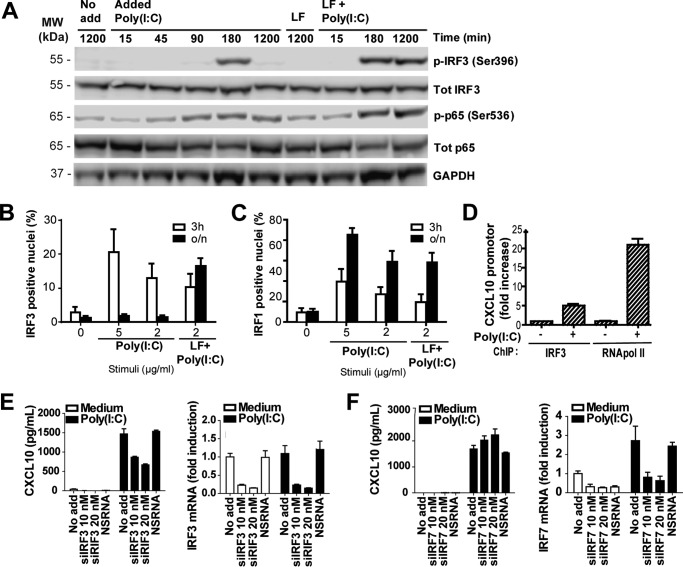
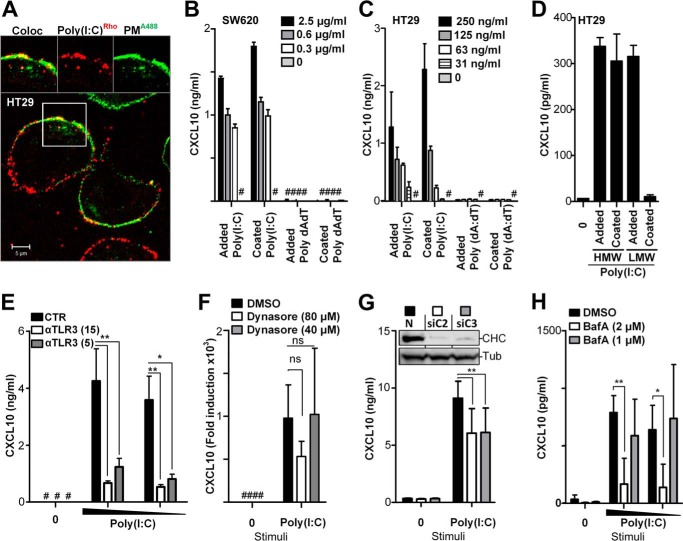
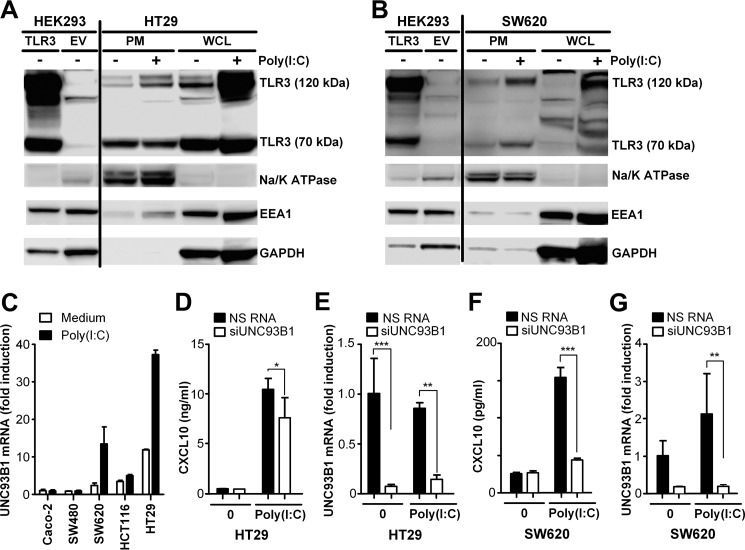
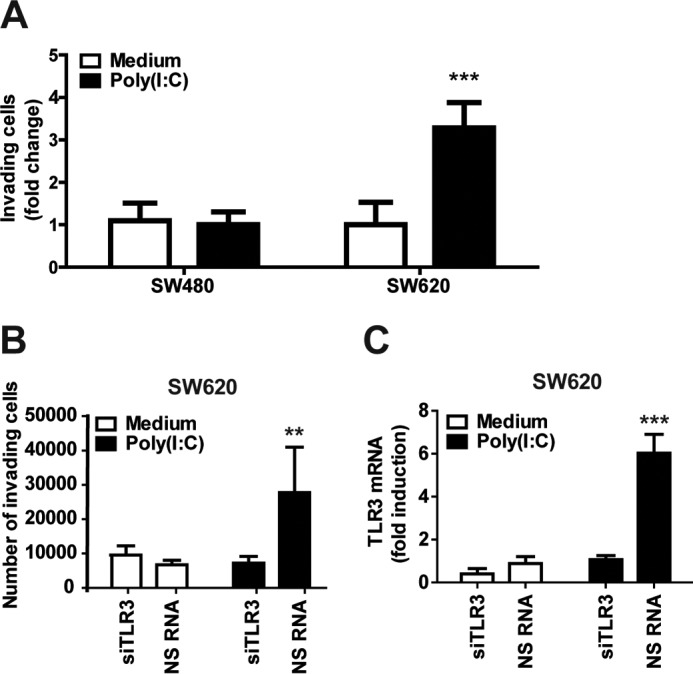
Toll-like receptors (TLRs) are innate immune receptors for sensing microbial molecules and damage-associated molecular patterns released from host cells. Double-stranded RNA and the synthetic analog polyinosinic:polycytidylic acid (poly(I:C)) bind and activate TLR3. This stimulation leads to recruitment of the adaptor molecule TRIF (Toll/IL-1 resistance (TIR) domain-containing adapter-inducing interferon β) and activation of the transcription factors nuclear factor κB (NF-κB) and interferon regulatory factor 3 (IRF-3), classically inducing IFNβ production. Here we report that, unlike non-metastatic intestinal epithelial cells (IECs), metastatic IECs express TLR3 and that TLR3 promotes invasiveness of these cells. In response to poly(I:C) addition, the metastatic IECs also induced the chemokine CXCL10 in a TLR3-, TRIF-, and IRF3-dependent manner but failed to produce IFNβ. This was in contrast to healthy and non-metastatic IECs, which did not respond to poly(I:C) stimulation. Endolysosomal acidification and the endosomal transporter protein UNC93B1 was required for poly(I:C)-induced CXCL10 production. However, TLR3-induced CXCL10 was triggered by immobilized poly(I:C), was only modestly affected by inhibition of endocytosis, and could be blocked with an anti-TLR3 antibody, indicating that TLR3 can still signal from the cell surface of these cells. Furthermore, plasma membrane fractions from metastatic IECs contained both full-length and cleaved TLR3, demonstrating surface expression of both forms of TLR3. Our results imply that metastatic IECs express surface TLR3, allowing it to sense extracellular stimuli that trigger chemokine responses and promote invasiveness in these cells. We conclude that altered TLR3 expression and localization may have implications for cancer progression.

Keywords: CXCL10/interferon γ-induced protein 10 (IP-10); Toll-like receptor (TLR); cancer biology; cell surface; double-stranded RNA (dsRNA); innate immunity; interferon; intestinal epithelium; metastasis.


Conflict of interest statement

The authors declare that they have no conflicts of interest with the contents of this article

Figures

Figure 1.
Figure 1.
IECs display differences in CXCL8 and CXCL10 release in response to TLR ligands. A–F, the intestinal epithelial cell lines HT29 (A), SW620 (B), HCT116 (C), SW480 (D), Caco-2 (E), and FHC (F) were treated with medium (0), P3C (100 ng/ml), poly(I:C) (50 μg/ml), LPS (100 ng/ml), FSL-1 (100 ng/ml), MDP (1 μg/ml), and TNF (100 ng/ml) for 20 h before supernatants were harvested and assayed for CXCL8 and CXCL10 content by ELISA. The results are presented as mean ± S.D. of triplicates and are representative of a minimum of two experiments. ***, p < 0.001; **, p < 0.01 versus medium (one-way ANOVA, Bonferroni post-test).
Figure 2.
Figure 2.
Poly(I:C)-responsive IECs up-regulate TLR3 expression and induce CXCL10 in a TLR3- and TRIF-dependent manner. A, TLR3 mRNA expression in SW620, SW480, HT29, HCT116, and Caco-2 cells treated with medium or poly(I:C) (5 μg/ml) for 24 h before TLR3 expression was determined by qPCR. GAPDH served as an internal control. The results show mean induction of triplicates ± S.D. relative to untreated Caco-2 cells and are representative of three independent experiments. B, TLR3 protein expression in SW620, SW480, HT29, HCT116, and Caco-2 cells left untreated (−) or treated with poly(I:C) (2.5 μg/ml) (+) for 24 h. Western blots were stained with anti-TLR3 (top) or GAPDH as a loading control (bottom). MW, molecular weight. C and D, CXCL10 release (C) and TLR3 mRNA expression (D) in SW620 cells left untreated (0), transfected with TLR3 siRNA (siRNA TLR3.5, 5 nm) or NS RNA (5 nm) or treated with the transfection reagent LF alone for 28 h prior to stimulation with poly(I:C) (2.5 or 10 μg/ml) for 20 h. CXCL10 release in the supernatant was assessed by ELISA. TLR3 mRNA expression in the lysates of the treated SW620 cells was determined by qPCR using GAPDH as an internal control. Results show mean ± S.D. of triplicates and are representative of three independent experiments. E, Western blots showing TLR3 (top) and GAPDH (bottom) expression in SW620 cells transfected with TLR3 siRNA (10 nm), NS RNA (10 nm), or transfection reagent (0) alone for 24 h prior to stimulation with poly(I:C) (2.5 μg/ml) for 24 h. F and G, CXCL10 production (F) and TRIF mRNA expression (G) in HT29 cells left untreated (0) or treated with siRNA against TRIF (20, 15, 10, or 5 nm) or with NS RNA (10 nm) for 24 h prior to stimulation with poly(I:C) (5 μg/ml) for 20 h. CXCL10 content in cell supernatant was assessed by ELISA, whereas silencing of TRIF was confirmed by assessing TRIF mRNA by qPCR using GAPDH as a reference control. The results show mean ± S.D. of triplicates and are representative of two independent experiments. ***, p < 0.001 versus NS RNA (one-way ANOVA, Holm-Sidak multiple comparisons).
Figure 3.
Figure 3.
IFNβ is induced in IECs in response to transfection with poly(I:C) but not in response to poly(I:C) addition. A, HT29 cells were left untreated (0) or stimulated with poly(I:C) (50, 25, 10, 5, 2.5, 1.25, 0.63, 0.31, and 0.15 μg/ml) for 20 h before CXCL10 in the supernatant was assessed by ELISA. B, kinetics of CXCL10 release assessed by ELISA in supernatant from HT29 cells stimulated with poly(I:C) (2.5 μg/ml) for 0, 3, 5, 12, 20, and 24 h. The results are presented as mean ± S.D. of triplicates. C, IFNβ mRNA induction in HT29, HCT116, SW620, SW480, and Caco-2 cells treated with poly(I:C) (2 μg/ml) alone (Poly(I:C)), transfected with poly(I:C) complexed with Lipofectamine RNAimax (LF + Poly(I:C), 2 μg/ml), or treated with only Lipofectamine RNAimax (LF) for 20 h. IFNβ mRNA induction was determined by qPCR. The results are presented as relative induction compared with medium-treated Caco-2 cells. GAPDH served as an internal control. Results show mean -fold induction ± S.D. of triplicates. D, IFNβ protein production in HT29, HCT116, SW620, SW480, and Caco-2 cells treated with poly(I:C) (2 μg/ml) alone, transfected with poly(I:C) complexed with Lipofectamine RNAimax (2 μg/ml), or treated with only Lipofectamine RNAimax for 20 h. IFNβ in the supernatant was assessed by ELISA, and the results show mean ± S.D. of three samples. E, HT29 cells were stimulated with poly(I:C) (2.5 μg/ml) for 0, 3, 6, 12, 20, or 24 h before CXCL10 and IFNβ mRNA induction was determined by qPCR. The results show relative induction with a non-treated sample as reference. GAPDH served as an internal control. The results show mean -fold induction ± S.D. of triplicates. F, CXCL10 mRNA induction in HT29 cells pretreated with cycloheximide (0, 15, or 30 μg/ml) for 30 min prior to stimulation with poly(I:C) (2.5 μg/ml) for 8 h. CXCL10 mRNA was determined by qPCR (normalized to medium control and the endogenous control TBP). G, viability in HT29 cells left untreated (0) or stimulated with poly(I:C) (50, 25, 10, 5, 2.5, 1.25, 0.63, 0.31, and 0.15 μg/ml) for 20 h before viability was assessed using the MTT assay. The MTT assay results were normalized to an untreated sample. H, viability in IECs left untreated (0), stimulated with poly(I:C) alone (2 μg/ml), transfected with poly(I:C) using Lipofectamine RNAimax (2 μg/ml), or treated with only Lipofectamine RNAimax for 43 h before the viability of the cells was assessed using the MTT assay. The MTT assay results were normalized to an untreated sample. The results show mean ± S.D. of five samples. All results are representative of at least two independent experiments.
Figure 4.
Figure 4.
IRF3 is phosphorylated, translocates to the nucleus, and binds the CXCL10 promoter in HT29 cells in response to addition of poly(I:C). A, Western blots of HT29 cells were stimulated with poly(I:C) alone (Poly(I:C), 2.5 μg/ml) or transfected with poly(I:C) using Lipofectamine RNAimax (LF + Poly(I:C), 0–1200 min) and stained with antibodies against phospho-IRF3Ser-396, total IRF3, phosphor-p65Ser-536, total p65, or GAPDH. The results are representative of two independent experiments. MW, molecular weight. B and C, nuclear accumulation of IRF3 (B) and IRF1 (C) in HT29 cells left untreated (0), stimulated with poly(I:C) (5–2 μg/ml), or transfected with poly(I:C) complexed with Lipofectamine RNAimax (2 μg/ml) for 3 h or overnight (o/n). Stimulated cells were fixed and immunostained for IRF3 or IRF1, and cell nuclei were stained with Hoechst 3342. Cells were visualized by automated imaging, and analysis was done using ScanR. The results show the percentage of cells with positive staining of IRF3 and IRF1 in the nucleus. The results show mean ± S.D. of triplicate samples with a minimum of 1300 cells assayed and are representative of three independent experiments. D, CXCL10 promotor occupancy by IRF3 in HT29 cells after poly(I:C) (2 μg/ml) stimulation for 3 h. IRF3 binding to the CXCL10 promoter was investigated by ChIP followed by qPCR of the CXCL10 promoter region. RNA polymerase II occupancy was measured as a control. E and F, CXCL10 production (left panels) and IRF mRNA expression (right panels) in HT29 cells left untreated (No add), treated with siRNA against IRF3 (E) or IRF7 (F) (10 nm), NS RNA (10 nm), or transfection reagent alone (LF) for 24 h. Cells were subsequently stimulated with poly(I:C) (2.5 μg/ml) for 6 h. CXCL10 release was assessed by ELISA, whereas silencing of IRF3 and 7 was confirmed by assessing mRNA expression by qPCR using GAPDH as a reference control. The results show mean ± S.D. of triplicate samples.
Figure 5.
Figure 5.
CXCL10 production in metastatic IECs is elicited independent of poly(I:C) internalization but requires endosomal acidification. A, confocal microscopy image of HT29 cells treated with poly(I:C)Rhodamine (red, 5 μg/ml) for 2 h before cells were washed and fixed, and the plasma membrane (PM) was stained with an antibody against Na,K-ATPase (PMA488, green). Images (top) show co-localization (Coloc, left) and single tracks of poly(I:C)Rhodamine (center) and plasma membrane PMA488 staining (right) of the area denoted by the square in the main image. Scale bar = 5 μm. B and C, SW620 (B) or HT29 (C) cells were treated with poly(I:C) (Added Poly(I:C)) or double-stranded DNA dA:dT (Added dA:dT) added in solution or by plating cells in wells precoated with poly(I:C) (Coated Poly(I:C)) or dA:dT (Coated dA:dT) with the given concentrations for 24 h before CXCL10 release was determined by ELISA. D, CXCL10 production in HT29 cells exposed to HMW poly(I:C) or LMW poly(I:C) (2 μg/ml) either added in solution (Added) or by plating cells in wells precoated with poly(I:C) (Coated) for 21 h. E, CXCL10 release in HT29 cells pretreated with anti-TLR3 (15 or 5 μg/ml) or control goat IgG (15 μg/ml) for 1 h prior to stimulation with poly(I:C) (5 or 2 μg/ml) for 10 h. CXCL10 content in the supernatant was assessed by ELISA. **, p < 0.01; *, p < 0.05 versus cells pretreated with control IgG (two-way ANOVA, Bonferroni post-test). The results in A–D show mean ± S.D. of triplicates and are representative of three independent experiments. #, below detection. F, CXCL10 expression in HT29 cells treated with the dynamin inhibitor Dynasore (80 or 40 μm) or the DMSO control for 30 min prior to stimulation with poly(I:C) (2.5 μg/ml) for 8 h. CXCL10 mRNA was determined by qPCR (normalized to medium control and the endogenous control TBP). The results show the mean of triplicates from three independent experiments ± S.D. ns, not significant (two-way ANOVA, Bonferroni post-test). #, below detection. G, CXCL10 production in HT29 cells transfected with NS RNA (20 nm) or two siRNAs against clathrin heavy chain 1 (siC2 and siC3, 10 + 10 nm) in two rounds for 26 h and 20 h prior to stimulation with poly(I:C) (2 μg/ml) for 8 h. The results show mean ± S.D. of triplicates and are representative of three independent experiments. **, p < 0.01 versus cells transfected with non-silencing siRNA (two-way ANOVA, Bonferroni post-test). Inset, Western blots of lysates of HT29 cells treated in parallel as described for siRNAs against clathrin heavy chain 1 (siC2 or siC3) or non-silencing RNA (N), stained with antibody against clathrin heavy chain 1 (CHC, top blot) or against α-tubulin (Tubulin, bottom blot). H, CXCL10 production in HT29 cells pretreated with bafilomycin A (2–1 μm) or the DMSO control for 30 min prior to stimulation with poly(I:C) (2 or 1 μg/ml) for 10 h. The supernatant was assayed for CXCL10 content by ELISA. The results show mean ± S.D. of triplicates and are representative of two independent experiments. **, p < 0.01; *, p < 0.05 versus untreated cells (two-way ANOVA, Bonferroni post-test).
Figure 6.
Figure 6.
TLR3 is expressed in the plasma membrane of metastatic IECs. A, Western blot of whole-cell lysate of HEK293 cells transfected with TLR3 or empty vector (EV) or isolated plasma membrane fractions (PM) or whole cell lysate (WCL) from HT29 cells left untreated (−) or stimulated with poly(I:C) (+) (2.5 μg/ml) for 24 h. Blots were stained with antibodies against TLR3, Na,K-ATPase as a control for the plasma membrane protein fraction, the early endosome marker EEA-1, or GAPDH. B, Western blot of whole-cell lysate of HEK293 cells transfected with TLR3 or empty vector or isolated plasma membrane fractions or whole-cell lysate of SW620 cells left untreated (−) or stimulated with poly(I:C) (2.5 μg/ml) (+) for 24 h. Blots were stained with anti-TLR3, anti-Na,K-ATPase, anti-EEA1, or anti-GAPDH. C, UNC93B1 mRNA expression in Caco-2, SW480, SW620, HCT116, and HT29 cells treated with medium or poly(I:C) (5 μg/ml) for 24 h. UNC93B1 mRNA was determined by qPCR. The results were normalized to endogenous GAPDH expression and show -fold induction relative to the Caco-2 medium sample. The results are presented as mean ± S.D. of triplicates. D and E, CXCL10 production (D) and UNC93B1 (E) expression in HT29 cells treated with siRNA against UNC93B1 (20 nm) or NS RNA (20 nm) twice for 26 h and 20 h prior to stimulation with poly(I:C) (2 μg/ml) for 8 h. F and G, CXCL10 production (F) and UNC93B1 expression (G) in SW620 cells treated with siRNA against UNC93B1 (20 nm) or NS RNA (20 nm) in two rounds for 26 h and 20 h prior to stimulation with poly(I:C) (2 μg/ml) for 24 h. D—G, CXCL10 release in the cell supernatant was assessed by ELISA, whereas UNC93B1 mRNA expression in the cells was determined by qPCR using TBP as a reference control. The results show mean ± S.D. of triplicates and are representative of three independent experiments. ***, p < 0.001; **, p < 0.01; *, p < 0.05 versus NS RNA (two-way ANOVA, Bonferroni post-test).
Figure 7.
Figure 7.
Poly(I:C) stimulation enhances the invasive ability of SW620 cells in a TLR3-dependent manner. A and B, SW620 and SW480 cells (A) or SW620 cells (B) transfected with silencing RNA against TLR3 (10 nm) or NS RNA were plated in a CytoSelect 96-well invasion plate and left untreated or stimulated with poly(I:C) (10 μg/ml) for 20 h. Cells that migrated through the membrane were lysed and quantified. Results were normalized to an untreated sample. C, SW620 treated with siRNA against TLR3 or NSRNA were assayed for TLR3 mRNA by qPCR to confirm gene silencing. -Fold change is shown relative to an untreated NS RNA sample. The results show mean ± S.D. of triplicates and are representative of three independent experiments. ***, p < 0.001; **, p < 0.01 versus medium or NS RNA treatment (two-way ANOVA, Bonferroni post-test).

References

    1. Kawai T., and Akira S. (2007) TLR signaling. Semin. Immunol. 19, 24–32 - PubMed
    1. Takeuchi O., and Akira S. (2010) Pattern recognition receptors and inflammation. Cell 140, 805–820 - PubMed
    1. Karikó K., Ni H., Capodici J., Lamphier M., and Weissman D. (2004) mRNA is an endogenous ligand for Toll-like receptor 3. J. Biol. Chem. 279, 12542–12550 - PubMed
    1. Cavassani K. A., Ishii M., Wen H., Schaller M. A., Lincoln P. M., Lukacs N. W., Hogaboam C. M., and Kunkel S. L. (2008) TLR3 is an endogenous sensor of tissue necrosis during acute inflammatory events. J. Exp. Med. 205, 2609–2621 - PMC - PubMed
    1. Kang D. C., Gopalkrishnan R. V., Wu Q., Jankowsky E., Pyle A. M., and Fisher P. B. (2002) mda-5: an interferon-inducible putative RNA helicase with double-stranded RNA-dependent ATPase activity and melanoma growth-suppressive properties. Proc. Natl. Acad. Sci. U.S.A. 99, 637–642 - PMC - PubMed

Publication types

MeSH terms