. 2017 Jul 17;7(1):5637.
doi: 10.1038/s41598-017-05527-2.

The characterization of hippocampal theta-driving neurons - a time-delayed mutual information approach

Affiliations

The characterization of hippocampal theta-driving neurons - a time-delayed mutual information approach

Songting Li et al. Sci Rep. .

Abstract

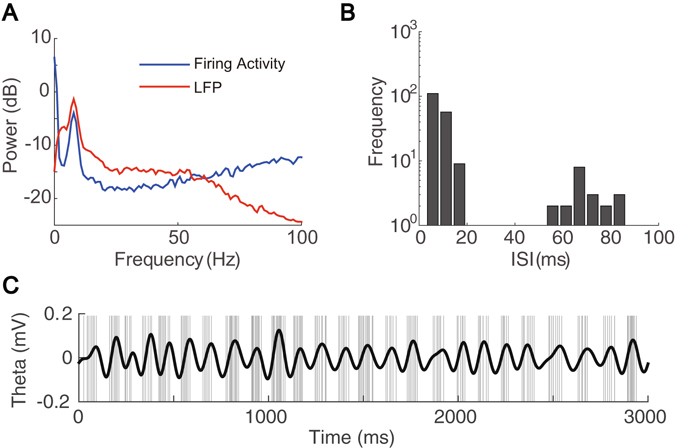
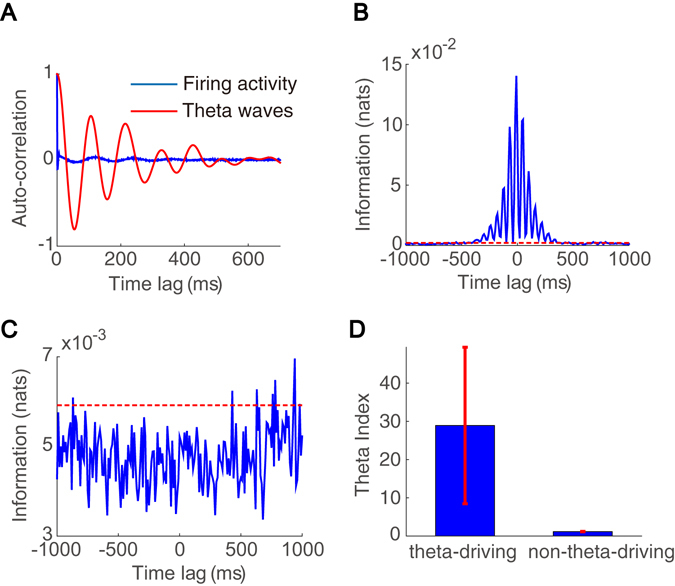
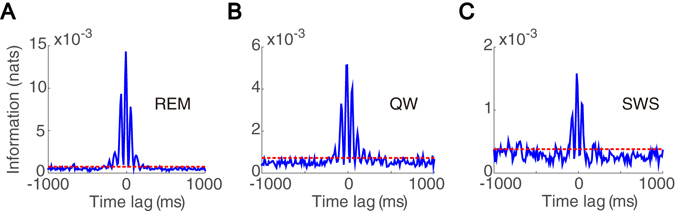
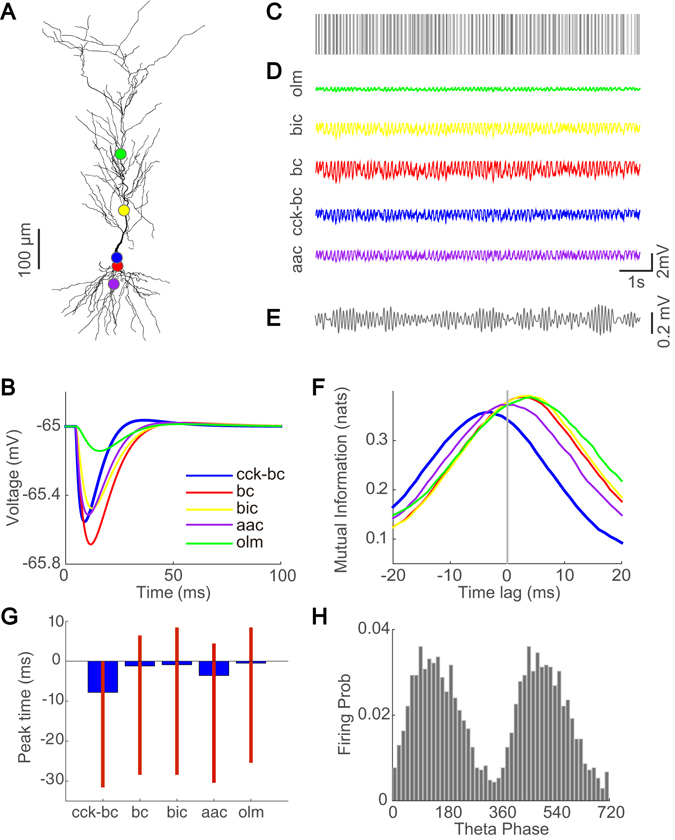
Interneurons are important for computation in the brain, in particular, in the information processing involving the generation of theta oscillations in the hippocampus. Yet the functional role of interneurons in the theta generation remains to be elucidated. Here we use time-delayed mutual information to investigate information flow related to a special class of interneurons-theta-driving neurons in the hippocampal CA1 region of the mouse-to characterize the interactions between theta-driving neurons and theta oscillations. For freely behaving mice, our results show that information flows from the activity of theta-driving neurons to the theta wave, and the firing activity of theta-driving neurons shares a substantial amount of information with the theta wave regardless of behavioral states. Via realistic simulations of a CA1 pyramidal neuron, we further demonstrate that theta-driving neurons possess the characteristics of the cholecystokinin-expressing basket cells (CCK-BC). Our results suggest that it is important to take into account the role of CCK-BC in the generation and information processing of theta oscillations.


Conflict of interest statement

The authors declare that they have no competing interests.

Figures

Figure 1
Figure 1
Properties of a theta-driving neuron. (A) Power spectra of a theta-driving neuron’s firing activity (blue) and the LFP signal (red). (B) The bimodal distribution of the ISI of the theta-driving neuron. (C) The time series of the theta-driving neuron’s firing activity and the corresponding theta wave. The time of each spike is indicated by a gray vertical line and the theta wave is plotted in black color. The theta-driving neuron tends to fire in the ascending phase of the theta wave.
Figure 2
Figure 2
Interaction between theta-locked interneurons and theta waves in the AE state. (A) Auto-correlation of the theta-driving neuron’s firing activity (blue) and the corresponding theta wave (red). (B) Time-delayed mutual information between the firing activity of a theta-driving neuron and the corresponding theta wave. (C) Time-delayed mutual information between the firing activity of a theta-locked non-theta-driving neuron and the theta wave. In (B,C), we plot the mutual information as a function of time delay (blue) and its significance level (red). (D) Theta index for theta-driving neurons as well as non-theta-driving neurons. Blue bars and red bars indicate the mean and the range of theta index values for the six theta-driving neurons and four non-theta-driving neurons, respectively.
Figure 3
Figure 3
Interaction between a theta-driving neuron and waves over different frequency bands in the AE state. (A) Time-delayed mutual information between the waves of different frequency bands and the firing activity of a theta-driving neuron. The waves of the theta band (4–12 Hz) (blue), the delta band (1–4 Hz) (red), the beta band (12–30 Hz) (yellow), the gamma band (30–100 Hz) (purple), and the ripple band (100–250 Hz) (green) are obtained by filtering the original LFP signal. (B) Zoom-in of A but without the case of the theta band.
Figure 4
Figure 4
Interaction between a theta-driving neuron and the theta wave over different behavioral states. Time-delayed mutual information (blue) between the theta wave and the firing activity of a theta-driving neuron in the state of (A) REM, (B) QW, and (C) SWS. The red dashed line indicates the significance level.
Figure 5
Figure 5
Classification of theta-driving neurons via realistic neuron simulations. (A) Morphology of the realistic CA1 pyramidal neuron model. Colored dots indicate the input locations of interneurons–AAC (purple), BC (red), CCK-BC (blue), BIC (yellow), and OLM (green). (B) Hyperpolarized somatic voltage trace of the pyramidal neuron in response to an individual input spike from an interneuron of each candidate type. (C) A spike train of a theta-driving neuron recorded in the experiment. (D) Computationally obtained hyperpolarized somatic voltage trace of the pyramidal neuron in response to the input from an interneuron of each candidate type. In our simulation, we assume that the spike train in C as the input to the pyramidal neuron is from an interneuron of one of the putative types with its input location and synaptic dynamics modeled with the corresponding parameters. (E) The theta wave obtained through filtering the LFP signal recorded in the experiment in the presence of the spike train of the theta-driving neuron shown in C. (F) Dependence of the time-lag of time-delayed mutual information between the experimentally recorded theta wave in E and the computationally obtained membrane potential induced by an interneuron of each type in D. (G) Peak time vs. interneuron type–peak time is the time-lag at which the time-delayed mutual information as a function of time-lag reaches its peak amplitude. Blue thick bars indicate the mean values of the peak time and red thin bars indicate the range of the peak time over 5 theta-driving neurons. (H) The firing probability of a theta-driving neuron as a function of the theta phase. In A, B, D, F, colors label different candidate interneuron types.
Figure 6
Figure 6
Sensitivity analysis of the parameters in the realistic pyramidal neuron model. Data of the five theta-driving neurons over 12 non-overlapping time segments are analyzed. Black bars indicate the range of the peak time and rectangle bars indicate the mean value of the peak time. Colors indicate the parameter range from 10% (red) to 1000% (blue) for all rows except the last one in which colors indicate the inhibitory reversal potential vary by increment of −10 mV (red) to +10 mV (blue) with respect to the control values (green) used in our realistic simulations. Asterisks are used to emphasize that the change of cation channel density g h will lead to a substantial change of the positive peak time for CCK-BC.

References

    1. O’Keefe J, Dostrovsky J. The hippocampus as a spatial map. preliminary evidence from unit activity in the freely-moving rat. Brain research. 1971;34:171–175. doi: 10.1016/0006-8993(71)90358-1. - DOI - PubMed
    1. McNaughton B, Barnes CA, O’keefe J. The contributions of position, direction, and velocity to single unit activity in the hippocampus of freely-moving rats. Experimental Brain Research. 1983;52:41–49. doi: 10.1007/BF00237147. - DOI - PubMed
    1. Kahana MJ, Sekuler R, Caplan JB, Kirschen M, Madsen JR. Human theta oscillations exhibit task dependence during virtual maze navigation. Nature. 1999;399:781–784. doi: 10.1038/21645. - DOI - PubMed
    1. Grastyan E, Lissak K, Madarasz I, Donhoffer H. Hippocampal electrical activity during the development of conditioned reflexes. Electroencephalography and clinical neurophysiology. 1959;11:409–430. doi: 10.1016/0013-4694(59)90040-9. - DOI - PubMed
    1. Jouvet M. Biogenic amines and the states of sleep. Science (New York, NY) 1969;163:32–41. doi: 10.1126/science.163.3862.32. - DOI - PubMed

Publication types

Substances

LinkOut - more resources