

Multimodal image analysis of clinical influences on preterm brain development
- PMID: 28719076
- PMCID: PMC5601217
- DOI: 10.1002/ana.24995
Multimodal image analysis of clinical influences on preterm brain development
Abstract
Objective: Premature birth is associated with numerous complex abnormalities of white and gray matter and a high incidence of long-term neurocognitive impairment. An integrated understanding of these abnormalities and their association with clinical events is lacking. The aim of this study was to identify specific patterns of abnormal cerebral development and their antenatal and postnatal antecedents.
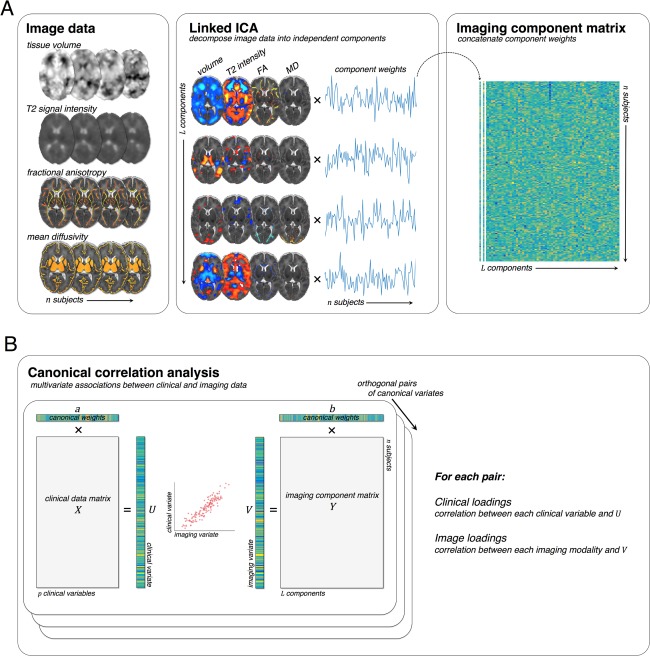
Methods: In a prospective cohort of 449 infants (226 male), we performed a multivariate and data-driven analysis combining multiple imaging modalities. Using canonical correlation analysis, we sought separable multimodal imaging markers associated with specific clinical and environmental factors and correlated to neurodevelopmental outcome at 2 years.
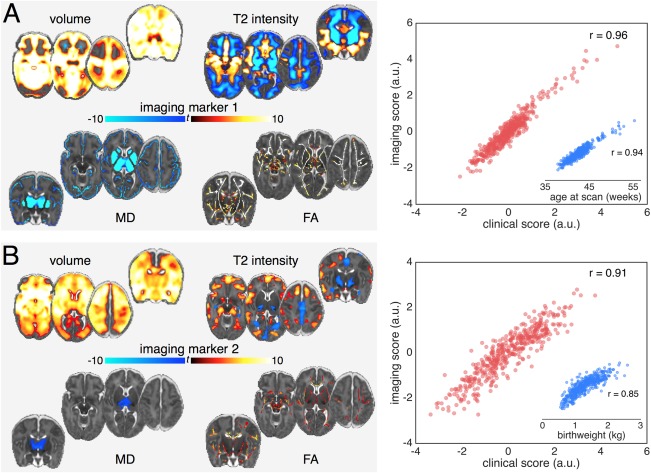
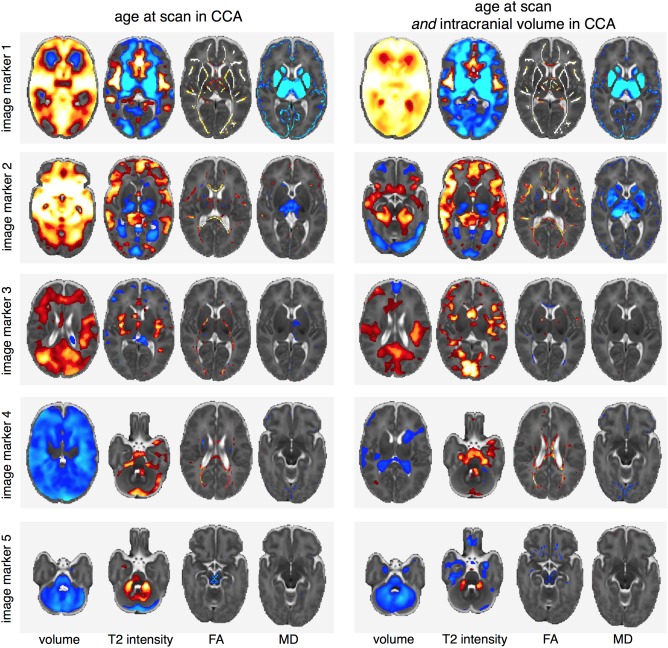
Results: We found five independent patterns of neuroanatomical variation that related to clinical factors including age, prematurity, sex, intrauterine complications, and postnatal adversity. We also confirmed the association between imaging markers of neuroanatomical abnormality and poor cognitive and motor outcomes at 2 years.
Interpretation: This data-driven approach defined novel and clinically relevant imaging markers of cerebral maldevelopment, which offer new insights into the nature of preterm brain injury. Ann Neurol 2017;82:233-246.
© 2017 The Authors Annals of Neurology published by Wiley Periodicals, Inc. on behalf of American Neurological Association.
Figures

References
-
- Blencowe H, Cousens S, Oestergaard MZ, et al. National, regional, and worldwide estimates of preterm birth rates in the year 2010 with time trends since 1990 for selected countries: a systematic analysis and implications. Lancet 2012;379:2162–2172. - PubMed
-
- Delobel‐Ayoub M, Arnaud C, White‐Koning M, et al. Behavioral problems and cognitive performance at 5 years of age after very preterm birth: the EPIPAGE Study. Pediatrics 2009;123:1485–1492. - PubMed
-
- Marlow N, Wolke D, Bracewell MA, et al. Neurologic and developmental disability at six years of age after extremely preterm birth. N Engl J Med 2005;352:9–19. - PubMed
-
- Ment LR, Hirtz D, Huppi PS. Imaging biomarkers of outcome in the developing preterm brain. Lancet Neurol 2009;8:1042–1055. - PubMed
-
- Woodward LJ, Anderson PJ, Austin NC, et al. Neonatal MRI to predict neurodevelopmental outcomes in preterm infants. N Engl J Med 2006;355:685–694. - PubMed
MeSH terms
Grants and funding
LinkOut - more resources
Full Text Sources
Other Literature Sources
Medical
