. 2018 Jan;18(1):74-88.
doi: 10.1111/ajt.14434. Epub 2017 Sep 8.

Human immunology studies using organ donors: Impact of clinical variations on immune parameters in tissues and circulation

Affiliations

Human immunology studies using organ donors: Impact of clinical variations on immune parameters in tissues and circulation

D J Carpenter et al. Am J Transplant. 2018 Jan.

Abstract

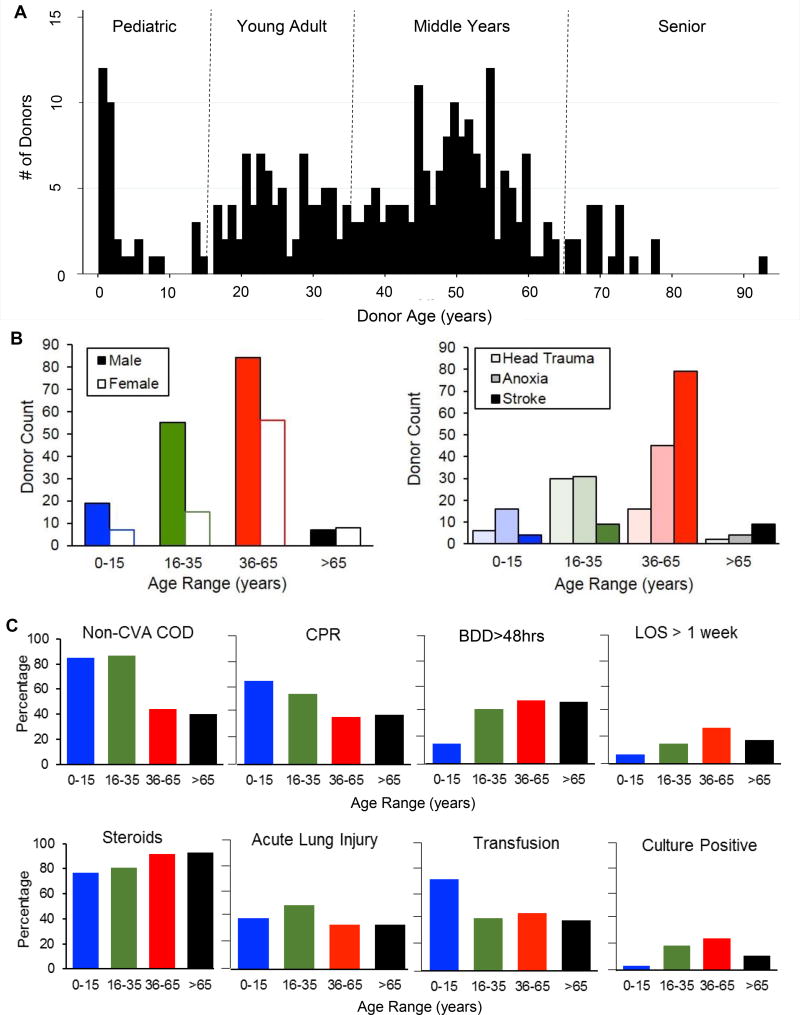
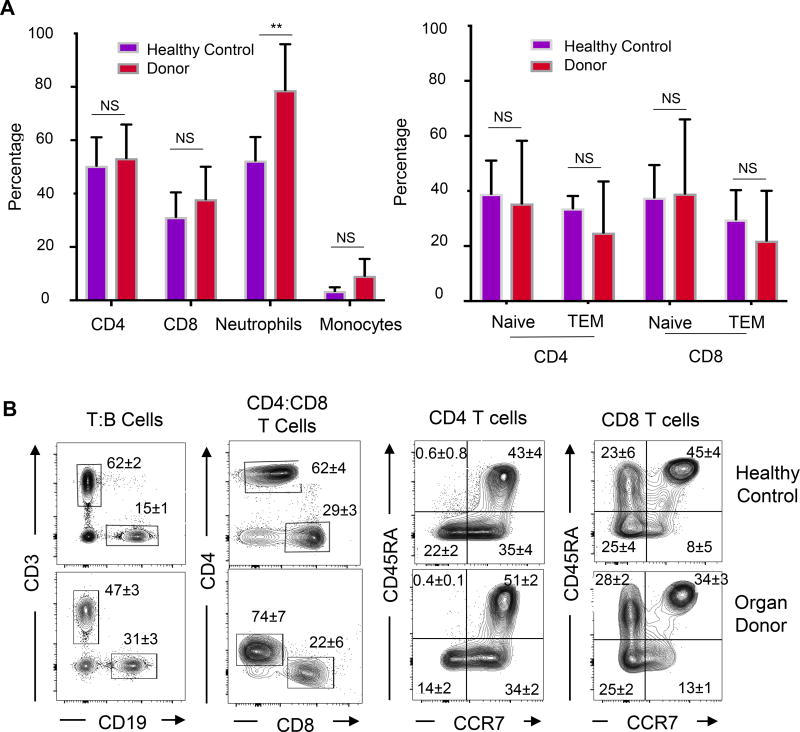
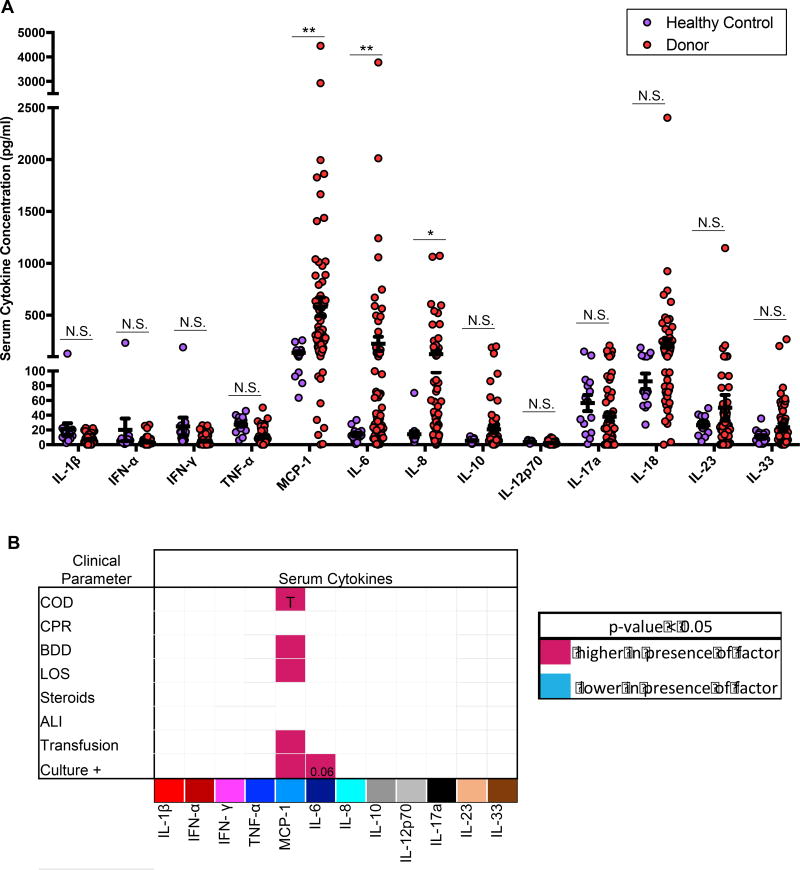
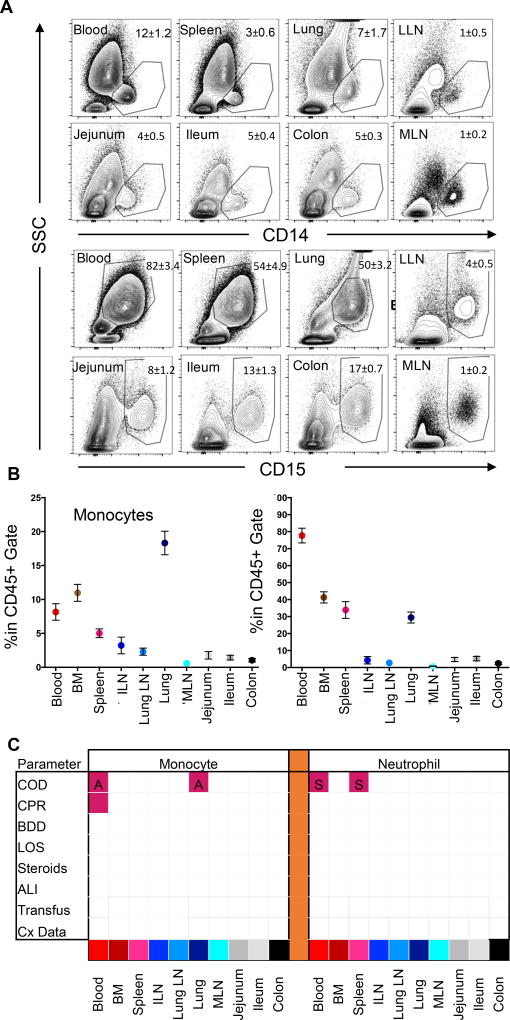
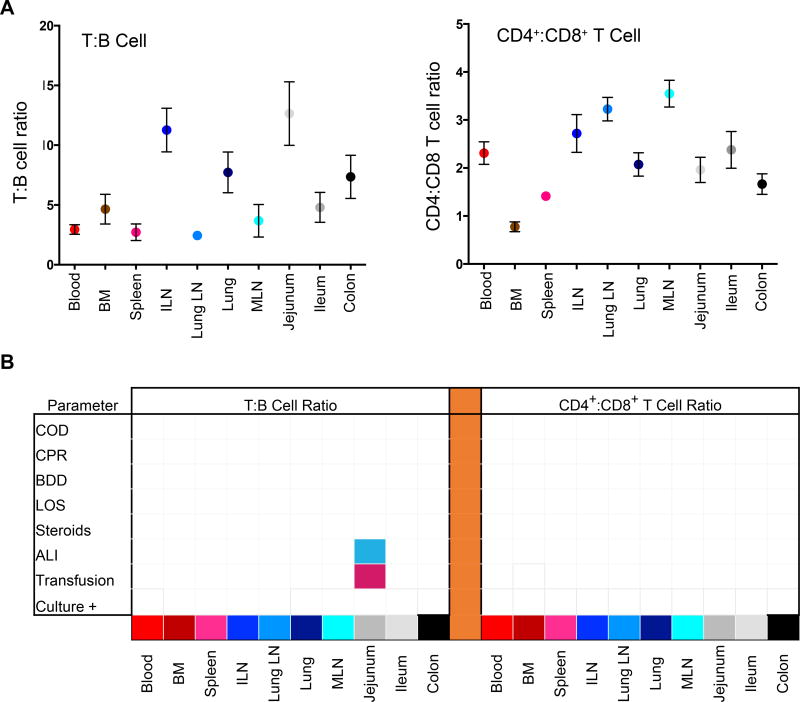
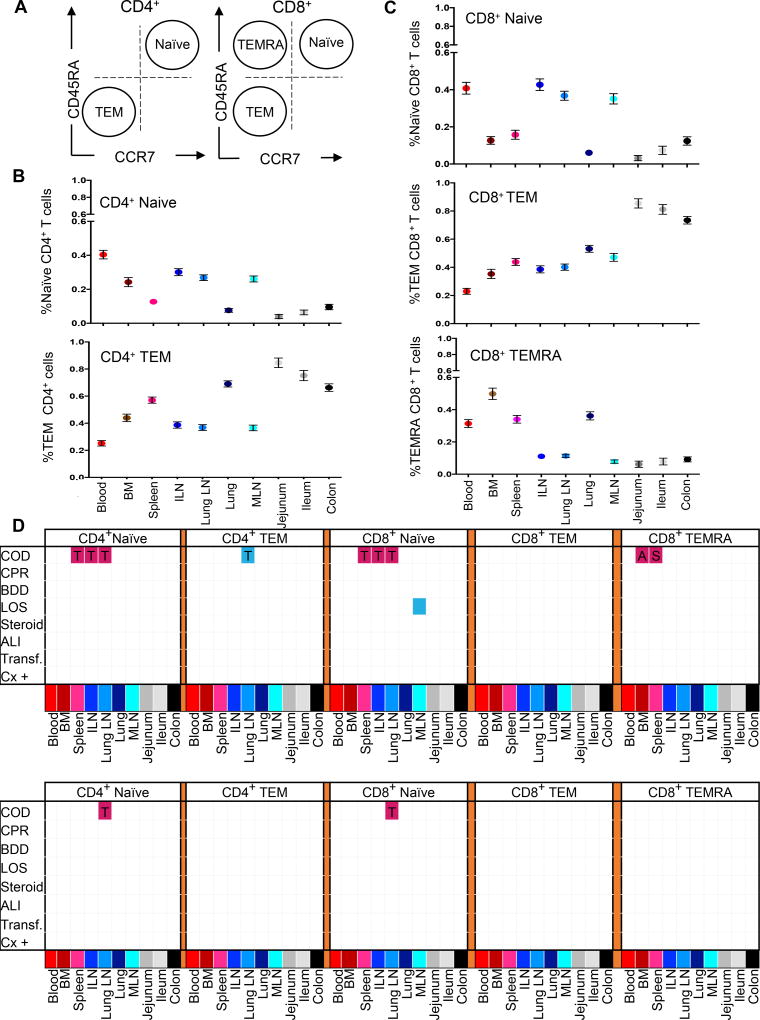
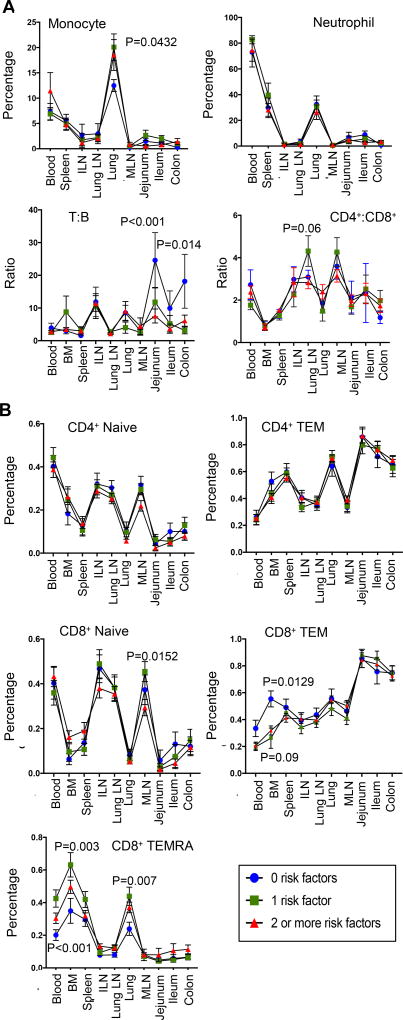
Organ donors are sources of physiologically healthy organs and tissues for life-saving transplantation, and have been recently used for human immunology studies which are typically confined to the sampling of peripheral blood. Donors comprise a diverse population with different causes of death and clinical outcomes during hospitalization, and the effects of such variations on immune parameters in blood and tissues are not known. We present here a coordinate analysis of innate and adaptive immune components in blood, lymphoid (bone marrow, spleen, lymph nodes), and mucosal (lungs, intestines) sites from a population of brain-dead organ donors (2 months-93 years; n = 291) across eight clinical parameters. Overall, the blood of donors exhibited similar monocyte and lymphocyte content and low serum levels of pro-inflammatory cytokines as healthy controls; however, donor blood had increased neutrophils and serum levels of IL-8, IL-6, and MCP-1 which varied with cause of death. In tissues, the frequency and composition of monocytes, neutrophils, B lymphocytes and T cell subsets in lymphoid or mucosal sites did not vary with clinical state, and was similar in donors independent of the extent of clinical complications. Our results reveal that organ donors maintain tissue homeostasis, and are a valuable resource for fundamental studies in human immunology.

Keywords: cellular biology; donors and donation: deceased; immune regulation; immunobiology; lymphocyte biology; monitoring: immune; organ procurement; organ procurement and allocation; translational research/science.


Conflict of interest statement

Disclosure

The authors of this manuscript have no conflicts of interest to disclose as described by the American Journal of Transplantation.

Figures

Figure 1
Figure 1. Characteristics of deceased organ donors analyzed in this study
Tissues from research-consented organ donors were obtained for analysis of immune cells from 291 donors between February, 2011 and October 2016. (A) Graph shows number of donors of each age spanning 3 months to 93 years of age (n=291), stratified into the following age categories: Pediatric, 0–15 years of age; Young adult, 16–35 years of age; Middle years, 36–65 years of age; Senior, > 65-years of age. (B) Graph shows stratification of gender (left) and cause of death (right) by age range. (C) Bar graphs showing eight clinical characteristics stratified by donor age category. Clinical characteristics include: non-cerebrovascular accident (CVA) as cause of death (COD); need for cardiopulmonary resuscitation (CPR); brain death duration greater than 48 hours (BDD>48hrs); length of stay (LOS) greater than one week; administration of steroids (1g Solumedrol every 24 hours) after the diagnosis of brain death; presence of acute lung injury (ALI) as diagnosed by Berlin criteria (see supplemental methods); whether or not the donor received a packed red blood cell or platelet transfusion during their hospitalization (“Transfusion”); and, whether or not the donor had a positive blood or urine culture at any point during their hospitalization (Culture positive).
Figure 2
Figure 2. Immune cell composition in donor blood compared to healthy controls
Immune cell content in the blood of organ donors and healthy living controls was analyzed by flow cytometry. (A) Left: Frequency of CD4+ and CD8+ T cells, neutrophils and monocytes in peripheral blood of organ donors (n=82, T cells; n=40, monocyte/neutrophil) compared to healthy controls (n=7) expressed as %CD45+ cells (** indicates p<0.001). Right: Graph shows percentage of naïve (CD45RA+CCR7+) and effector-memory (TEM, CD45RACCR7) subsets for CD4+ and CD8+ T cells. N.S.=not significant. (B) Representative flow cytometry plots of lymphocytes in healthy control (top) and deceased organ donors (bottom) showing gating for T, B, CD4+, CD8+ T cells and T cell subset delineation by CD45RA and CCR7 expression. All plots are shown as a function of live (DAPI), singlet, CD45+ cells. Numbers in quadrants indicate mean ± SEM for entire cohort.
Figure 3
Figure 3. Comparison of Serum cytokine levels in organ donors and healthy controls
(A) Levels of multiple cytokines in the serum of organ donors (n=47) and healthy controls (n=13) expressed as pg/ml (mean ± SEM). N.S.=not significant. Significant differences between levels in donors and healthy controls were identified for MCP-1 (p<0.001), IL-6 (p=0.0041), and IL-8 (p=0.0129) (* = p<0.05, ** = p< 0.01). (B) Matrix shows serum cytokine concentrations as a function of eight measured clinical characteristics as defined in Figure 1C (COD, cause of death; CPR, cardiopulmonary resuscitation; LOS, length of stay > 1 week with the mean LOS being 5.5 days; BDD, brain death duration greater than 48 hours which was the mean length of brain death; Transfusion, whether or not a donor received any packed red blood cell or platelet transfusion; Cx Data, whether or not donors had a positive blood or urine culture during their hospitalization.) The matrix grid shows an ANOVA analysis analyzing the presence/absence of each factor in each tissue. Shaded pink boxes indicating significant (p<0.05) positive correlation with the factor and shaded blue boxes indicating negative correlation with the factor. For MCP-1, the significance for each factor was: p=0.0280 for higher levels of MCP-1 in HT vs. stroke; p=0.006 for higher MCP-1 in donors with BDD> 48 hours; p=0.0034 for higher MCP-1 in donors with LOS >1 week; p<0.001 for higher MCP-1 levels in donors who had transfusions; and p<0.001 for higher MCP-1 levels in culture+ donors. IL-6 was higher in donors with infections (p=0.06).
Figure 4
Figure 4. Low variability of Monocyte and neutrophil content as a function of donor clinical changes
(A) Representative flow cytometry plots of CD14+ monocyte (first two rows) and CD15+ neutrophil (third and fourth rows) staining in relation to their side scatter properties in blood and seven tissue sites of a representative individual organ donor including blood, spleen, lung, lung-drining lymph nodes (LLN), jejunum, ileum, colon and mesenteric lymph node (MLN). Plots show profiles gated on live (DAPI), singlet, CD45+ cells. Numbers in quadrants indicate mean ± SEM for entire cohort. (B) Compiled flow cytometry data showing percentage of monocytes (mean ± SEM) (left) and neutrophils (right) in blood and nine tissue sites (n=40). Tissue abbreviations as in (A) also showing bone marrow (BM) and iliac lymph node (ILN). (C) Matrix shows significant changes (p<0.05) in monocyte (left) or neutrophil (right) levels as a function of eight clinical factors as defined in Figure 1C (COD, cause of death; CPR, cardiopulmonary resuscitation; LOS, length of stay > 1 week; BDD, brain death duration greater than 48hrs; Transfusion; Cx Data) The matrix grid shows an ANOVA analysis analyzing the presence/absence of each factor in each tissue. Shaded pink boxes indicating significant (p<0.05) positive correlation with the factor and shaded blue boxes indicating negative correlation with the factor. Significance level for each factor was as follows: for monocytes, a higher frequency in the blood (p=0.0043) and lung (p<0.001) was associated with anoxia (labeled ‘A’) compared to donors who died of stroke, while higher monocyte frequency in blood was also associated with CPR (p=0.0293). For neutrophils, donors who died of stroke (labeled ‘S’) had significantly higher frequencies in the blood (p=0.0417) and spleen (p=0.0326) than donors who died of HT.
Figure 5
Figure 5. Stability of lymphocyte frequencies in donor blood and tissues as a function of donor clinical changes
(A) Compiled Lymphocyte data showing mean ± SEM for T:B cell (left) and CD4+:CD8+ T cell (right) ratios in each tissue site (n=82). Tissue abbreviations: BM, bone marrow; ILN, iliac lymph node; MLN, mesenteric lymph node. (B) Matrices show significant changes (p<0.05) in T:B cell (left) or CD4+:CD8+ T cell (right) ratios as a function of eight measured clinical characteristics as defined in Figure 1C. The matrix grid shows an ANOVA analysis analyzing the presence/absence of each factor in each tissue. Shaded pink boxes indicating significant (p<0.05) positive correlation with the factor and shaded blue boxes indicating negative correlation with the factor. A lower T:B ratio in jejunum was associated with ALI (p<0.001) while a higher T:B cell ratio was associated with transfusions (p=0.0091).
Figure 6
Figure 6. T cell subset composition in tissues varies more by age and less by clinical factors
(A) CD4+ and CD8+ T cell subsets are defined as a function of CD45RA and CCR7: Terminal Effector (TEMRA: CD45RA+CCR7), Naïve (CD45RA+CCR7+), and Effector Memory (TEM: CD45RACCR7). (B) Compiled subset results for CD4+ T cells showing naive (upper) and TEM (lower) percentages (mean ± SEM) in blood and 9 tissue sites (n=82). (C) Compiled subset results for CD8+ T cells showing naive (upper), TEM (middle) and TEMRA (lower) percentages (mean ± SEM) in blood and 9 tissue sites (n=82). (D) Matrix of significant association (p<0.05) of T cell subset frequencies with eight clinical parameters without adjustments for age (top), and adjusted for age as a covariate (bottom), as defined in Figure 1C. The matrix grid shows an ANOVA analysis analyzing the presence/absence of each factor in each tissue. Shaded pink boxes indicating significant (p<0.05) positive correlation with the factor and shaded blue boxes indicating negative correlation with the factor. In the age-adjusted analysis, HT as a COD was associated with significantly higher CD4+ naïve cells (p<0.001) and CD8+ naïve cells (p=0.002) in the LLN compared to donors who died of a stroke.
Figure 7
Figure 7. Immune cell variations for lymphoid and myeloid subsets across tissue site by number of donor clinical risk factors
Cellular frequencies were compared between donors across three categories in all ten tissue sites: donor categories included, donors with 0 clinical risk factors; donors with one risk factor; and donors with two or more risk factors as defined in Figure 1C. (A) Monocyte/Neutrophil (n=40; top) as well as T:B and CD4+:CD8+ (n=82; bottom) ratios (mean value ± SEM) compared across tissue sites as a function of number of donor clinical risk factors. (B) CD4+ and CD8+ T cell subset frequencies compared across tissue sites as a function of number of donor clinical risk factors.

References

    1. Hein WR, Griebel PJ. A road less travelled: large animal models in immunological research. Nat Rev Immunol. 2003;3(1):79–84. - PubMed
    1. Ngiow SF, Loi S, Thomas D, Smyth MJ. Mouse Models of Tumor Immunotherapy. Adv Immunol. 2016;130:1–24. - PubMed
    1. Zhou X, Ramachandran S, Mann M, Popkin DL. Role of lymphocytic choriomeningitis virus (LCMV) in understanding viral immunology: past, present and future. Viruses. 2012;4(11):2650–69. - PMC - PubMed
    1. Pearson JA, Wong FS, Wen L. The importance of the Non Obese Diabetic (NOD) mouse model in autoimmune diabetes. J Autoimmun. 2016;66:76–88. - PMC - PubMed
    1. Sachs DH, Kawai T, Sykes M. Induction of tolerance through mixed chimerism. Cold Spring Harb Perspect Med. 2014;4(1):a015529. - PMC - PubMed

Publication types

MeSH terms