. 2018 Mar;33(3):389-395.
doi: 10.1002/jbmr.3194. Epub 2017 Jul 18.

The Ability of a Single BMD and Fracture History Assessment to Predict Fracture Over 25 Years in Postmenopausal Women: The Study of Osteoporotic Fractures

Affiliations

The Ability of a Single BMD and Fracture History Assessment to Predict Fracture Over 25 Years in Postmenopausal Women: The Study of Osteoporotic Fractures

Dennis M Black et al. J Bone Miner Res. 2018 Mar.

Abstract

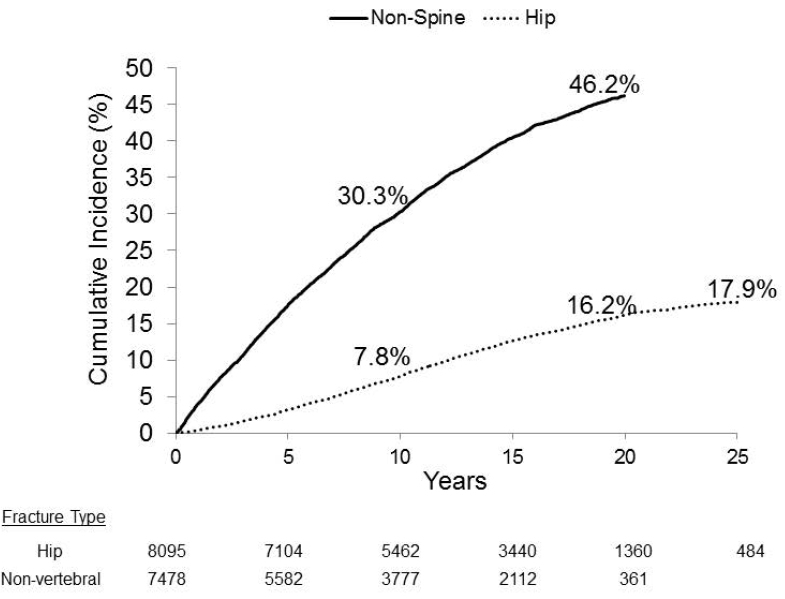
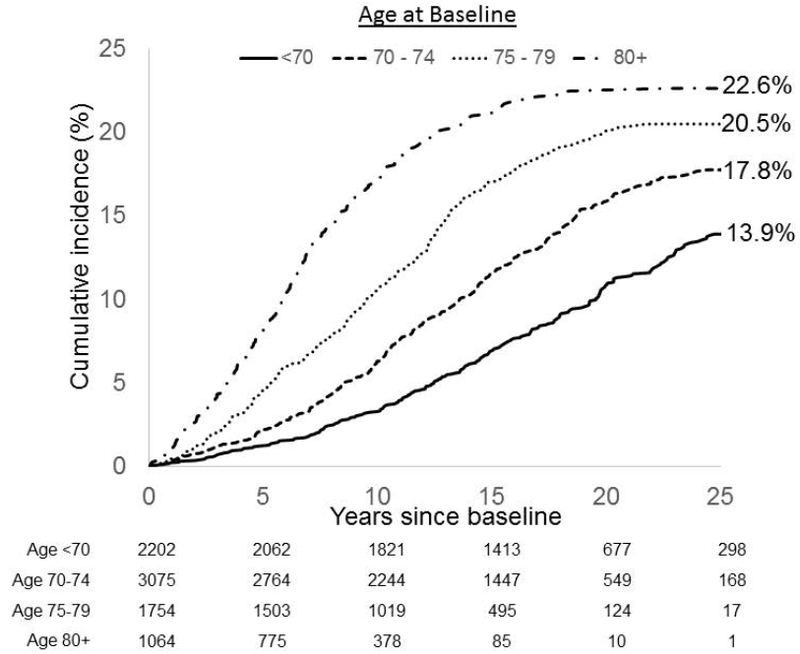
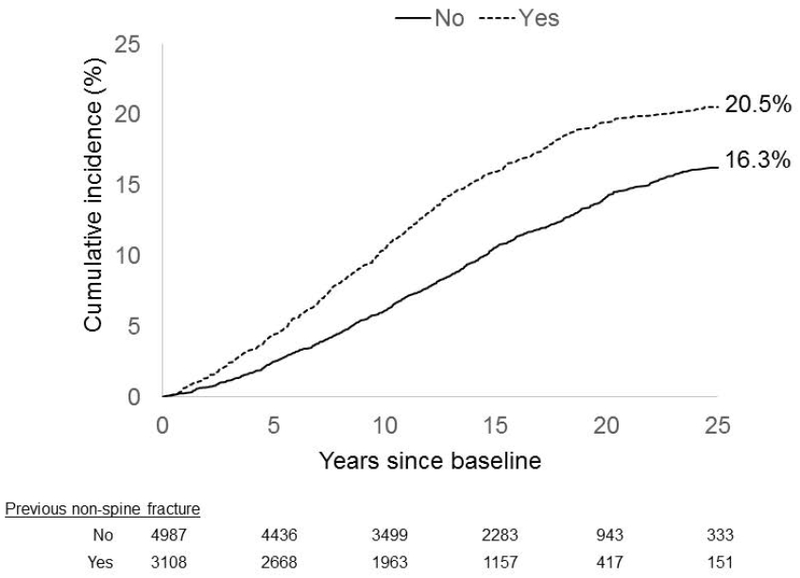
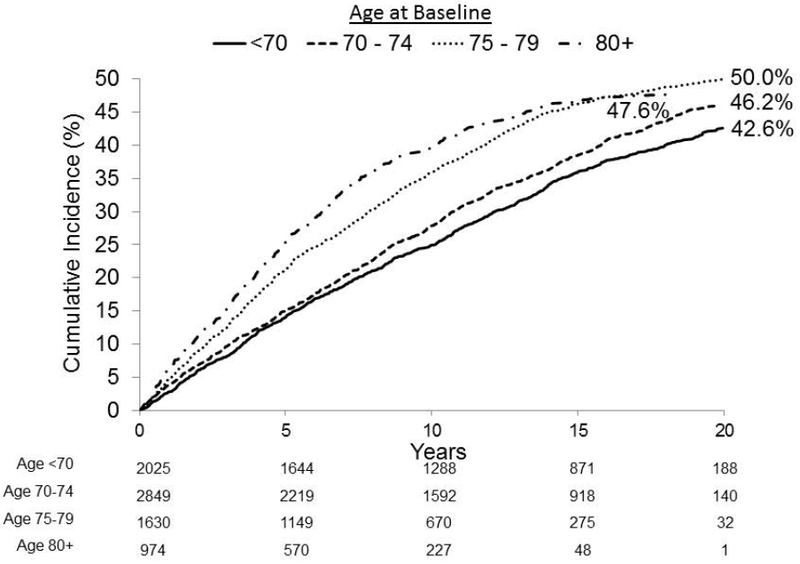
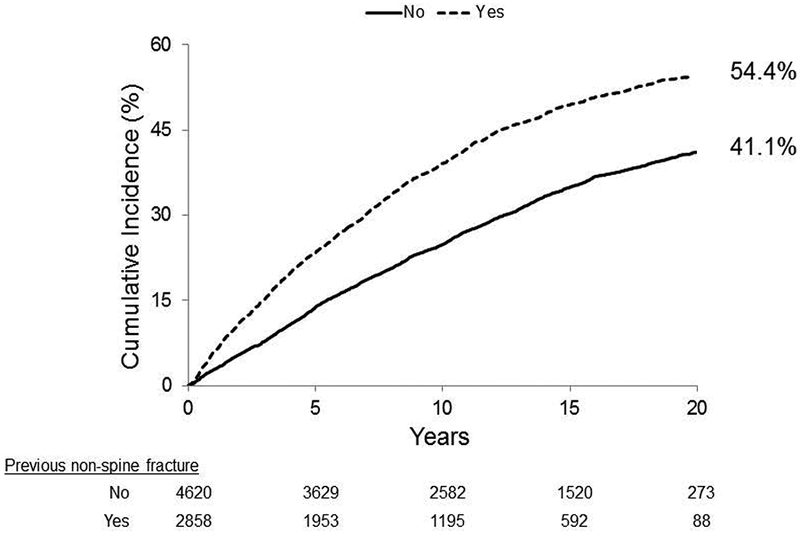
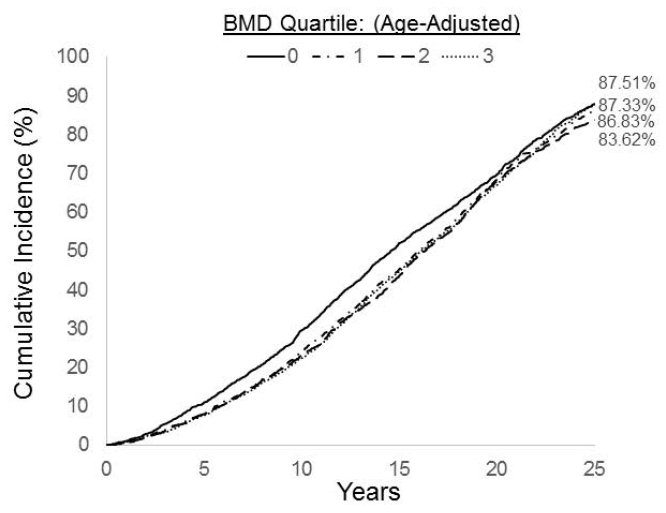
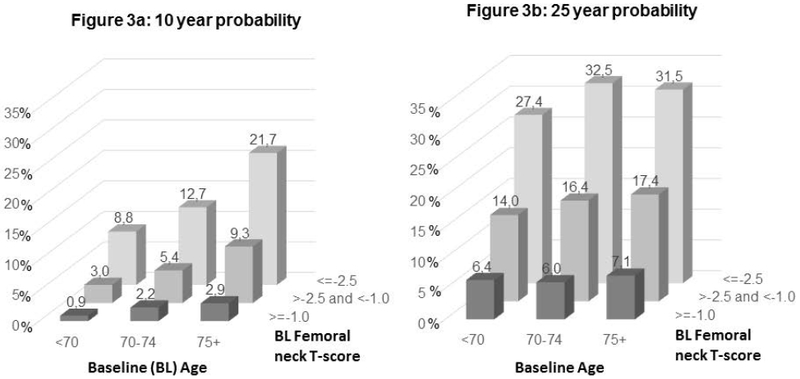
The ability of bone mineral density (BMD) and other risk factors to predict fracture risk is well-established for as long as 5 to 10 years. However, their value to predict risk over a longer term has not been directly studied. We investigated whether a single assessment of femoral neck BMD and fracture history can predict fracture risk over 20 to 25 years. We used data from the Study of Osteoporotic Fractures (SOF) that assessed BMD and risk factors in 7959 women age ≥67 (mean = 73.4) in 1988-1990. Follow-up for fractures continued for 25 years for hip fracture, and for 20 years for any nonvertebral fracture. Using age-adjusted proportional hazards models, we analyzed the relationships between a single baseline assessment of femoral neck BMD, fracture history and age, and 20-25-year fracture incidence. The 25-year cumulative incidence of hip fracture was 17.9%; 20-year incidence of any nonvertebral fracture was 46.2%. The 25-year hip fracture incidence was highest in those ≥80 years old (22.6%) compared to 13.9% in women aged <70 years. A single femoral neck BMD measurement strongly predicted long-term hip fracture risk to 25 years: 29.6% risk in the lowest BMD quartile versus 7.6% with the highest relative hazard (RH) = 4.9 (95% CI, 4.1 to 6.0). Femoral neck BMD predicted hip fracture with little degradation over time from RH/SD = 2.6 (2.2 to 3.0) for 0 to 5 years to RH/SD = 1.8 (1.4 to 2.4) for 20 to 25 years. Lifetime hip fracture risk was similar (∼30%) regardless of age from 67 to >80 years. History of hip fracture predicted hip fractures only slightly better than history of nonvertebral fracture (RH = 1.6 [95% CI, 1.1 to 2.2] versus RH = 1.4 [95% CI, 1.2 to 1.5], respectively). Fracture history remained strongly predictive up to 25 years. We conclude that a single BMD and fracture history assessment can predict fracture risk over 20 to 25 years. Long-term risk of hip fracture remains extremely high in the oldest age groups, supporting risk assessment and consideration of treatment even in the oldest, highest-risk women.© 2017 American Society for Bone and Mineral Research.

Keywords: AGE; BMD; FRACTURE; HISTORY OF FRACTURE.


Figures

Figure 1:
Figure 1:
Cumulative incidence of hip fracture (25 years) and non-vertebral fractures (20 years). The number of subjects still active and without the event of interest at each time point is reported.
Figure 2:
Figure 2:
Cumulative incidence of hip (25 years, Figure 2A-C) and non-vertebral fracture (20 years, Figure 2D-F) by categories of individual risk factors including age (Figures 2A & 2D), age-adjusted femoral neck BMD quartiles (Figures 2B & 2E) and history of non-vertebral fractures (Figures 2C & 2F). For each panel the number of subjects still active and without the event of interest at each time point according to baseline age, BMD or fracture history are reported. Cumulative incidence of mortality by age-adjusted femoral neck BMD quartiles (Figure 2G)
Figure 2:
Figure 2:
Cumulative incidence of hip (25 years, Figure 2A-C) and non-vertebral fracture (20 years, Figure 2D-F) by categories of individual risk factors including age (Figures 2A & 2D), age-adjusted femoral neck BMD quartiles (Figures 2B & 2E) and history of non-vertebral fractures (Figures 2C & 2F). For each panel the number of subjects still active and without the event of interest at each time point according to baseline age, BMD or fracture history are reported. Cumulative incidence of mortality by age-adjusted femoral neck BMD quartiles (Figure 2G)
Figure 3:
Figure 3:
10 and 25 year cumulative incidence of hip fracture by baseline age and femoral neck BMD T-score

References

    1. Marshall D, Johnell O, Wedel H. Meta-analysis of how well measures of bone mineral density predict occurrence of osteoporotic fractures. Bmj. 1996;312:1254–1259. - PMC - PubMed
    1. Taylor BC, Schreiner PJ, Stone KL, et al. Long-term prediction of incident hip fracture risk in elderly white women: study of osteoporotic fractures. Journal of the American Geriatrics Society. 2004;52(9):1479–1486. - PubMed
    1. Nguyen ND, Ahlborg HG, Center JR, Eisman JA, Nguyen TV. Residual lifetime risk of fractures in women and men. Journal of bone and mineral research : the official journal of the American Society for Bone and Mineral Research. 2007;22(6):781–788. - PubMed
    1. Kanis JA, Oden A, Johansson H, Borgstrom F, Strom O, McCloskey E. FRAX and its applications to clinical practice. Bone. 2009;44(5):734–743. - PubMed
    1. Kanis JA, Johansson H, Oden A, et al. A family history of fracture and fracture risk: a meta-analysis. Bone. 2004;35:1029–1037. - PubMed

Publication types