. 2017 Nov 1;77(21):5846-5859.
doi: 10.1158/0008-5472.CAN-16-3152. Epub 2017 Jul 18.

Lysyl Oxidase-like Protein LOXL2 Promotes Lung Metastasis of Breast Cancer

Affiliations

Lysyl Oxidase-like Protein LOXL2 Promotes Lung Metastasis of Breast Cancer

Fernando Salvador et al. Cancer Res. .

Erratum in

Abstract

The lysyl oxidase-like protein LOXL2 has been suggested to contribute to tumor progression and metastasis, but in vivo evidence has been lacking. Here we provide functional evidence that LOXL2 is a key driver of breast cancer metastasis in two conditional transgenic mouse models of PyMT-induced breast cancer. LOXL2 ablation in mammary tumor cells dramatically decreased lung metastasis, whereas LOXL2 overexpression promoted metastatic tumor growth. LOXL2 depletion or overexpression in tumor cells does not affect extracellular matrix stiffness or organization in primary and metastatic tumors, implying a function for LOXL2 independent of its conventional role in extracellular matrix remodeling. In support of this likelihood, cellular and molecular analyses revealed an association of LOXL2 action with elevated levels of the EMT regulatory transcription factor Snail1 and expression of several cytokines that promote premetastatic niche formation. Taken together, our findings established a pathophysiologic role and new function for LOXL2 in breast cancer metastasis. Cancer Res; 77(21); 5846-59. ©2017 AACR.


Figures

Figure 1
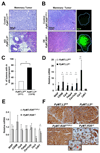
Figure 1. Loxl2 promotes PyMT tumor epithelial dedifferentiation and local invasion.
(A, B) Representative H&E images of paraffin-embedded tumors from PyMT;L2Δ/- and PyMT;R26L2 16 week-old mice and their respective controls. In the case of the overexpression model (B), representative GFP images of primary tumors are also shown (right panels). Scale bars: 500 μm. (C) Percentage of primary breast tumors containing regions of in situ carcinoma developed by PyMT;Loxl2fl/fl and PyMT;L2Δ/- mice. The number of tumors with in situ component over the total number of analyzed tumors from reach genotype is shown in the bottom; *P< 0.05 (Fisher’s exact test). (D, E) Primary tumors of 14 week-old PyMT;R26L2 (D) and PyMT;L2Δ/- (E) mice and their paired controls (n=5, each) were subjected to RT-qPCR analyses for the indicated differentiation markers. Error bars represent standard error. *P<0.05; **0.001<P<0.005 (Student's t-test; unpaired, 2-tailed). (F) Representative E-cadherin immunohistochemical images in PyMT tumors with modified Loxl2 expression: PyMT;L2Δ/- (upper right) and PyMT;R26L2 (bottom right) as well as in their specific controls PyMT;L2fl/fl (upper left) and PyMT;R26STOPL2 (bottom left), respectively; x20 magnification. Inset shows a specific heterogeneous staining area with conserved (*, black) and reduced (#, red) E-cadherin in one representative PyMT;R26L2 tumor; x40 magnification.
Figure 2
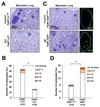
Figure 2. Loxl2 enhances PyMT lung metastatic burden.
(A, C) Representative H&E stained lung sections from PyMT;L2Δ/- (A) and PyMT;R26L2 (C) 16 week-old mice and their corresponding tumor bearing controls. GFP images of metastatic lungs from the overexpression Loxl2 model are also shown in C (right panels). Scale bars: 500 μm. (B, D) Quantification of average number and size of lung metastatic foci developed by PyMT;L2Δ/- (B) and PyMT;R26L2 (D) mice at 16 weeks of age and their paired controls. The number of analyzed mice from each genotype is shown at the bottom and size of lesions by color code. Error bars represent standard error. *P<0.05 (Student's t-test; unpaired, 2-tailed).
Figure 3
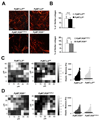
Figure 3. Aberrant expression of Loxl2 does not affect collagen ECM stiffness of PyMT primary tumors.
(A) Representative images of picrosirius-red staining of PyMT tumors lacking (upper) and overexpressing Loxl2 (bottom) compared with their respective controls. Scale bars: 50 μm. (B) Quantification of threshold pixel density representing positive picrosirius staining for tumors of the indicated genotypes. Error bars represent standard error, n.s. not statistically significant. (C, D) Atomic force microscopy (AFM) analysis of PyMT primary tumors. Left, representative forcemaps (40 μm x 40 μm) depicting typical elastic modulus values of stroma-rich regions of the tumors of the indicated genotypes. Right, quantitative analysis of AFM microscopy data showing similar values in all PyMT tumors regardless Loxl2 expression. Bars represent average elastic modulus for control PyMT;L2fl/fl (black, 353.17 Pa), PyMT;L2Δ/- (light grey, 260.78 Pa), control PyMT;R26STOPL2 (dark grey, 401.50 Pa) and PyMT;R26L2 (light grey, 418.77 Pa) mouse groups. Data represent 4 mice from each condition, with 2 tissue sections from each mouse, and measurements taken from at least 5 different locations on each tissue section.
Figure 4
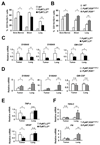
Figure 4. Loxl2 positively modulates CD11b+/Gr1+ cell recruitment and cytokine production.
(A, B) Content of CD11b+/Gr1+ double positive cells in bone marrow, blood and lung samples from wt, PyMT;L2fl/fl, PyMT; L2Δ/- (A) and wt, PyMT;R26STOPL2 and PyMT;R26L2 (B) 14 week-old mice, determined by FACs analysis. Tissue samples analyzed: 7 pools of two mice per tissue for PyMT;L2fl/fl and PyMT;L2Δ/- mouse cohorts; 6 PyMT;R26STOPL2 and 8 PyMT;R26L2 mice, and 2 pools for the tumor-free animals (wt). (C, D) Quantitative RT-qPCR analyses of S100A8, S100A9 and GM-CSF in tumors and lungs from (C) PyMT;L2fl/fl and PyMT;L2Δ/-, and (D) PyMT;R26STOPL2 and PyMT;R26L2 14 week-old mice. (E) Quantification of TNF-a and VEGF expression levels by RT-qPCR in primary tumors and lungs of the indicated genotypes. (F) RT-qPCR analysis of tenascin-C (Ten-C) and fibronectin (FN) mRNA levels in primary tumors and lungs of the indicated genotypes. RNA from 5 primary tumors and 4 lung samples per genotype was used in all the assays. Bars represent standard error. *P< 0.05; **0.001<P< 0.005; n.s. not significant (Student's t-test; unpaired, 2-tailed).
Figure 5
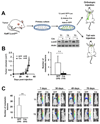
Figure 5. In vitro abrogation of Loxl2 critically diminishes the metastatic capacity of PyMT mammary tumor cells.
(A) Diagram representing the strategy followed for isolation and generation of PyMT cells used in the indicated tumorigenesis assays. Primary breast cancer cells were isolated from mammary tumors developed by control PyMT; L2fl/fl mice and grown in culture. Cells were first lentivirally infected with a GFP-Luciferase vector, and then transduced with control GFP- or Cre-adenovirus. Loxl2 depletion in cell lines from three independent PyMT tumors was confirmed by semi-quantitative RT-PCR (middle, bottom). Deleted and control Loxl2 cells were orthotopically inoculated in the mammary fat pad (right, upper) or tail vein injected (lower) into nude mice. (B) Quantification of tumor size (left) and metastatic foci (right) after orthotopic injection of both control and Loxl2 depleted primary PyMT cell lines; the number of mice with metastasis is indicated below the graphs. Error bars represent standard error. n.s., not significant (Student's t-test; unpaired, 2-tailed). (C) Left, number of lung metastasis foci from tail vein injected mice with adeno-GFP or adeno-Cre cells; the number of mice with metastasis is indicated below the graphs. Error bars represent standard error. **0.001<P<0.005; n.s., not significant (Student's t-test; unpaired, 2-tailed). Right, representative bioluminescence images of intravenously injected mice with control adeno-GFP or adeno-Cre cells isolated from two independent PyMT tumors. Images were obtained at the indicated days after tail vein injection. The color scale represents the photon flux (photons per second) emitted from the lung region of xenografted mice. All the experiments were performed in duplicates with stable cell cultures derived from three different PyMT tumors (T1-T3).
Figure 6
Figure 6. Loxl2 modulates invasiveness of PyMT cells and Snail1 protein levels.
(A) Representative images of invasion assays on matrigel (left panels) and quantification (right panels) of PyMT cells (n=3, each) displaying altered levels of Loxl2 as indicated. Error bars represent standard error. *P<0.05; ***P<0.001 (Student's t-test; unpaired, 2-tailed). (B) Protein levels of different EMT and migration markers in three independent PyMT cell lines (T1, T2, T3) generated from the indicated genotypes infected or not with Cre recombinase; α-tubulin was used as loading control. (C) Quantification of Snail1 mRNA levels by RT-qPCR in PyMT cells with Loxl2 deletion or overexpression and corresponding controls in one representative cell culture of each of the genotypes. (D) Representative images of immunofluorescence analysis of Snail1 expression (green) in PyMT tumors lacking Loxl2 (bottom panels) compared with their paired controls (upper panels) revealing decreased nuclear Snail1 levels in the absence of Loxl2. Nuclei are detected with Dapi (blue). Merge confocal microscopy images (middle panels) and magnifications (x2) are shown (right panels). Scale bar: 20 μm. (E) Quantitation of the percentage Snail1-positive and Snail1-negative cells (left) and the mean intensity of Snail1 nuclear staining (arbitrary units) (right). A minimum of three random fields were analyzed per sample (n=6 for PyMT;L2fl/fl; n=7 for PyMT;L2Δ/-). Error bars represent standard error. *P<0.05; ***P<0.001 (Student’s t-test; unpaired, 2-tailed).
Figure 7
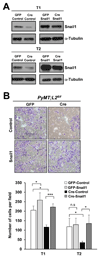
Figure 7. Snail1 overexpression restores invasive properties of PyMT-Loxl2 deficient cells.
(A) Snail1 protein levels of PyMT-GFP (control) and PyMT-Cre (Loxl2-deficient) cell lines in vitro manipulated for Snail1 overexpression (GFP-Snail1 and Cre-Snail1) (right panels) or empty control vector (left panels) by lentiviral infection. α-tubulin was used as loading control. (B) Representative images of invasion assays on matrigel (upper panels) and quantification (bottom panel) of PyMT;L2fl/fl-GFP and PyMT;L2fl/fl-Cre cells overexpressing Snail1 or control vector. Experiments were performed twice with two independent PyMT tumor cell lines (T1, T2); triplicates for each of the Loxl2 and Snail1 combinations were analyzed. Error bars represent standard error. *P<0.05; ***P< 0.001; n.s., not significant (Student's t-test; unpaired, 2-tailed).

References

    1. Lucero HA, Kagan HM. Lysyl oxidase: an oxidative enzyme and effector of cell function. Cell Mol Life Sci. 2006;63:2304–16. - PMC - PubMed
    1. Kim YM, Kim EC, Kim Y. The human lysyl oxidase-like 2 protein functions as an amine oxidase toward collagen and elastin. Mol Biol Rep. 2011;38:145–9. - PubMed
    1. Moon HJ, Finney J, Ronnebaum T, Mure M. Human lysyl oxidase-like 2. Bioorg Chem. 2014;57:231–41. - PMC - PubMed
    1. Barker HE, Cox TR, Erler JT. The rationale for targeting the LOX family in cancer. Nat Rev Cancer. 2012;12:540–52. - PubMed
    1. Cano A, Santamaria PG, Moreno-Bueno G. LOXL2 in epithelial cell plasticity and tumor progression. Future Oncol. 2012;8:1095–108. - PubMed

Publication types

MeSH terms

Substances