. 2017 Nov;15(11):1517-1530.
doi: 10.1158/1541-7786.MCR-17-0182. Epub 2017 Jul 18.

EWS/FLI is a Master Regulator of Metabolic Reprogramming in Ewing Sarcoma

Affiliations

EWS/FLI is a Master Regulator of Metabolic Reprogramming in Ewing Sarcoma

Jason M Tanner et al. Mol Cancer Res. 2017 Nov.

Abstract

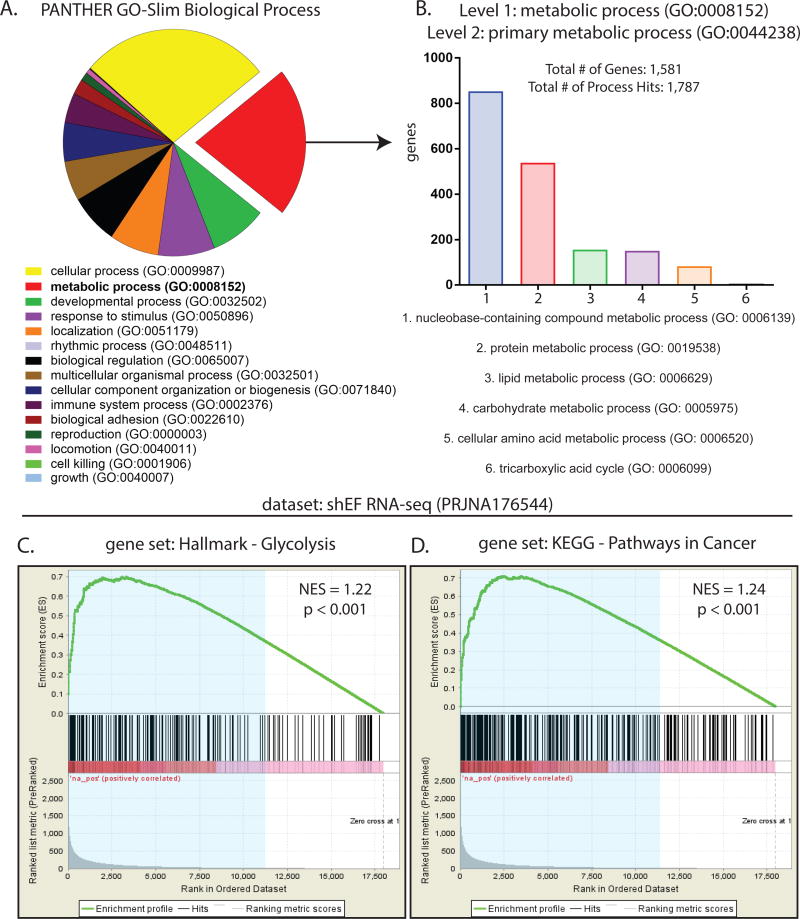
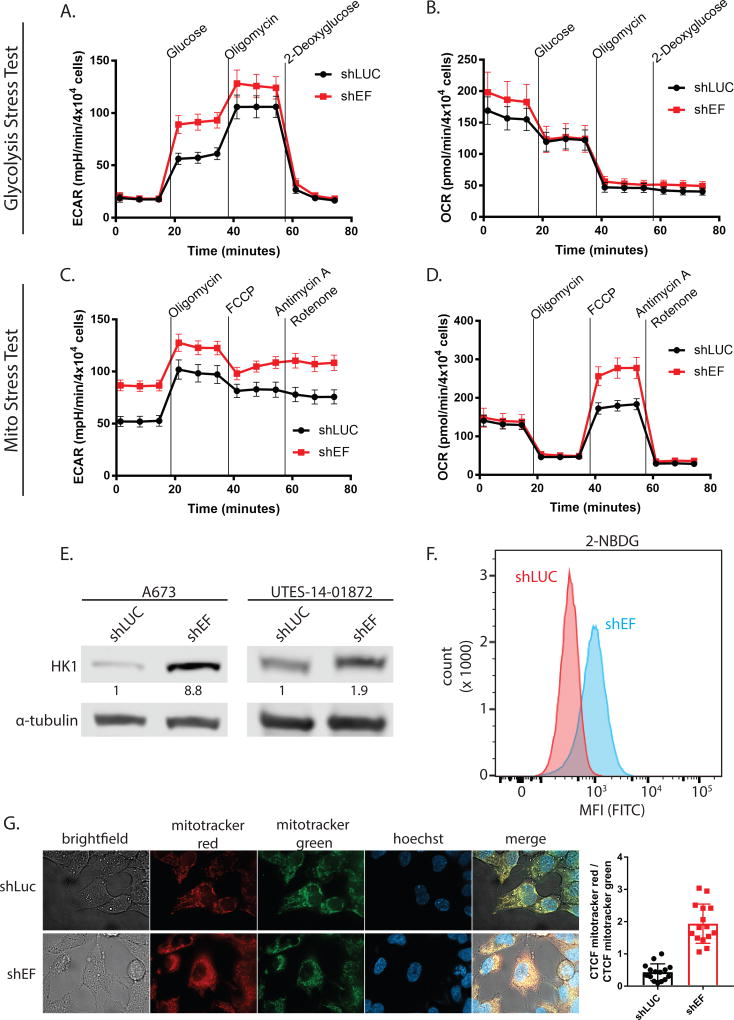
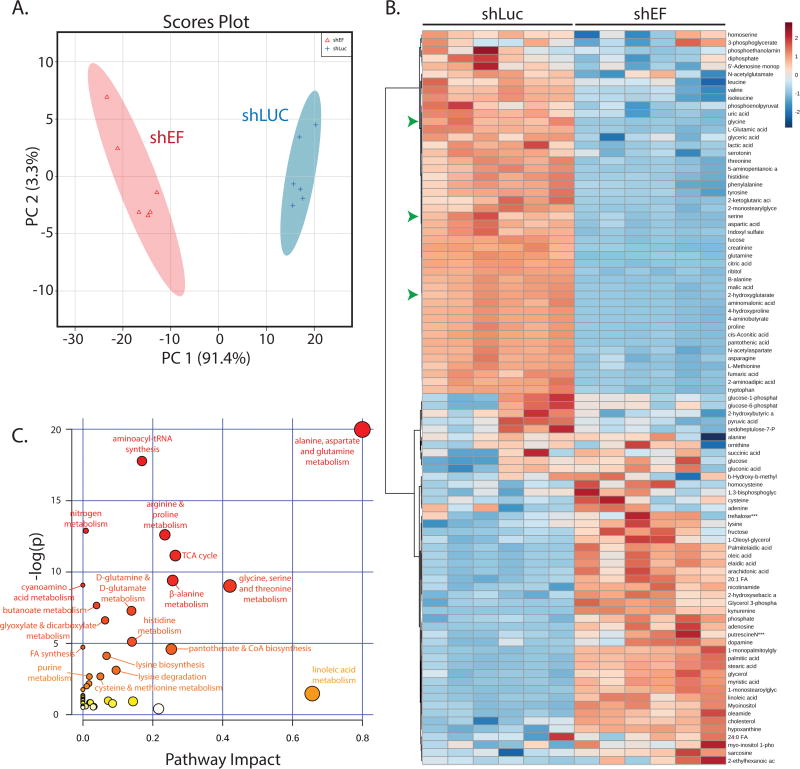
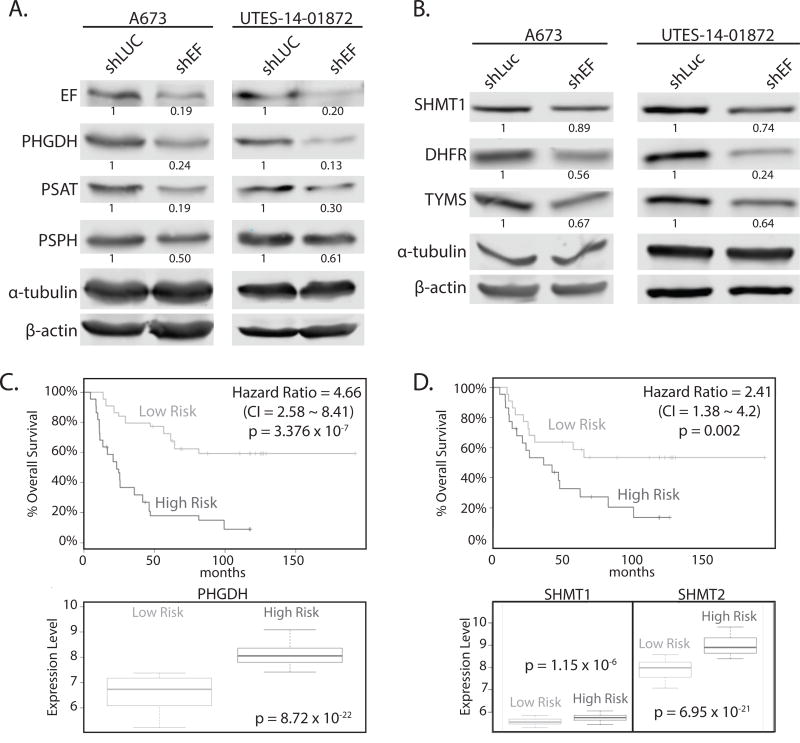
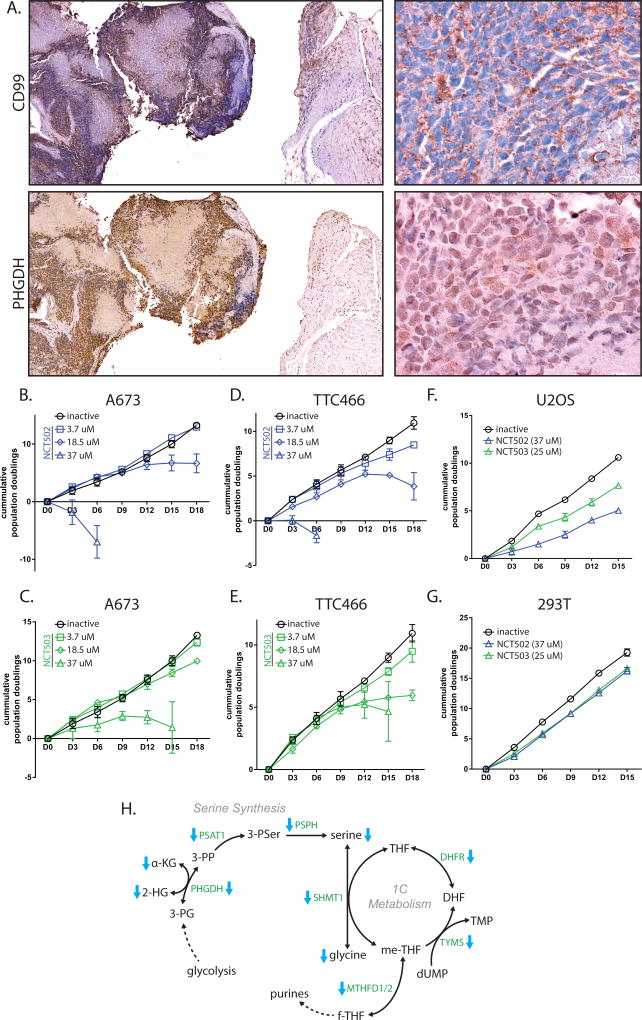
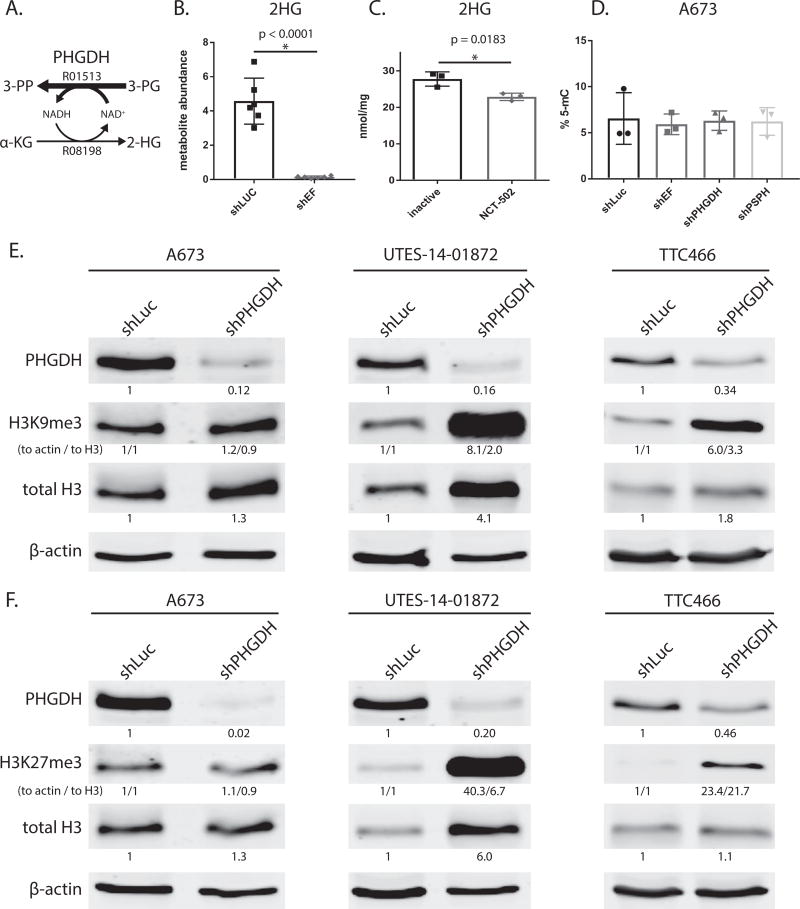
Ewing sarcoma is a bone malignancy driven by a translocation event resulting in the fusion protein EWS/FLI1 (EF). EF functions as an aberrant and oncogenic transcription factor that misregulates the expression of thousands of genes. Previous work has focused principally on determining important transcriptional targets of EF, as well as characterizing important regulatory partnerships in EF-dependent transcriptional programs. Less is known, however, about EF-dependent metabolic changes or their role in Ewing sarcoma biology. Therefore, the metabolic effects of silencing EF in Ewing sarcoma cells were determined. Metabolomic analyses revealed distinct separation of metabolic profiles in EF-knockdown versus control-knockdown cells. Mitochondrial stress tests demonstrated that knockdown of EF increased respiratory as well as glycolytic functions. Enzymes and metabolites in several metabolic pathways were altered, including de novo serine synthesis and elements of one-carbon metabolism. Furthermore, phosphoglycerate dehydrogenase (PHGDH) was found to be highly expressed in Ewing sarcoma and correlated with worse patient survival. PHGDH knockdown or pharmacologic inhibition in vitro caused impaired proliferation and cell death. Interestingly, PHGDH modulation also led to elevated histone expression and methylation. These studies demonstrate that the translocation-derived fusion protein EF is a master regulator of metabolic reprogramming in Ewing sarcoma, diverting metabolites toward biosynthesis. As such, these data suggest that the metabolic aberrations induced by EF are important contributors to the oncogenic biology of these tumors.Implications: This previously unexplored role of EWS/FLI1-driven metabolic changes expands the understanding of Ewing sarcoma biology, and has potential to significantly inform development of therapeutic strategies. Mol Cancer Res; 15(11); 1517-30. ©2017 AACR.


Figures

Figure 1
Figure 1. EWS/FLI exerts significant effects on expression of genes important for metabolism
A. Gene ontology analysis of 5,698 EWS/FLI-regulated genes from publicly available RNA-seq data (27,37) using the PANTHER GO-Slim Biological Process annotation dataset. Threshold of significance for differential expression was log2(ratio) ≥ 0.585 and AdjP ≥ 10. Of these, 1,920 (33.7%) were annotated as metabolic processes (GO: 0008152). B. Among these metabolic processes (GO: 0008152), genes annotated as primary metabolic processes (GO: 0044238) were mostly involved in nucleobase-containing compound metabolism (GO: 0006139) and protein metabolism (GO: 0019538). C & D. Gene set enrichment analysis comparing a rank-ordered dataset (ranked by AdjP) of EWS/FLI knockdown RNA-seq data to the gene sets Hallmark-Glycolysis and KEGG-Pathways In Cancer, available from the Molecular Signatures Database (MSigDB) version 5.2. Differentially expressed genes (blue shaded region) in shEF vs. shLUC correlate significantly with genes important for glycolysis and pathways commonly altered in cancer. NES = normalized enrichment score.
Figure 2
Figure 2. Silencing EWS/FLI results in functional metabolic changes
A & B. Glycolysis stress tests demonstrate an increased extracellular acidification rate (ECAR) in response to a glucose bolus in shEF vs. shLUC A673 cells. No difference was seen in oxygen consumption rate in the glycolysis stress test. C & D. Basal ECAR is higher in shEF vs. shLUC cells, a reflection of different basal glucose concentrations in different test media. Mito stress tests reveal increased oxygen consumption rate (OCR) after treatment with the FCCP mitochondrial uncoupler, indicating increased maximal respiration in shEF vs. shLUC A673 cells. Basal respiration was similar between groups. E. Hexokinase 1 (HK1) was increased in A673 and UTES-14-01872 cells after EF knockdown. F. Uptake of the fluorescent glucose molecule 2-NBDG was increased in shEF vs. shLUC cells, as measured by flow cytometry. G. Mitotracker red signal was elevated in shEF vs. shLUC cells, suggesting increased mitochondrial membrane potential. A representative image from A673 cells is shown, and quantification was done on 3 cells from each of 5 high-power field images, shown as the corrected total cell fluorescence (CTCF) ratio of mitotracker red / mitotracker green (mean ± standard deviation).
Figure 3
Figure 3. The global profile of cellular metabolite abundance is altered by EWS/FLI
A. Principal components analysis of metabolite abundance data (assessed by GC-MS) demonstrates distinct metabolic profiles in shEF vs. shLUC A673 cells. B. Hierarchichal clustering of differential metabolite abundance after EF knockdown was done by Euclidean distances and a Ward statistic. Metabolite abundances cluster into two distinct groups corresponding to shEF and shLUC conditions. Serine, glycine, and 2-hydroxyglutarate are indicated by green arrowheads. C. Topological analysis of metabolite data was performed by MetaboAnalyst 3.0. Circle color represents p value and node size represents pathway impact value. Pathway impact is calculated as the cumulative percentage of centrality measures of metabolites notes within pathways.
Figure 4
Figure 4. Key enzymes of serine & glycine synthesis, and 1-carbon metabolism, are altered by silencing EWS/FLI
A. Western blots of enzymes of serine synthesis in A673 and UTES-14-01872 cells treated by shEF and shLUC. PHGDH, PSAT, and PSPH are lower in shEF vs. shLUC. B. SHMT1, DHFR and TYMS are also decreased in A673 and UTES-14-01872 cells after EF knockdown. C & D. SurvExpress analysis of overall survival of patients correlated with expression of PHGDH, SHMT1 and SHMT2, demonstrating higher expression correlates with poorer overall survival in Ewing sarcoma patients. CI = confidence interval.
Figure 5
Figure 5. PHGDH is high in Ewing sarcoma tumors, and is important for cell viability
A. Immunohistochemistry of CD99 and PHGDH in Ewing sarcoma tumors from a Ewing sarcoma patient. Cell surface staining of CD99 is diagnostic for Ewing sarcoma. Cytosolic staining of PHGDH closely correlates with regions of tumor, indicating elevated PHGDH levels in tumor vs. adjacent tissue. B & C. PHGDH inibition in A673 cells by NCT502 and NCT503 causes decreased cell growth and eventual cell death. D & E. PHGDH inhibition also impaired cell growth of TTC466 cells. F & G. High-dose treatment of osteosarcoma cells (U2OS) and 293T cells show some growth defect, but not as much as in Ewing sarcoma cell lines. H. Diagramatic representation of serine/glycine synthesis and 1-carbon metabolism pathways that are decreased by EF knockdown. Enzymes are green text and metabolites are black text. Blue arrows indicate enzymes or metabolites that were observed as decreased in shEF vs. shLUC cells. Nucleotide and folate analogs were not measured. Co-factors and some intermediates are ommitted for clarity.
Figure 6
Figure 6. Modulation PHGDH causes decreased 2-hydroxyglutarate, and altered expression and methylation of histones
A. Diagramatic representation of PHGDH enzyme function. PHGDH primarily catalyzes converion of 3-phospho-D-glycerate (3-PG) to 3-phosphoonoxypyruvate (3-PP), but also produces a minor product via conversion α-ketoglutarate (α-KG) to 2-hydroxyglutarate (2-HG). KEGG reaction numbers are indicated. B & C. 2-hydroxyglutarate abundance as measured by GC-MS is lower in shEF vs. shLUC A673 cells. Inhibition of PHGDH by NCT-502 also decreases levels of 2-HG in A673 cells. D. LINE-1 methylation, a surrogate of bulk DNA methylation, is not different in shEF, shPHGDH or shPSPH vs. shLUC cells. E & F. In UTES-14-01872 and TTC466 cells, knockdown of PHGDH results in increased levels of histone H3 and increased methylation of H3 histones at lysine 9 and 27. This was not seen in A673 cells. A673 and UTES-14-01872 cell lines express EWS/FLI; TTC466 cells express the EWS/ERG fusion protein. For H3K9me3 and H3K27me3, both normalization to actin and normalization to total H3 are shown (indicated as “to actin / to total H3”).

References

    1. Linabery AM, Ross JA. Childhood and adolescent cancer survival in the US by race and ethnicity for the diagnostic period 1975–1999. Cancer. 2008;113:2575–96. - PMC - PubMed
    1. Lahl M, Fisher VL, Laschinger K. Ewing’s sarcoma family of tumors: an overview from diagnosis to survivorship. Clin J Oncol Nurs. 2008;12:89–97. - PubMed
    1. Brohl AS, Solomon DA, Chang W, Wang J, Song Y, Sindiri S, et al. The Genomic Landscape of the Ewing Sarcoma Family of Tumors Reveals Recurrent STAG2 Mutation. PLOS Genet. 2014;10:e1004475. - PMC - PubMed
    1. Gangwal K, Sankar S, Hollenhorst PC, Kinsey M, Haroldsen SC, Shah AA, et al. Microsatellites as EWS/FLI response elements in Ewing’s sarcoma. Proc Natl Acad Sci. 2008;105:10149–54. - PMC - PubMed
    1. Hancock JD, Lessnick SL. A transcriptional profiling meta-analysis reveals a core EWS-FLI gene expression signature. Cell Cycle Georget Tex. 2008;7:250–6. - PubMed

Publication types

MeSH terms

Substances