. 2017 Aug 7;149(8):799-811.
doi: 10.1085/jgp.201711801.

Dynamic role of the tether helix in PIP2-dependent gating of a G protein-gated potassium channel

Affiliations

Dynamic role of the tether helix in PIP2-dependent gating of a G protein-gated potassium channel

Emre Lacin et al. J Gen Physiol. .

Abstract

G protein-gated inwardly rectifying potassium (GIRK) channels control neuronal excitability in the brain and are implicated in several different neurological diseases. The anionic phospholipid phosphatidylinositol 4,5 bisphosphate (PIP2) is an essential cofactor for GIRK channel gating, but the precise mechanism by which PIP2 opens GIRK channels remains poorly understood. Previous structural studies have revealed several highly conserved, positively charged residues in the "tether helix" (C-linker) that interact with the negatively charged PIP2 However, these crystal structures of neuronal GIRK channels in complex with PIP2 provide only snapshots of PIP2's interaction with the channel and thus lack details about the gating transitions triggered by PIP2 binding. Here, our functional studies reveal that one of these conserved basic residues in GIRK2, Lys200 (6'K), supports a complex and dynamic interaction with PIP2 When Lys200 is mutated to an uncharged amino acid, it activates the channel by enhancing the interaction with PIP2 Atomistic molecular dynamic simulations of neuronal GIRK2 with the same 6' substitution reveal an open GIRK2 channel with PIP2 molecules adopting novel positions. This dynamic interaction with PIP2 may explain the intrinsic low open probability of GIRK channels and the mechanism underlying activation by G protein Gβγ subunits and ethanol.


Figures

Figure 1.
Figure 1.
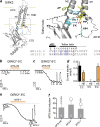
The positive charge at 6’K is not essential for activation of GIRK2 channels. (a) Model shows a single subunit of GIRK2 (PDB: 4KFM), highlighting the region involved in binding PIP2. Four lysines form hydrogen bonds with the 4′ and 5′ phosphates of PIP2. Amino acid sequences of the tether helix for mouse GIRK2 (Kir3.2) and chicken Kir2.2 are shown below with the proposed number system. Arrow indicates HBC. (b) Current trace for GIRK2*-5′C shows little effect of 5 µM carbachol (C), 100 mM ethanol (E), 100 mM MPD (M) or Ba2+ before or after exposure to 1 mM MTS-HE. Vh= −100 mV. (c) Current trace for GIRK2*-6′C shows large activation of basal current with 1 mM MTS-HE. Note the inhibition of MTS-HE–activated current with both Ba2+ and MPD. (d) Bar graph shows mean increase in basal current density (pA/pF) measured at −100 mV. (e) Current trace for GIRK2*-6′C shows large activation of basal current with 0.1 mM MTS-F. (f) Mean fold-induction of basal current with 0.1 mM MTS-HE, 0.1 mM MTS-F, and 0.1 mM MTS-Y for GIRK2*-6′C. Bars show mean ± SEM.
Figure 2.
Figure 2.
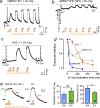
A tyrosine substitution at 6′K increases agonist-independent basal current. (a) Structures of amino acids introduced at 6′K in GIRK2. (b) Current–voltage plots show the change in inwardly rectifying current with different alcohols and Ba2+ for 6′R and 6′Y. (c) Bar graph shows change in current density with different substitutions at 6’K. Note the significantly larger current for 6′Y (**, P < 0.05). (d) Mean percentage change in current, relative to the Ba2+ basal, for 100 mM ethanol (EtOH), 100 mM 1-propanol (PrOH), or MPD (100 mM) with different amino acid substitutions at the 6′ position. Note the reduced alcohol responses for 6′Y (n = 8–18). Bars represent mean ± SEM.
Figure 3.
Figure 3.
GIRK2 6′Y channels display altered association for PIP2. (a–c) The current is plotted as a function of time for a cell expressing Dr-Vsp with GIRK2*-6′Y (a), GIRK2*-6’K (WT; b), or Kir2.1 (c) channels. Vh = −120 mV. Voltage-dependent (+100 mV) activation times for Dr-Vsp are indicated by orange bars. 100 mM 1-propanol, 100 mM ethanol, or 100 mM MPD (P, E, and M, respectively) and 3 mM Ba2+ were applied before and after Dr-Vsp activation. (d) Fractional inhibition of steady-state basal current is plotted as a function of different Dr-Vsp activation times. Note the rank order of Kir2.1 > GIRK2*-6′Y > GIRK2* depletion time. n = 7–10. (e) Representative examples of GIRK current depletion and recovery after 100 ms activation of Dr-Vsp at +100 mV. Vh = −120 mV. Best-fit single exponentials with time constants are shown. (f) Mean tau (s) for depletion and recovery of current following Dr-Vsp–dependent depletion. **, P < 0.05; ns, not significant; Student’s t test. Bars represent mean ± SEM.
Figure 4.
Figure 4.
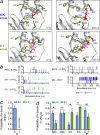
Dynamic change in hydrogen bonding with PIP2 in GIRK2-6′K and GIRK2-6′Y MD simulations. (a) Examples of GIRK2/PIP2 structures at the start and after 200 ns of MD simulations for GIRK2-6′K (WT) and GIRK2-6′Y channels. Note the 5′-PO4 of PIP2 moves away from starting position in the WT simulation. In contrast, the 5′-PO4 of PIP2 appears to engage PIP2 more deeply in the pocket in the 6′Y channel. One of four subunits is shown. (b) Each graph plots the number of hydrogen bonds during the 400-ns simulation time for the indicated pairs for WT GIRK2-6′K (blue) and GIRK2-′Y (green) for the PIP2 binding pockets shown in a. (c and d) Bar graphs show the mean relative probability of hydrogen bonds for all four subunits during the two 400-ns simulations for GIRK2-6′K (blue) and GIRK2-6′Y (green) channels. (c) Probability of hydrogen bonding between 9′E and 6′K/Y. (d) Probability of hydrogen bonding for K64, K90, 0′K, 5′K, and 6′K/Y with 5′-PO4 of PIP2 (of two maximal bonds). Note the number of hydrogen bonds increases with 0′K and 5′K but decreases for K64 with the 6′Y channel simulations. Bars represent mean ± SEM. *, P < 0.05; ns, not significant; Student’s t test.
Figure 5.
Figure 5.
PI(5)P is sufficient to activate GIRK2 channels in proteoliposomes. (a) Cartoon shows design of fluorescence-based K+ flux assay with GIRK2-containing liposomes. (b) Normalized mean traces of K+ flux for GIRK2 with acute application of CCCP, 30 µM of the indicated diC8 phosphoinositides (blue), and valinomycin. SEM bars are omitted for clarity. (c) Bar graph shows steady-state response of each phosphoinositide normalized to the response with PI(4,5)P2 and after subtracting basal flux (e.g., “Fractional activation vs. PI(4,5)P2”). Bars represent mean ± SEM. **, P < 0.05 ANOVA with Bonferroni post hoc test versus control (no diC8).
Figure 6.
Figure 6.
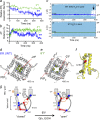
MD simulations of GIRK2 6′Y reveal dynamic opening of the channel at the HBC gate. (a) The relative PIP2 association number (see Materials and methods) is plotted as a function of simulation time for WT (6′K, blue) and 6′Y (green) channels. (b) The cross-distance diameter of the pore at the HBC, measured between the center of mass of F192 (−2′F) side chain, is plotted as a function of simulation time. (c) The water molecule density in the conduction pathway, moving in the z plane from the selectivity filter (0 Å) to the bottom of the M2 transmembrane domain (approximately −25 Å), is plotted as a function of the simulation time for WT (top) and 6′Y (bottom) channels. Note the loss of water around the region of the −2′F in WT channels (arrow). (d and e) Structural view of the HBC at 400 ns for GIRK2-WT (6′K; d) and GIRK2-6′Y (e). Note how PIP2 is bound loosely for WT and more tightly for 6′Y. (f) Superimposition of one subunit in 6′K (gray) and 6′Y (yellow) showing movement of M2 relative to G180 in 6′Y (red). (g) Cartoon summarizes hydrogen bond interactions for PIP2 and GIRK2 for new PIP2-closed and PIP2-open conformations based on MD simulations. EtOH, ethanol.

References

    1. Adney S.K., Ha J., Meng X.Y., Kawano T., and Logothetis D.E.. 2015. A critical gating switch at a modulatory site in neuronal Kir3 channels. J. Neurosci. 35:14397–14405. 10.1523/JNEUROSCI.1415-15.2015 - DOI - PMC - PubMed
    1. Aryal P., Dvir H., Choe S., and Slesinger P.A.. 2009. A discrete alcohol pocket involved in GIRK channel activation. Nat. Neurosci. 12:988–995. 10.1038/nn.2358 - DOI - PMC - PubMed
    1. Aryal P., Abd-Wahab F., Bucci G., Sansom M.S., and Tucker S.J.. 2014. A hydrophobic barrier deep within the inner pore of the TWIK-1 K2P potassium channel. Nat. Commun. 5:4377 10.1038/ncomms5377 - DOI - PMC - PubMed
    1. Baukrowitz T., Schulte U., Oliver D., Herlitze S., Krauter T., Tucker S.J., Ruppersberg J.P., and Fakler B.. 1998. PIP2 and PIP as determinants for ATP inhibition of KATP channels. Science. 282:1141–1144. 10.1126/science.282.5391.1141 - DOI - PubMed
    1. Best R.B., Zhu X., Shim J., Lopes P.E., Mittal J., Feig M., and Mackerell A.D. Jr. 2012. Optimization of the additive CHARMM all-atom protein force field targeting improved sampling of the backbone φ, ψ and side-chain χ(1) and χ(2) dihedral angles. J. Chem. Theory Comput. 8:3257–3273. 10.1021/ct300400x - DOI - PMC - PubMed

LinkOut - more resources