. 2017 Sep 15;28(19):2518-2530.
doi: 10.1091/mbc.E17-05-0316. Epub 2017 Jul 18.

Direct interaction of the Golgi V-ATPase a-subunit isoform with PI(4)P drives localization of Golgi V-ATPases in yeast

Affiliations

Direct interaction of the Golgi V-ATPase a-subunit isoform with PI(4)P drives localization of Golgi V-ATPases in yeast

Subhrajit Banerjee et al. Mol Biol Cell. .

Abstract

Luminal pH and phosphoinositide content are fundamental features of organelle identity. Vacuolar H+-ATPases (V-ATPases) drive organelle acidification in all eukaryotes, and membrane-bound a-subunit isoforms of the V-ATPase are implicated in organelle-specific targeting and regulation. Earlier work demonstrated that the endolysosomal lipid PI(3,5)P2 activates V-ATPases containing the vacuolar a-subunit isoform in Saccharomyces cerevisiae Here we demonstrate that PI(4)P, the predominant Golgi phosphatidylinositol (PI) species, directly interacts with the cytosolic amino terminal (NT) domain of the yeast Golgi V-ATPase a-isoform Stv1. Lysine-84 of Stv1NT is essential for interaction with PI(4)P in vitro and in vivo, and interaction with PI(4)P is required for efficient localization of Stv1-containing V-ATPases. The cytosolic NT domain of the human V-ATPase a2 isoform specifically interacts with PI(4)P in vitro, consistent with its Golgi localization and function. We propose that NT domains of Vo a-subunit isoforms interact specifically with PI lipids in their organelles of residence. These interactions can transmit organelle-specific targeting or regulation information to V-ATPases.


Figures

FIGURE 1:
FIGURE 1:
Localization of Stv1NT-mCherry to puncta. Stv1NT-mCherry (in which the transmembrane C-terminal domain of Stv1 is replaced by mCherry) was expressed from the genomic STV1 locus in (A) S. cerevisiae wild-type strain BY4741; (B) BY4741 vph1∆ cells, which lack the second Vo a-subunit isoform; and (C) BY4741 vac14∆ cells, which lack PI(3,5)P2. For each set of panels, differential interference contrast images are shown on the left and mCherry fluorescence is shown on the right.
FIGURE 2:
FIGURE 2:
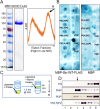
Stv1NT specifically interacts with the Golgi lipid PI(4)P in vitro. (A) Left, Coomassie-stained SDS–PAGE showing purified MBP-Stv1NT- FLAG and molecular mass markers. Right, the elution profile of MBP-Stv1NT-FLAG from a Sephadex 200 gel-filtration column. The sharp lowest molecular weight fraction, indicated by M, corresponds to the monomer and was used for the lipid–protein binding assays. (B) PIP strips probed with MBP-Stv1NT-FLAG and MBP. Left, MBP-Stv1NT-FLAG interacts specifically with PI(4)P. Right, MBP alone does not interact with any of the phospholipid head groups. PIP blots shown are representative of at least three different blots probed with protein from at least two independent protein purifications. (C) Schematic diagram describing the liposome flotation assay. (D) Anti-FLAG immunoblot of MBP-Stv1NT-FLAG in fractions obtained from flotation with liposomes containing 5% of the indicated PI lipid or PS as a control. Equal amounts of MBP-Stv1NT-FLAG were mixed with liposomes before flotation. After flotation, protein was precipitated from each fraction and resuspended, and equal volumes were separated by SDS–PAGE and transferred to nitrocellulose. The numbers indicate the fractions from top to bottom of the flotation tube (indicated as 1–6 in C). The third fraction (arrow) represents the position of liposomes after flotation.
FIGURE 3:
FIGURE 3:
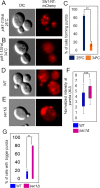
Localization of Stv1-NT is regulated by the Golgi PI4-kinase Pik1 and the PI(4)P-phosphatase Sac1. (A) Stv1NT-mCherry localization in pik1-139 cells at permissive temperature (25°C). (B) Stv1NT-mCherry localization in pik1-139 cells following by a shift to restrictive temperature (34°C) for 2 h. (C) Percentage of cells exhibiting punctate localization of Stv1NT-mCherry at permissive temperature (n = 284) and restrictive temperature (n = 277) (p < 0.001). (D, E) Localization of Stv1NT-mCherry in wild-type cells (D) and sac1Δ cells (E). (F) Box-and-whisker plot showing normalized median intensity of mCherry signal at puncta in WT (n = 68) cells and sac1Δ (n = 52) cells (p < 0.00005). (G) Percentage of cells with larger puncta in wild-type and sac1∆ cells was determined as described in Materials and Methods (p < 0.05).
FIGURE 4:
FIGURE 4:
Down-regulation of intracellular PI(4)P level induces mislocalization and impaired function of V-ATPases containing Stv1. (A, B) Localization of Stv1-GFP and Vph1-mCherry in pik1-39 mutant. (A) Localization at the permissive temperature of 25°C (representative of n = 511 yeast cells) or (B) after a 2-h incubation at the restrictive temperature of 34°C (representative of n = 1203 yeast cells). Vacuoles are marked by Vph1-mCherry. (C) Mean ± SEM of Pearson correlation coefficient for colocalization of GFP and mCherry from three independent experiments is represented in a histogram (p < 0.00005). (D) Growth assay of congenic WT, vph1Δ, pik1-139, and vph1Δ pik1-139 cells in media buffered to pH 5.0 (left) and pH 7.5 (right). Cells from each strain were diluted to the same density, then 10-fold serial dilutions (left to right) were made and pinned to YEPD plates buffered to the indicated pH. The growth assay shown is representative of two independent experiments.
FIGURE 5:
FIGURE 5:
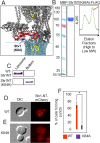
Stv1-NT requires Lys-84 (K84) to bind to PI(4)P. (A) Model of the yeast V1–Vo interface based on PDB 3J9T, with Stv1NT substituted for Vph1NT. (Note that Vph1CT was not modeled in 3J9T.) V1 subunits are shown in gray; Vo subunits are shown in cyan. The Stv1NT homology model shown in red was based on Vph1NT in PDB 3J9T. Stv1(K84) is shown as a space-filling model in bright blue, and W83 and Y85 side chains are also colored blue. (B) Coomassie-stained SDS–PAGE of expressed and purified MBP-Stv1NT(K84A)-FLAG (top). Elution pattern of MBP-Stv1NT(K84A)-FLAG from a Sephadex S200 gel-filtration column (bottom). The black arrow indicates elution of high to low molecular weight protein. The monomer fraction used for liposome flotation assay is indicated by an orange arrow. (C) Western blot of fraction 3 (liposome-containing fraction; Figure 2) and fraction 6 (bottom fraction; Figure 2) from flotation of wild-type MBP-Stv1NT-FLAG and MBP-Stv1NT(K84A)-FLAG with PI(4)P-containing liposomes in a liposome flotation assay. (D, E) Localization of Stv1NT-mCherry in cells expressing wild-type Stv1NT-mCherry (D) or Stv1NT(K84A)-mCherry (E). (F) Histogram showing the percentage of cells localizing Stv1NT-mCherry to puncta in cells expressing wild-type Stv1NT-mCherry (orange) or Stv1NT(K84A)-mCherry (purple). Mean (%) ± range from two experiments is presented (p < 0.05). In these two experiments, 77 and 29 cells with wild-type Stv1NT were counted and 188 and 69 mutant cells with mutant Stv1NT were counted.
FIGURE 6:
FIGURE 6:
K84A mutation in Stv1FL causes partial mislocalization of Stv1FL-GFP and impairs function of V-ATPases bearing Stv1. (A) Localization of wild-type Stv1FL-GFP in yeast cells stained with vacuolar dye FM 4-64 (representative of n = 410). (B) Localization of Stv1FL(K84A)-GFP in yeast cells stained with FM 4-64 (n = 204). (C) Histogram representing mean percentage ± SEM of cells with Stv1FL-GFP (WT or K84A) localized to the vacuole (p < 0.0005). (D) Serial-dilution growth assay of congenic WT, vma2∆ (representing a total loss of V-ATPase function), vph1Δ, vph1stv1(K84A), and vph1Δ 2µ-STV1 (overexpressing Stv1) cells on YEPD, pH 5 (left), YEPD + 4 mM Zn2+ (middle), and YEPD, pH 7.5 (right). The growth assay shown is representative of two independent experiments.
FIGURE 7:
FIGURE 7:
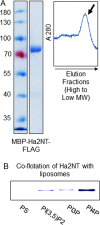
The N-terminal domain of human Golgi/endosomal Vo a-subunit isoform, Hu a2, interacts with PI(4)P in vitro. (A) Expression and purification of human a2NT (Hu a2NT) as MBP-Hu a2NT-FLAG from E. coli. Coomassie-stained SDS–PAGE with molecular mass markers (left). S200 elution pattern of MBP-Hu a2NT-FLAG (right). Arrow indicates monomer fraction used for liposome flotation assay. (B) Immunoblot of MBP-Hu a2NT-FLAG protein from the liposome-containing fraction obtained after flotation of equal amounts of protein with liposomes with the same lipid content, except for 5% of PS, PI(3)P, PI(3,5)P2, or PI(4)P, as indicated. Protein was precipitated from each fraction, separated by SDS–PAGE, and detected with anti-FLAG antibody as described in Figure 2.

Similar articles

Cited by

References

    1. Audhya A, Emr SD. Stt4 PI 4-kinase localizes to the plasma membrane and functions in the Pkc1-mediated MAP kinase cascade. Dev Cell. 2002;2:593–605. - PubMed
    1. Audhya A, Foti M, Emr SD. Distinct roles for the yeast phosphatidylinositol 4-kinases, Stt4p and Pik1p, in secretion, cell growth, and organelle membrane dynamics. Mol Biol Cell. 2000;11:2673–2689. - PMC - PubMed
    1. Bagh MB, Peng S, Chandra G, Zhang Z, Singh SP, Pattabiraman N, Liu A, Mukherjee AB. Misrouting of v-ATPase subunit V0a1 dysregulates lysosomal acidification in a neurodegenerative lysosomal storage disease model. Nat Commun. 2017;8:14612. - PMC - PubMed
    1. Balla T. Phosphoinositides: tiny lipids with giant impact on cell regulation. Physiol Rev. 2013;93:1019–1137. - PMC - PubMed
    1. Baskaran S, Ragusa MJ, Boura E, Hurley JH. Two-site recognition of phosphatidylinositol 3-phosphate by PROPPINs in autophagy. Mol Cell. 2012;47:339–348. - PMC - PubMed

MeSH terms

Substances