. 2017 Aug 1;114(31):8175-8180.
doi: 10.1073/pnas.1703604114. Epub 2017 Jul 18.

Catalysis and chemical mechanisms of calcite dissolution in seawater

Affiliations

Catalysis and chemical mechanisms of calcite dissolution in seawater

Adam V Subhas et al. Proc Natl Acad Sci U S A. .

Abstract

Near-equilibrium calcite dissolution in seawater contributes significantly to the regulation of atmospheric [Formula: see text] on 1,000-y timescales. Despite many studies on far-from-equilibrium dissolution, little is known about the detailed mechanisms responsible for calcite dissolution in seawater. In this paper, we dissolve 13C-labeled calcites in natural seawater. We show that the time-evolving enrichment of [Formula: see text] in solution is a direct measure of both dissolution and precipitation reactions across a large range of saturation states. Secondary Ion Mass Spectrometer profiles into the 13C-labeled solids confirm the presence of precipitated material even in undersaturated conditions. The close balance of precipitation and dissolution near equilibrium can alter the chemical composition of calcite deeper than one monolayer into the crystal. This balance of dissolution-precipitation shifts significantly toward a dissolution-dominated mechanism below about [Formula: see text] Finally, we show that the enzyme carbonic anhydrase (CA) increases the dissolution rate across all saturation states, and the effect is most pronounced close to equilibrium. This finding suggests that the rate of hydration of [Formula: see text] is a rate-limiting step for calcite dissolution in seawater. We then interpret our dissolution data in a framework that incorporates both solution chemistry and geometric constraints on the calcite solid. Near equilibrium, this framework demonstrates a lowered free energy barrier at the solid-solution interface in the presence of CA. This framework also indicates a significant change in dissolution mechanism at [Formula: see text], which we interpret as the onset of homogeneous etch pit nucleation.

Keywords: catalysis; isotope geochemistry; mineral dissolution; oceanography.


Conflict of interest statement

The authors declare no conflict of interest.

Figures
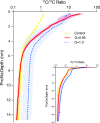
Fig. 1.
Fig. 1.
Vertical logarithmic C12/13C SIMS profiles of reacted calcite grains under three different experimental conditions. Solid lines are the mean isotope ratio of all profiles collected under each experimental condition. Shaded areas are the SD of all profiles collected under each experimental condition. In the first 15 nm of these profiles, Ω  = 0.95 profiles (solid red) transition from a supersaturated (dotted blue) composition to an unreacted (dashed yellow) composition. This C12 enrichment demonstrates that seawater carbon has incorporated into the calcite solid in undersaturated conditions. (Inset) SIMS entire profile, with experiment ratios converging with the unreacted control run at depth. All curves are depth-corrected for the thickness of gold coating. Note that the x axis is flipped relative to the convention of plotting a C13/12C ratio.
Fig. 2.
Fig. 2.
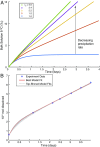
Results of the dissolution–precipitation model (SI Appendix, Fig. S3 and Eqs. S2S4). (A) Model output of bulk solution δ13C under our experimental conditions, assuming a reactive calcite layer thickness of five monolayers. Decreasing the precipitation rate (increasing rbf; see Measuring and Modeling Dissolution–Precipitation in the Solution for details) increases the net dissolution rate and decreases curvature. (B) Model–data comparison for a dissolution experiment conducted at Ω= 0.87. The red curve is the absolute best-fit kdiss and rfb over the entire parameter search space; the gray curves are the next 15 best fits.
Fig. 3.
Fig. 3.
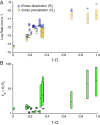
Results of the dissolution–precipitation model. (A) Each net dissolution rate is represented by a pair of blue (dissolution) and yellow (precipitation) gross rates. Lines in the boxes are the median of the best fits of Rf; box boundaries are the 25th and 75th percentile values for Rf that best fit the experimental moles dissolved versus time data. Gross precipitation rates Rb are the median Rf divided by the median rfb(=Rf/Rb) of the best fits to the experimental data; box boundaries are the 25th and 75th percentile values for Rb. Overall, dissolution and precipitation rates are very close to each other, leading to a net dissolution rate that is the difference between two large gross fluxes. The precipitation rate variance increases (larger yellow box size) after 1Ω 0.3. (B) Box plot of the best-fitting rfb values for the all experiments without CA. A significant jump in rfb is evident after 1Ω 0.3 in both the absolute value of rfb and the range of acceptable values.
Fig. 4.
Fig. 4.
The relationship between saturation state, carbonic anhydrase concentration, and calcite dissolution rate in seawater. Semilog plot of dissolution rate versus undersaturation (1 – Ω), including freshwater data from ref. . The linear–linear Inset at bottom right shows the far-from-equilibrium dissolution rate increase as a function of carbonic anhydrase. The x axis (1 – Ω) is the same as in the main figure; the y axis (dissolution rate) is in units of 103g·cm2·d1. For clarity, Inset does not show freshwater data.
Fig. 5.
Fig. 5.
Dissolution rate data from Fig. 4 plotted in the framework of Eq. 2. The y axis dissolution rate (Rdiss) is in moles per square meter per second. A top axis of corresponding Ω values is included, and regimes of dissolution with their hypothesized mechanisms are shown. To the right of the kink (closer to equilibrium), note the decreasing slope with increasing [CA]. Freshwater data are included for comparison. Linear fits to the data in this framework are presented in Table 1, along with an estimate of the interfacial surface energy α. The kink in these data represents a change in dissolution mechanism from defect-only nucleated dissolution near equilibrium to homogeneous nucleation far from equilibrium at a kink point around Ω= 0.7.

References

    1. Feely RA. Impact of anthropogenic CO2 on the CaCO3 system in the oceans. Science. 2004;305:362–366. - PubMed
    1. Archer D, Kheshgi H, Maier-Reimer E. Dynamics of fossil fuel CO2 neutralization by marine CaCO3. Global Biogeochem Cycles. 1998;12:259–276.
    1. Ilyina T, Zeebe RE. Detection and projection of carbonate dissolution in the water column and deep-sea sediments due to ocean acidification. Geophys Res Lett. 2012;39:L06606.
    1. Honjo S, Erez J. Dissolution rates of calcium carbonate in the deep ocean; an in-situ experiment in the North Atlantic Ocean. Earth Planet Sci Lett. 1978;40:287–300.
    1. Walter LM, Morse JW. The dissolution kinetics of shallow marine carbonates in seawater: A laboratory study. Geochim Cosmochim Acta. 1985;49:1503–1513.

LinkOut - more resources