. 2017 Aug 1;114(31):8330-8335.
doi: 10.1073/pnas.1702314114. Epub 2017 Jul 18.

Hitchhiking and epistasis give rise to cohort dynamics in adapting populations

Affiliations

Hitchhiking and epistasis give rise to cohort dynamics in adapting populations

Sean W Buskirk et al. Proc Natl Acad Sci U S A. .

Abstract

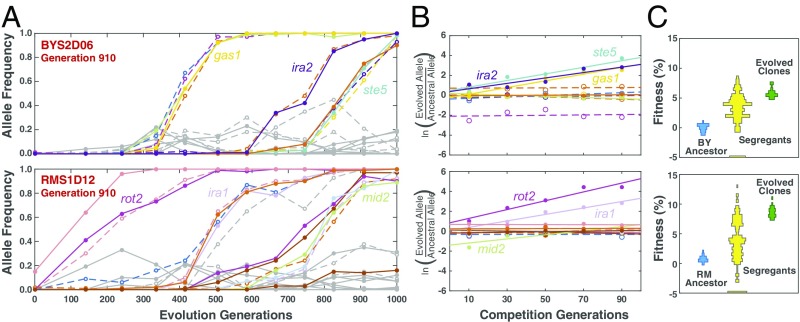
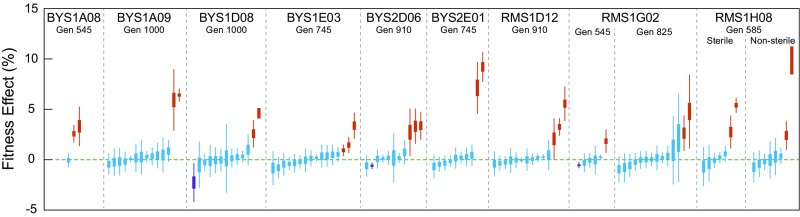
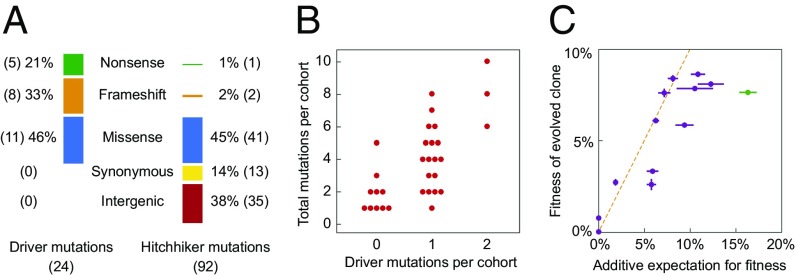
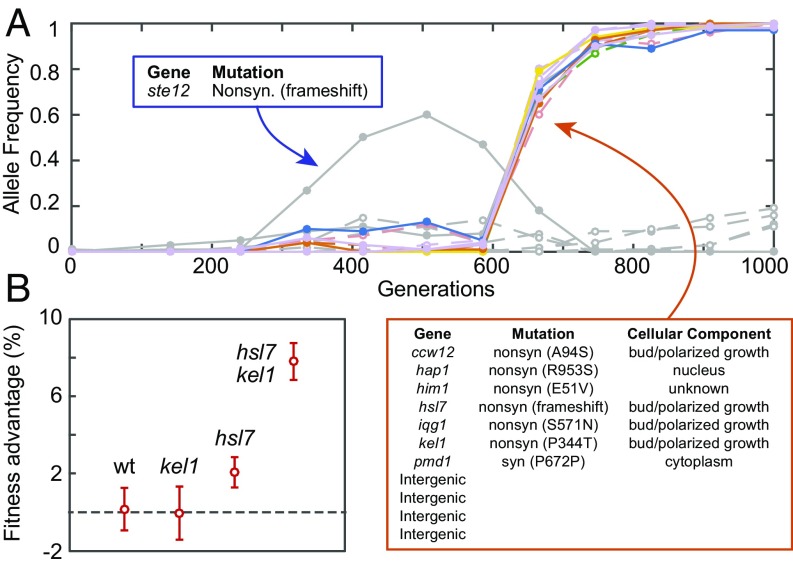
Beneficial mutations are the driving force of adaptive evolution. In asexual populations, the identification of beneficial alleles is confounded by the presence of genetically linked hitchhiker mutations. Parallel evolution experiments enable the recognition of common targets of selection; yet these targets are inherently enriched for genes of large target size and mutations of large effect. A comprehensive study of individual mutations is necessary to create a realistic picture of the evolutionarily significant spectrum of beneficial mutations. Here we use a bulk-segregant approach to identify the beneficial mutations across 11 lineages of experimentally evolved yeast populations. We report that nearly 80% of detected mutations have no discernible effects on fitness and less than 1% are deleterious. We determine the distribution of driver and hitchhiker mutations in 31 mutational cohorts, groups of mutations that arise synchronously from low frequency and track tightly with one another. Surprisingly, we find that one-third of cohorts lack identifiable driver mutations. In addition, we identify intracohort synergistic epistasis between alleles of hsl7 and kel1, which arose together in a low-frequency lineage.

Keywords: cohorts; epistasis; experimental evolution; fitness.


Conflict of interest statement

The authors declare no conflict of interest.

Figures

Fig. 1.
Fig. 1.
Genetic dissection of mutations from two evolved lineages. (A) Genome evolution of each population was previously tracked through time-course, whole-genome sequencing (10). An evolved clone was isolated from each population at defined time points. Each trajectory represents a unique mutation within the isolated clone (colored by chromosome), whereas gray trajectories indicate mutations detected in competing lineages within a population. (B) The background-averaged fitness effect of each evolved mutation is measured through a bulk-segregant fitness assay where a segregant pool is propagated in the selective environment and allele frequencies are tracked by whole-genome time-course sequencing. Fitness is calculated as the linear regression of the natural log ratio of evolved to ancestral allele frequency over time. The color scheme remains consistent between the evolutionary trajectories and bulk-segregant fitness assay. The dynamics of each mutation during the evolution experiment and the bulk-segregant fitness assay are in SI Appendix, Fig. S1 and Dataset S3. (C) Individual clones isolated from a bulk-segregant pool are assayed for fitness against an ancestral reference in a flow cytometry-based competition to determine how fitness segregates in the cross (yellow). The fitness distribution of segregants derived from an ancestral cross (Top, BY, Bottom, RM) provides a baseline fitness in the absence of beneficial alleles. The fitness distribution of the individual segregants is compared with the fitness of the evolved clone from which they arose (green). The fitness for all 192 segregants from each of the 11 lineages is available in Dataset S2.
Fig. 2.
Fig. 2.
Comprehensive quantification of fitness effects. Background-averaged fitness effects for 116 evolved mutations are quantified by the bulk-segregant fitness assay. Mutations are separated by lineage of origin and ordered by mean fitness effect. Fitness effect is represented as the SE of regression (thick lines) and 95% confidence interval (thin lines). Mutations are considered neutral (blue) if the confidence interval encompasses zero. Beneficial (orange) and deleterious (purple) mutations possess confidence intervals that fall completely above or below zero, respectively.
Fig. 3.
Fig. 3.
Mutational signatures, cohort composition, and additivity of fitness effects. (A) Mutations were divided into categories based upon their protein coding effect. The mutational signature of driver mutations is distinct from that of hitchhiker mutations (P < 0.001; Fisher–Freeman–Halton exact test). (B) Hierarchical clustering identified 31 cohorts among the 11 evolved lineages. Cohorts vary in size from 1 to 10 mutations and contain between zero and two drivers (SI Appendix, Fig. S3). We observe a positive relationship between the number of drivers within a cohort and cohort size (ρ = 0.70; Pearson correlation). (C) Fitness of all 11 evolved clones correlates with the sum of the fitness effects of their underlying evolved mutations, as quantified through the bulk-segregant fitness assay. Vertical error bars reflect the SE between replicate competitions of a common clone, and horizontal error bars reflect the propagation of error corresponding to the summation of individual background-averaged fitness effects. Deviation from the dashed line indicates nonadditive genetic interactions. The BYS2E01-745 clone (green) deviates furthest from the expectation.
Fig. 4.
Fig. 4.
Adaptation mechanisms include rare mutations and epistatic interactions. (A) Evolutionary dynamics of population BYS2E01 as tracked through whole-genome time-course sequencing (10). A beneficial ste12 mutation (gray) was outcompeted by an 11-member cohort (colored) that is enriched for mutations in genes whose protein products localize to the cellular bud and site of polarized growth. (B) Bulk-segregant individuals from the BYS2E01-745 cross were genotyped and assayed for fitness, producing a genotype-to-phenotype map. Two evolved alleles, hsl7 and kel1, are associated with fitness gain. Shown are the average fitness and SD of segregants when parsed by HSL7 and KEL1 alleles. The kel1 mutation confers a benefit only in the hsl7 background, and the fitness advantage of the hsl7 kel1 double mutant is greater than the sum of the hsl7 and kel1 single mutants.

References

    1. Payen C, et al. High-throughput identification of adaptive mutations in experimentally evolved yeast populations. PLoS Genet. 2016;12:e1006339. - PMC - PubMed
    1. Venkataram S, et al. Development of a comprehensive genotype-to-fitness map of adaptation-driving mutations in yeast. Cell. 2016;166:1585–1596. - PMC - PubMed
    1. Atwood KC, Schneider LK, Ryan FJ. Periodic selection in Escherichia coli. Proc Natl Acad Sci USA. 1951;37:146–155. - PMC - PubMed
    1. Paquin C, Adams J. Frequency of fixation of adaptive mutations is higher in evolving diploid than haploid yeast populations. Nature. 1983;302:495–500. - PubMed
    1. Bryson V, Szybalski W. Microbial selection. Science. 1952;116:45–51. - PubMed