. 2017 Aug 8;114(32):8532-8537.
doi: 10.1073/pnas.1707281114. Epub 2017 Jul 18.

Conceptual framework of the eco-physiological phases of insect diapause development justified by transcriptomic profiling

Affiliations

Conceptual framework of the eco-physiological phases of insect diapause development justified by transcriptomic profiling

Vladimír Koštál et al. Proc Natl Acad Sci U S A. .

Abstract

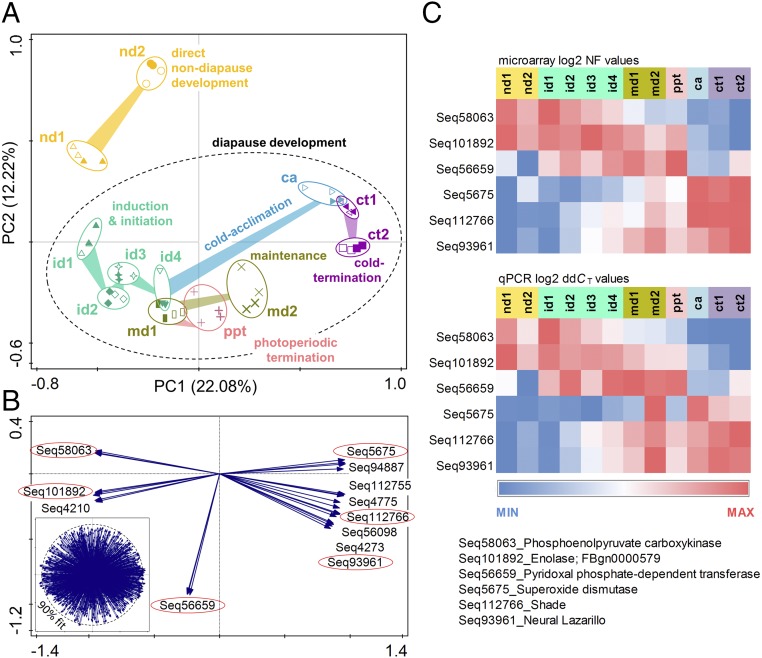
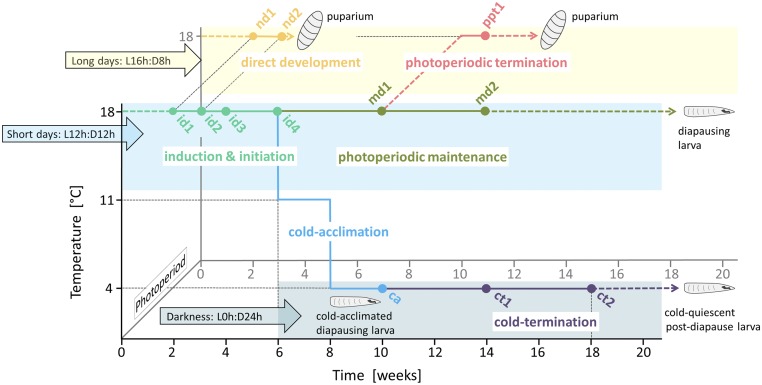
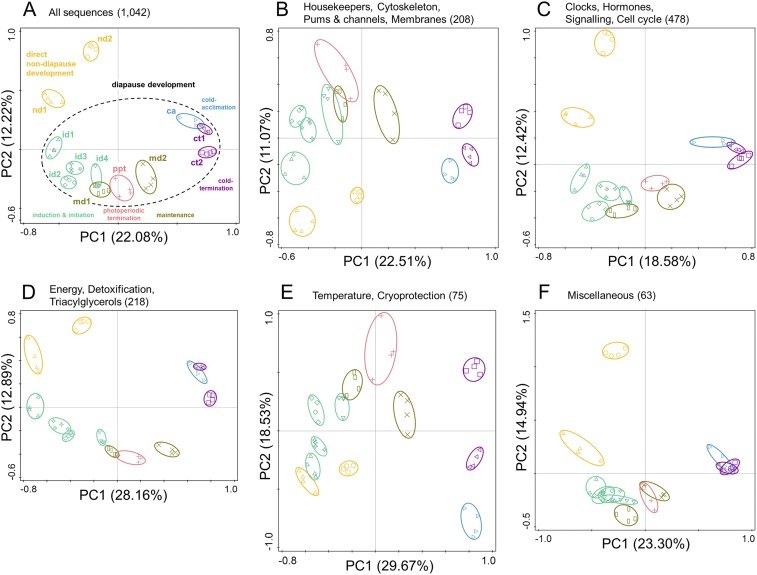
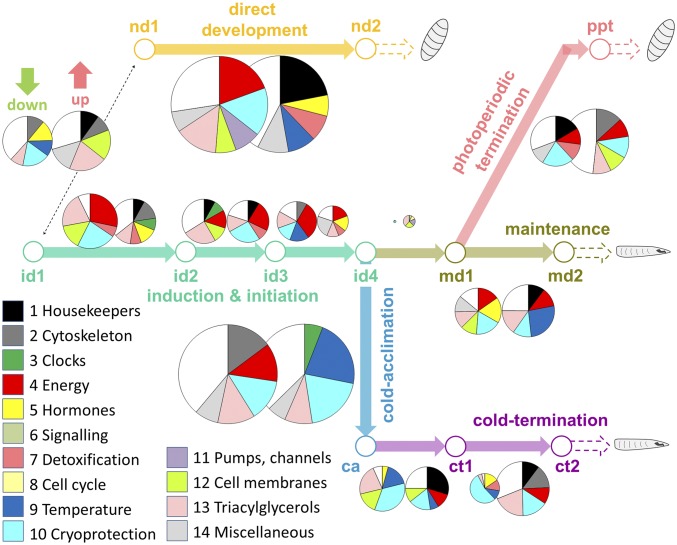
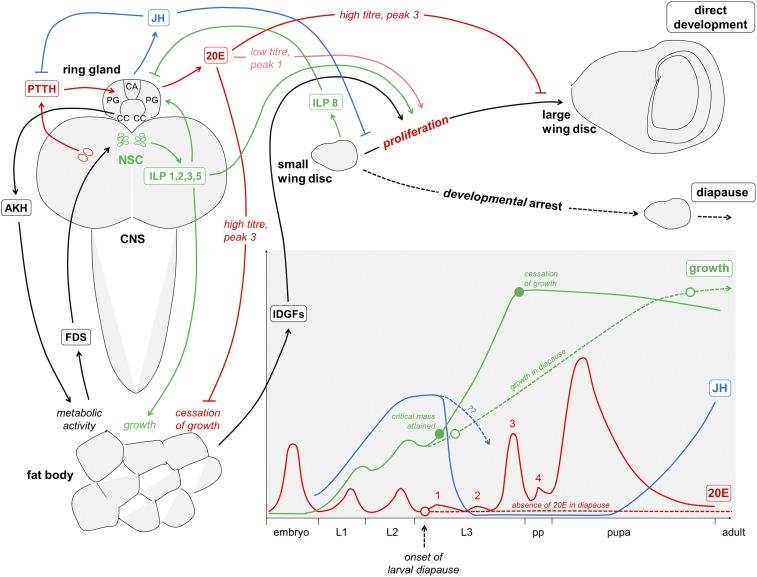
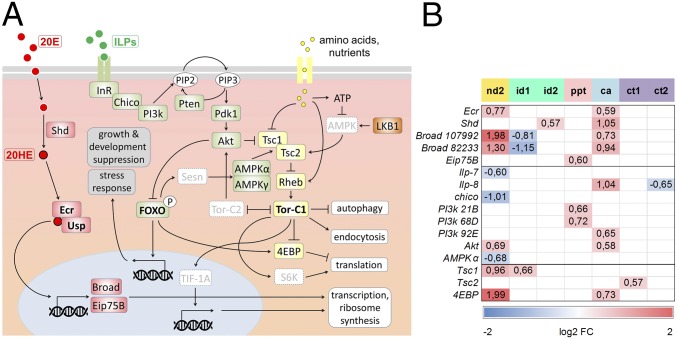
Insects often overcome unfavorable seasons in a hormonally regulated state of diapause during which their activity ceases, development is arrested, metabolic rate is suppressed, and tolerance of environmental stress is bolstered. Diapausing insects pass through a stereotypic succession of eco-physiological phases termed "diapause development." The phasing is varied in the literature, and the whole concept is sometimes criticized as being too artificial. Here we present the results of transcriptional profiling using custom microarrays representing 1,042 genes in the drosophilid fly, Chymomyza costata Fully grown, third-instar larvae programmed for diapause by a photoperiodic (short-day) signal were assayed as they traversed the diapause developmental program. When analyzing the gradual dynamics in the transcriptomic profile, we could readily distinguish distinct diapause developmental phases associated with induction/initiation, maintenance, cold acclimation, and termination by cold or by photoperiodic signal. Accordingly, each phase is characterized by a specific pattern of gene expression, supporting the physiological relevance of the concept of diapause phasing. Further, we have dissected in greater detail the changes in transcript levels of elements of several signaling pathways considered critical for diapause regulation. The phase of diapause termination is associated with enhanced transcript levels in several positive elements stimulating direct development (the 20-hydroxyecdysone pathway: Ecr, Shd, Broad; the Wnt pathway: basket, c-jun) that are countered by up-regulation in some negative elements (the insulin-signaling pathway: Ilp8, PI3k, Akt; the target of rapamycin pathway: Tsc2 and 4EBP; the Wnt pathway: shaggy). We speculate such up-regulations may represent the early steps linked to termination of diapause programming.

Keywords: development; diapause; insects; microarrays; transcriptomics.


Conflict of interest statement

The authors declare no conflict of interest.

Figures

Fig. 1.
Fig. 1.
Gradual change in transcriptional profiles associated with direct and diapause development in third-instar C. costata larvae. (A) Results of PCA analysis exhibiting a clear separation of treatment clusters representing direct nondiapause development (nd1, nd2) and diapause development (id1, id2, id3, id4, md1, md2, ppt, ca, ct1, and ct2). The ellipses were arbitrarily drawn around replicated arrays to help resolution. All treatments had four replicates (three biological replicates plus one technical replicate; solid symbols are used to highlight two technical replicates of one entire microarray). For further explanations, see text, Fig. S1, and Table S1. (B) Eigenvectors are shown for sequences that best fit the PCA model (eigenvector loading >90%). Red ellipses highlight six target sequences selected for validation of microarray analysis by RT-qPCR. The Inset shows the distribution and 90% cutoff circle for all 3,126 eigenvectors (1,042 sequences, each represented in triplicate on our custom microarray). (C) Validation of microarray results using RT-qPCR. (Upper) The heat map shows the log2-normalized fluorescence value (NF) of the microarray spot signals of six target sequences. (Lower) The heat map shows log2 relative mRNA abundance (ddCT, mean of five references per target sequence) in RT-qPCR analysis. The blue–red color scale displays a span between the minimum and maximum values in each single row of the heat map.
Fig. S1.
Fig. S1.
The experimental design used to sample the third-instar larvae of C. costata for analysis of gradual changes in their transcriptomic profile during direct and diapause development. Each point represents a sample/treatment (for more details, see SI Text and Table S1). Larvae undergo direct development to puparium under long days and a temperature of 18 °C (nd1, nd2). Larval diapause is induced and initiated under short days and a temperature of 18 °C (id1, id2, id3, id4). Diapause can be maintained (md1, md2) until all larvae die at short days and temperature of 18 °C. Alternatively, diapause can be terminated by exposure to long days and temperature of 18 °C (ppt) or by exposure to low temperatures and constant darkness (ct1, ct2). Low temperatures also trigger cold acclimation (ca).
Fig. S2.
Fig. S2.
Results of additional PCA analyses of transcriptional profiles in larvae of C. costata performed with five different subsets of arrayed sequences. (A) The results of PCA analysis using all 1,042 array sequences (these are the results presented in Fig. 2A and are shown here for comparison). (B–F) The results of PCA analyses using subsets of arrayed sequences. (B) Functional classes: housekeepers, cytoskeleton, pumps and channels, membranes (208 sequences in total). (C) Functional classes: clocks, hormones, signalling, cell cycle (208 sequences in total). (D) Functional classes: energy, detoxification, triacylglycerols (218 sequences in total). (E) Functional classes: temperature, cryoprotection (75 sequences in total). (F) Miscellaneous (63 sequences in total).
Fig. 2.
Fig. 2.
Separation of the different phases of diapause development in C. costata larvae according to gradual changes in their transcriptional profile. The pie charts indicate quantitative (shown by the relative size of the pie) and qualitative (colors of segments) aspects of the gradual change (down-regulation, left pie; up-regulation, right pie) in the transcriptomic profile during the development of third-instar larva under direct development or diapause-promoting conditions. The size of each pie is directly proportional to the percentage of DE sequences detected (of a total 1,042 arrayed sequences) for the respective treatment comparison (e.g., nd2 vs. nd1). The color of each segment codes for a gene-functional category (see key). Up to five (or six) gene-functional categories with the highest percentage of DE sequences are shown in a specific pie. For more details, see text and Dataset S1.
Fig. S3.
Fig. S3.
Hormonal pathways involved in the regulation of growth and development in D. melanogaster (solid lines) and some alterations linked to larval diapause in C. costata (dashed lines). The graph in lower right corner represents growth (solid green line) and the developmental hormone fluxes (JH, juvenile hormone, solid blue line; and 20E, solid red line) in the hemolymph of D. melanogaster (according to refs. and 76). Larval molts are driven by pulses of circulating 20E, whereas larval (juvenile) character is maintained by high titer of JH. During the early third larval instar (L3) of D. melanogaster ontogeny, metamorphosis to the pupal stage is triggered by the suppression of JH production linked to the attainment of critical mass and, concomitantly, by a first small pulse of 20E (peak 1), which likely stimulates rapid cell proliferation in imaginal discs (77, 78). This early 20E peak 1 is suppressed in C. costata under short days; this suppression might be considered an event linked to the onset of larval diapause (25). Direct development to pupa then is driven, likely similarly in both fly species, by a succession of three 20E pulses linked to wandering (peak 2), pupariation (peak 3), and pupation (peak 4). High titer of 20E during peak 3 suppresses proliferation in imaginal discs and also causes cessation of feeding and growth in peripheral tissues (66). All 20E peaks (1–4) are probably absent in diapause-inducing/initiating larvae of C. costata reared under short days (dashed red line) (25). Although their development is arrested, diapause-initiating C. costata larvae continue to grow until the age of ∼6 wk when the final size of the diapausing larva is attained (dashed green line) (26). Fly larvae produce 20E in their prothoracic glands (PG) under the control of prothoracicotropic hormone (PTTH) secreted by neurosecretory cells of the brain (79, 80). JH is produced in the corpus allatum gland (CA) (81), and adipokinetic hormone (AKH), which stimulates fat body metabolic activity, is secreted from the corpora cardiaca (CC) (82). The three glands (PG, CA, and CC) are integrated into a single ring gland in fly larvae (80). ILPs are produced in a set of neurosecretory cells (NSC) of the larval brain (83). The ILPs activate proliferation and growth in peripheral tissues (such as the fat body) and imaginal discs (such as the wing disc) (43, 47, 67, 75) via pathways described in more detail in Fig. 3A. In addition, insulin signaling positively influences 20E synthesis in the PG (84, 85), and a specific insulin-like peptide (ILP8) is secreted from small imaginal discs that have not yet completed their growth program. ILP8 inhibits ecdysone production and pupariation, thereby coupling tissue growth with developmental timing (–88). The growing fat body produces poorly characterized feedback signals (FDS), which act on brain NSC to control the secretion of ILPs (88). The fat body also produces imaginal disc growth factors (IDGFs), which cooperate with insulin to stimulate cell proliferation in imaginal discs (89). Wing discs of diapause-inducing/initiating third instars of C. costata do not receive stimulatory 20E signal (see above). It remains unclear whether and how the other stimulatory axes (IS and IDGF) are changed in diapausing larvae; nevertheless, the cell-division cycle in imaginal discs is inhibited (and/or is not stimulated), and consequently the discs stop growing (54). This cessation of growth is synonymous with the developmental arrest, i.e., diapause (dashed black line). It is known that the IS and 20HE pathways interact functionally, although the mechanistic details of this crosstalk are not sufficiently understood (90). For instance, the synthesis of ecdysone in the fruit fly's PG is positively regulated by insulin (84, 85), which in turn may couple the availability of nutrients (TOR pathway) to developmental timing regulated by ecdysone (75). Similarly, insulin receptors are present in the fruit fly's CA glands, which regulate JH synthesis (91); moreover suppression of insulin signaling correlates with low JH production (92). In summary, the growth of D. melanogaster and probably also C. costata larvae is supported by crosstalk between developmental hormones and active IS and TOR pathways that together promote the growth of tissues and the proliferation in the imaginal discs until the final appropriate size is reached and the program of metamorphosis is initiated (66).
Fig. 3.
Fig. 3.
Cooperation of 20HE, IS, and TOR signaling pathways in the regulation of fly larva growth and development. (A) The elements of signaling pathways recognized in D. melanogaster larvae and their putative homologs (highlighted in colored rectangles) represented on our C. costata custom microarray. The 20HE signaling cascade is in red, forkhead box O (FOXO) pathway components are in green, TOR pathway components are in yellow, and the serine-threonine kinase LKB1-activated pathway is shown in brown. White rectangles with gray font indicate elements not represented on our custom microarray. (B) Results of microarray transcriptional analysis in C. costata. Only results in which statistically significant up- or down-regulations of signaling pathway components were observed are shown (the numbers in each box are log2-transformed average FCs in expression). For more details, see SI Results: Extended Discussion Related to Fig. 3 and Dataset S1, Excel sheet: 20HE, IS, TOR.
Fig. S4.
Fig. S4.
An example of a C. costata custom microarray. The PrintScreen from ScanArray Express v. 4.0.0.0004 software (Perkin-Elmer) used to analyze the hybridized microarrays that were previously scanned using a ScanArray Gx Microarray Scanner (PerkinElmer) at a resolution of 5 µm. The microarray has 34 fields, each containing 110 spots (3,740 spots in total). The 3,126 spots are occupied by DNA probes (3 × 1,042 sequences, each printed in technical triplicate). Further details on microarray content and arrangement (including the GAL file) are available from the authors upon request.

Similar articles

Cited by

References

    1. Lees AD. The physiology and biochemistry of diapause. Annu Rev Entomol. 1956;1:1–16.
    1. Hodek I. Role of environmental factors and endogenous mechanisms in the seasonality of reproduction in insects diapausing as adults. In: Brown VK, Hodek I, editors. Diapause and Life Cycle Strategies in Insects. Dr W Junk Publishers; The Hague: 1983. pp. 9–33.
    1. Tauber MJ, Tauber CA, Masaki S. Seasonal Adaptations of Insects. Oxford Univ Press; Oxford, UK: 1986. p. 411.
    1. Danks HV. 1987. Insect dormancy: An ecological perspective. Terrestrial Arthropods, Monograph series No. 1 (National Museum of Natural Sciences, Ottawa) p 439.
    1. Saunders DS. In: Insect Clocks. Steel CGH, Vafopoulou X, Lewis RD, editors. Elsevier; Amsterdam: 2002. p. 576.

Publication types

Substances

LinkOut - more resources