. 2017 Jul 18;7(1):5677.
doi: 10.1038/s41598-017-05888-8.

Distinct Top-down and Bottom-up Brain Connectivity During Visual Perception and Imagery

Affiliations

Distinct Top-down and Bottom-up Brain Connectivity During Visual Perception and Imagery

N Dijkstra et al. Sci Rep. .

Abstract

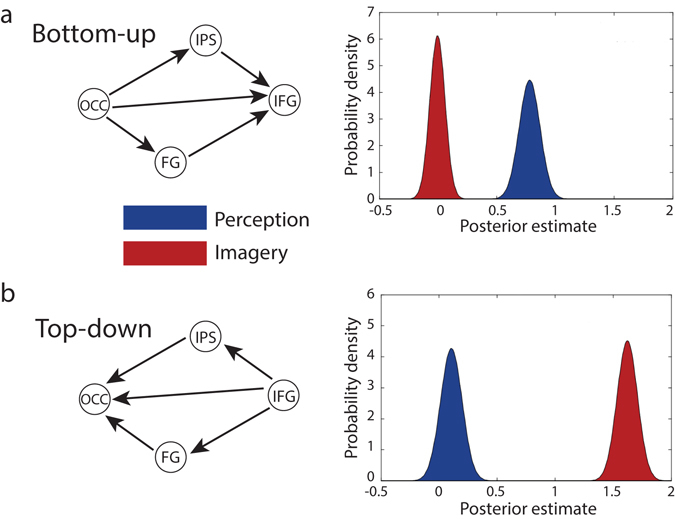
Research suggests that perception and imagination engage neuronal representations in the same visual areas. However, the underlying mechanisms that differentiate sensory perception from imagination remain unclear. Here, we examine the directed coupling (effective connectivity) between fronto-parietal and visual areas during perception and imagery. We found an increase in bottom-up coupling during perception relative to baseline and an increase in top-down coupling during both perception and imagery, with a much stronger increase during imagery. Modulation of the coupling from frontal to early visual areas was common to both perception and imagery. Furthermore, we show that the experienced vividness during imagery was selectively associated with increases in top-down connectivity to early visual cortex. These results highlight the importance of top-down processing in internally as well as externally driven visual experience.


Conflict of interest statement

The authors declare that they have no competing interests.

Figures

Figure 1
Figure 1
Experimental paradigm. (a) Participants were shown two objects for 2 seconds each with a random inter stimulus interval (ISI) lasting between 1 and 3 seconds during which a fixation cross was shown. Next, another fixation cross was shown for 1–3 seconds after which a red cue was presented indicating which of the two objects the participant had to imagine. Subsequently a frame was presented for 3.5 seconds on which the participant had to imagine the cued stimulus. After this they had to rate their experienced imagery vividness on a scale from 1 (not vivid at all) to 4 (very vivid). Each trial was followed by a 4-second baseline period in which there was no perception and no imagery. The apple image can be found at https://commons.wikimedia.org/wiki/File:Red_Apple.jpg, it falls under the CC Attribution 2.0 license (https://creativecommons.org/licenses/by/2.0/) and functions as a placeholder for the original stimulus which cannot be shown due to copyright limitations. (b) Boxcar regressor for perception used as driving and modulatory input for the DCM. This regressor was on for 2 seconds during the first stimulus presentation, off during the inter-stimulus-interval, and then on again for 2 seconds during the second stimulus presentation. (c) Boxcar regressor for imagery, this regressor was on for 3.5 seconds during the presentation of the imagery frame.
Figure 2
Figure 2
Activated brain areas. Activations shown are significant on the group level (p < 0.05; FWE corrected) with a cluster forming threshold of 50 voxels. (A) Perception versus baseline. (B) Imagery versus baseline. (C) Conjunction between perception and imagery.
Figure 3
Figure 3
Bayesian model reduction for the driving input of imagery. P: perception, I: imagery. The mean of the group level parameter estimates after BMR are shown. The estimated parameters have a multivariate normal distribution, specified by their means (gray bars) and covariance. We transformed the estimated variance of the parameters to 95% confidence intervals, which are displayed as the pink bars. The results show that the driving input during imagery can be best modelled as targeting both IFG and OCC.
Figure 4
Figure 4
Influences on effective connectivity. Connections with solid lines had a posterior probability (Pp) of at least 0.95. The numbers indicate the strength of directed coupling (in Hz), with a minus sign indicating inhibitory influences. The width of the arrows is proportional to the strength of coupling. (a) Locations of the different ROIs for one subject. (b) Parameters of the A matrix which reflects the connectivity during baseline, i.e. in the absence of experimental influences. (c) The effect of perception. (d) The effect of imagery. (e) The effect of vividness.
Figure 5
Figure 5
Top-down versus bottom-up coupling. Posterior densities of (contrasts or mixtures of) parameter estimates of the effect of perception and imagery pooled over bottom-up and top-down connections. (a) Coupling during perception and imagery for bottom-up connections. (b) Coupling for top-down connections.

Similar articles

Cited by

References

    1. Kosslyn SM, Ganis G, Thompson WL. Neural foundations of imagery. Nat. Rev. Neurosci. 2001;2:635–642. doi: 10.1038/35090055. - DOI - PubMed
    1. Lee S-H, Kravitz DJ, Baker CI. Disentangling visual imagery and perception of real-world objects. Neuroimage. 2012;59:4064–73. doi: 10.1016/j.neuroimage.2011.10.055. - DOI - PMC - PubMed
    1. Reddy L, Tsuchiya N, Serre T. Reading the mind’s eye: decoding category information during mental imagery. Neuroimage. 2010;50:818–25. doi: 10.1016/j.neuroimage.2009.11.084. - DOI - PMC - PubMed
    1. Kosslyn SM, Thompson WL. When is early visual cortex activated during visual mental imagery? Psychol. Bull. 2003;129:723–746. doi: 10.1037/0033-2909.129.5.723. - DOI - PubMed
    1. Pearson J, Naselaris T, Holmes EA, Kosslyn SM. Mental imagery: functional mechanisms and clinical applications. Trends Cogn. Sci. 2015;19:590–602. doi: 10.1016/j.tics.2015.08.003. - DOI - PMC - PubMed

Publication types

LinkOut - more resources