. 2017 Jul 18;7(1):5747.
doi: 10.1038/s41598-017-06126-x.

Commensal Gut Microbiota Immunomodulatory Actions in Bone Marrow and Liver have Catabolic Effects on Skeletal Homeostasis in Health

Affiliations

Commensal Gut Microbiota Immunomodulatory Actions in Bone Marrow and Liver have Catabolic Effects on Skeletal Homeostasis in Health

Chad M Novince et al. Sci Rep. .

Abstract

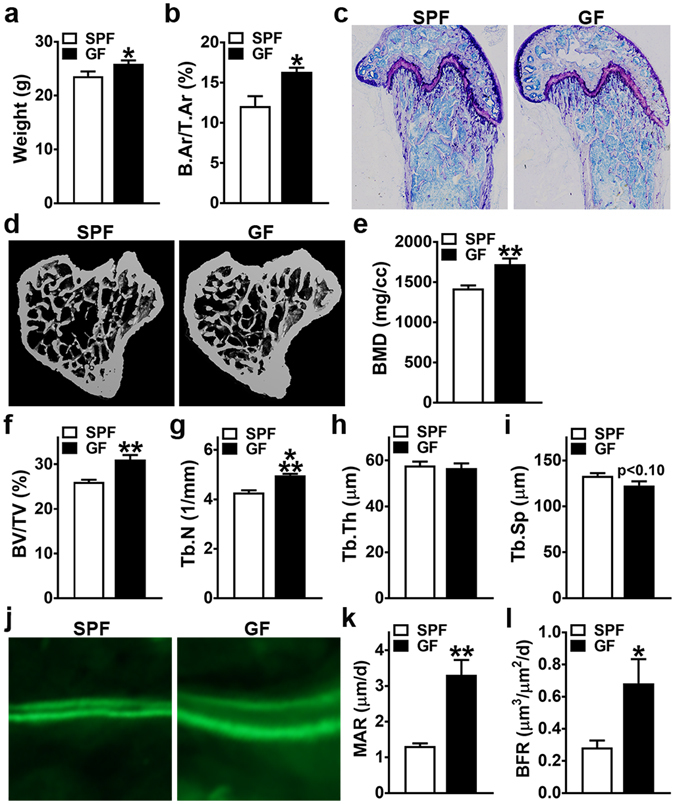
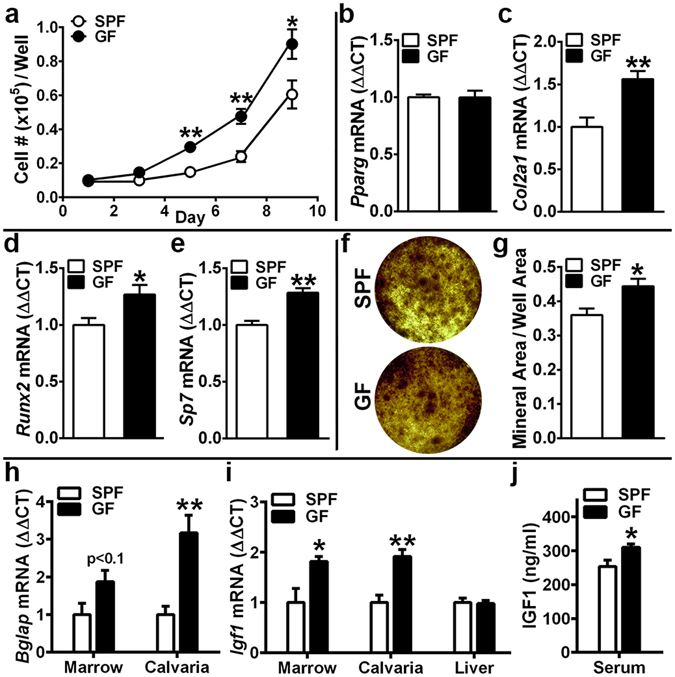
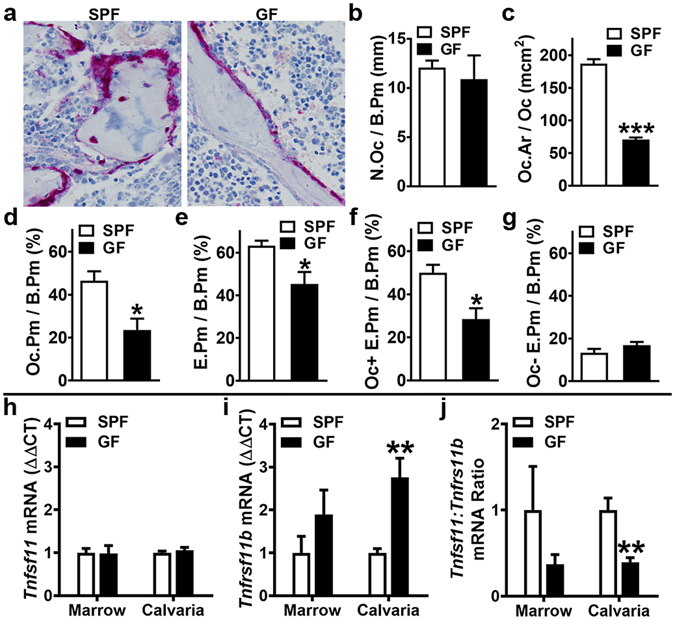
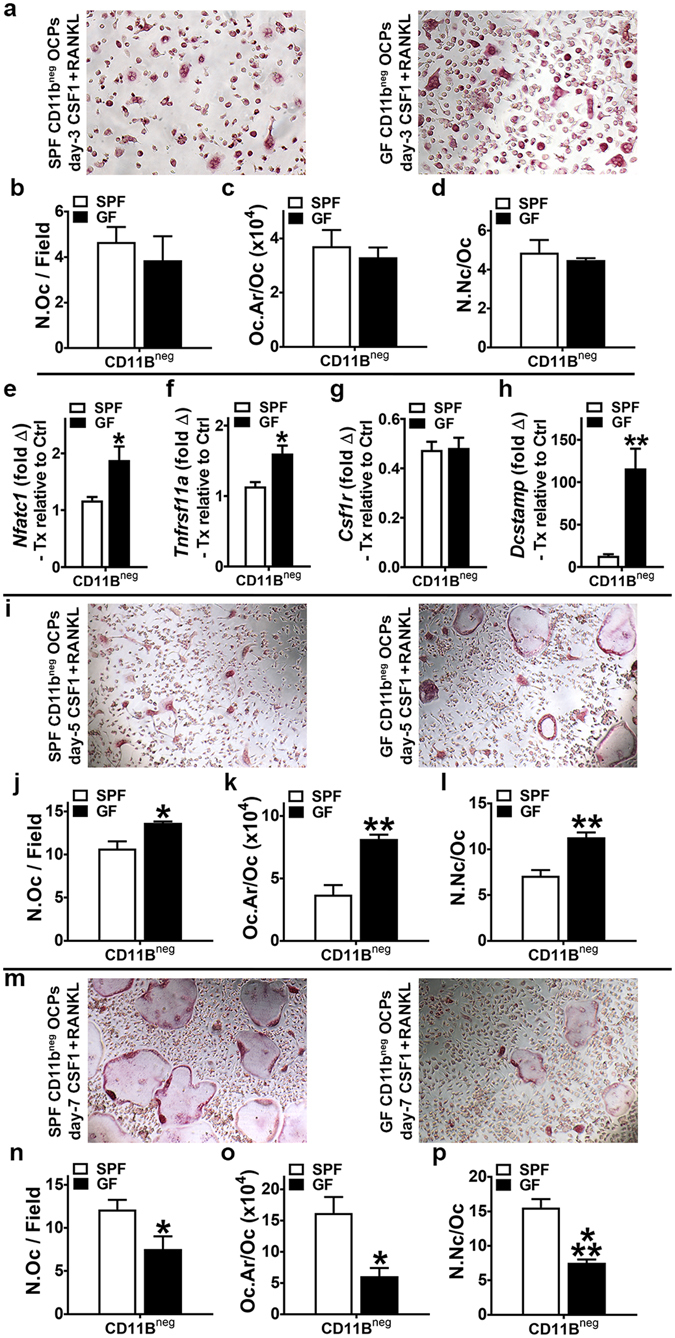
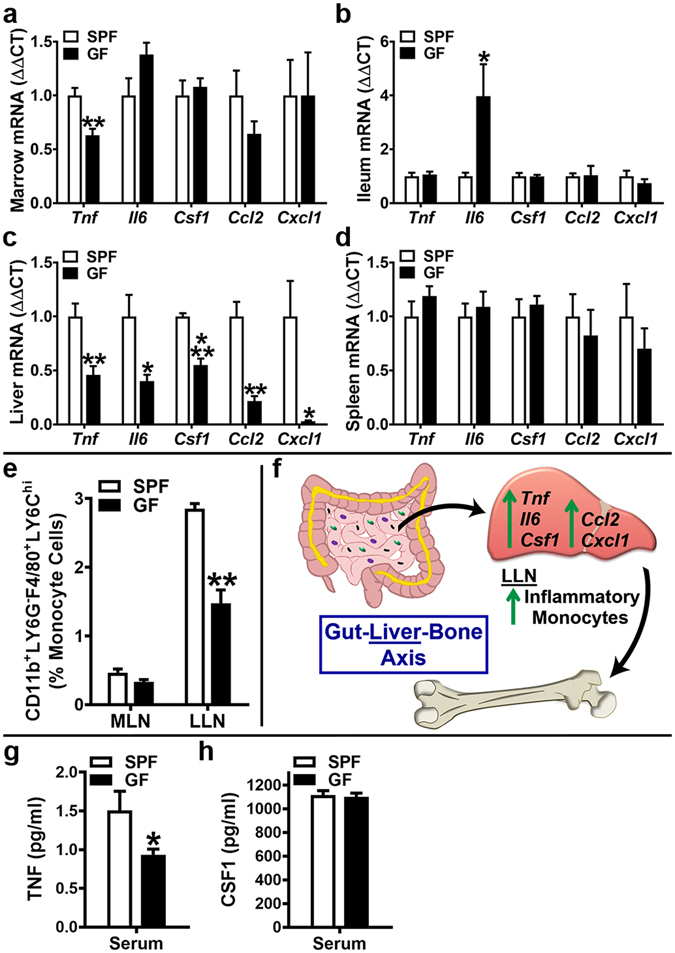
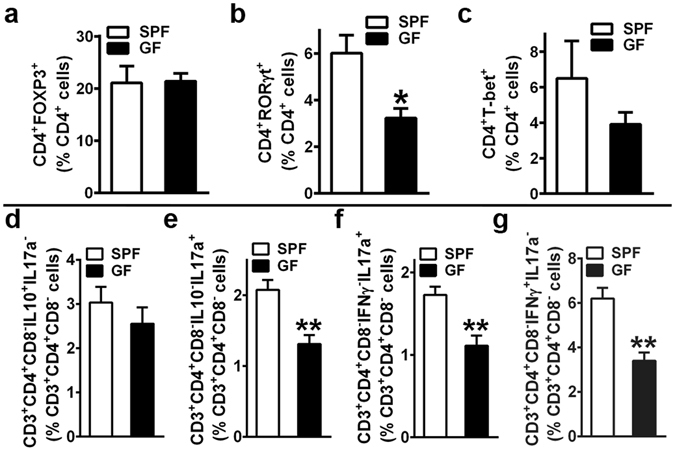
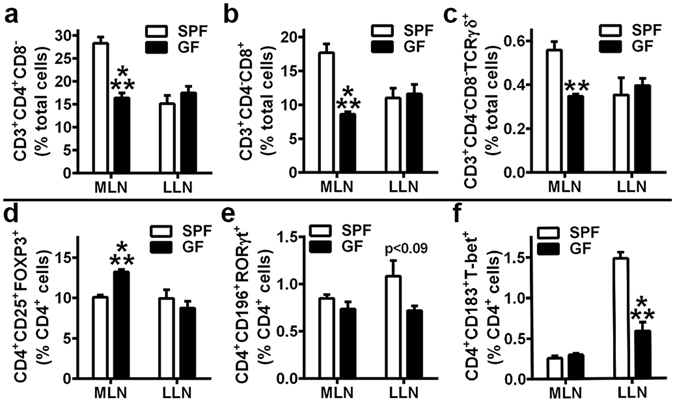
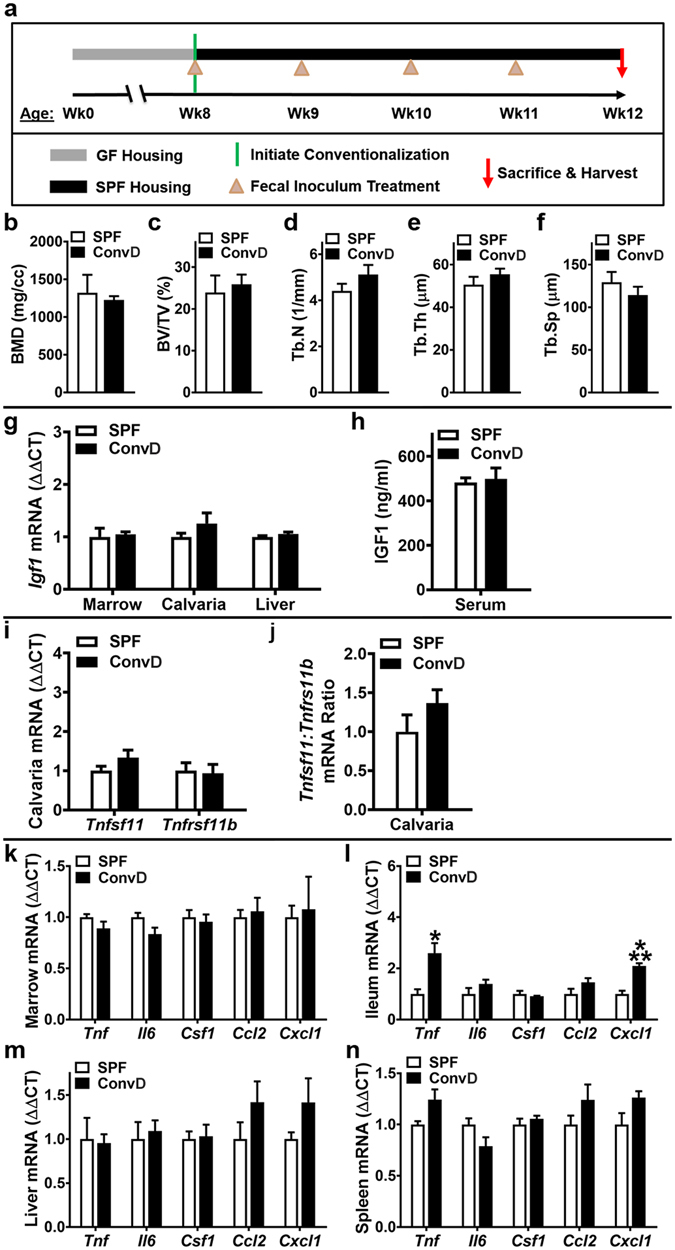
Despite knowledge the gut microbiota regulates bone mass, mechanisms governing the normal gut microbiota's osteoimmunomodulatory effects on skeletal remodeling and homeostasis are unclear in the healthy adult skeleton. Young adult specific-pathogen-free and germ-free mice were used to delineate the commensal microbiota's immunoregulatory effects on osteoblastogenesis, osteoclastogenesis, marrow T-cell hematopoiesis, and extra-skeletal endocrine organ function. We report the commensal microbiota has anti-anabolic effects suppressing osteoblastogenesis and pro-catabolic effects enhancing osteoclastogenesis, which drive bone loss in health. Suppression of Sp7(Osterix) and Igf1 in bone, and serum IGF1, in specific-pathogen-free mice suggest the commensal microbiota's anti-osteoblastic actions are mediated via local disruption of IGF1-signaling. Differences in the RANKL/OPG Axis in vivo, and RANKL-induced maturation of osteoclast-precursors in vitro, indicate the commensal microbiota induces sustained changes in RANKL-mediated osteoclastogenesis. Candidate mechanisms mediating commensal microbiota's pro-osteoclastic actions include altered marrow effector CD4+T-cells and a novel Gut-Liver-Bone Axis. The previously unidentified Gut-Liver-Bone Axis intriguingly implies the normal gut microbiota's osteoimmunomodulatory actions are partly mediated via immunostimulatory effects in the liver. The molecular underpinnings defining commensal gut microbiota immunomodulatory actions on physiologic bone remodeling are highly relevant in advancing the understanding of normal osteoimmunological processes, having implications for the prevention of skeletal deterioration in health and disease.


Conflict of interest statement

The authors declare that they have no competing interests.

Figures

Figure 1
Figure 1
Animal weight and trabecular bone analysis. 11 to 12 week-old male SPF & GF mice were weighed; euthanized; femur harvested for histomorphometric analysis and tibia harvested for micro-CT analysis. (a) Animal weight (n = 12/gp). (b,c) Static histomorphometric analysis of distal femur trabecular bone area (n = 4/gp). (b) B.Ar/T.Ar = bone area. (c) Representative images (100×) of toluidine blue stained distal femur sections. (di) Micro-CT analysis of proximal tibia trabecular bone (n = 4/gp). (d) Representative reconstructed cross-sectional images, extending 360 µm distally from where analysis was initiated. (e) BMD = trabecular bone mineral density. (f) BV/TV = trabecular bone volume fraction. (g) Tb.N = trabecular number. (h) Tb.Th = trabecular thickness. (i) Tb.Sp = trabecular separation. (jl) Dynamic histomorphometric analysis of bone formation indices in distal femur trabecular bone; calcein administered 5 and 2 days prior to sacrifice (n = 4/gp). (j) Representative images of calcein labeled secondary spongiosa (400×). (k) MAR = mineral apposition rate. (l) BFR = bone formation rate. Data reported as mean ± SEM. *p < 0.05 vs. SPF; **p < 0.01 vs. SPF; ***p < 0.001 vs SPF.
Figure 2
Figure 2
Osteoblastogenesis investigations. (ag) Bone marrow stromal cell (BMSC) in vitro osteoblastogenesis assays. 11 week-old male SPF & GF mice were euthanized; bone marrow harvested; BMSCs isolated for in vitro assays. (a) Cell expansion assay (n = 4/gp): cell numbers over time in culture. (be) BMSC differentiation potential assay (untreated day-4 pre-confluent cultures were harvested for qRT-PCR analysis) to assess intrinsic differentiation potential (n = 4/gp). (b) Pparg mRNA assessed as a marker of adipogenic potential. (c) Col2a1 mRNA assessed as a marker of chondrogenic potential. (d) Runx2 and (e) Sp7(Osterix) mRNA assessed as markers of osteoblastogenic potential. Relative quantification of mRNA was performed via the comparative C T method (ΔΔCT); Gapdh was utilized as an internal control gene; data expressed as fold difference relative to SPF. (f,g) von Kossa mineralization assay (21 day mineralization treatment) (n = 4/gp). (f) Representative von Kossa stained culture images. (g) Mineralization area per well area. (ag) BMSC assays carried out in duplicate (two technical replicate) cultures; n-values represent biological replicates per group. (hj) Commensal microbiota in vivo regulation of osteoblastogenesis. 11 to 12 week-old male SPF & GF mice were euthanized; tissues were harvested. (h,i) RNA was isolated from marrow (n = 4/gp), calvaria (n = 4/gp), liver (n = 6/gp) for qRT-PCR analysis of candidate osteogenic genes. (h) Bglap(Osteocalcin) mRNA assessed as a marker of mature osteoblast function, and (i) Igf1 mRNA assessed as a critical osteoblastic signaling factor. Relative quantification of mRNA was performed via the comparative C T method (ΔΔCT); Gapdh was utilized as an internal control gene; data expressed as fold difference relative to SPF. (j) Serum was isolated from whole blood (n = 10/gp); ELISA analysis of IGF1 levels. Data reported as mean ± SEM. *p < 0.05 vs. SPF; **p < 0.01 vs. SPF.
Figure 3
Figure 3
Commensal microbiota in vivo regulation of osteoclastogenesis. 12 week-old male SPF & GF mice were euthanized; (ag) femurs harvested for histomorphometric analyses (n = 4/gp), and (hj) bone marrow and calvaria were harvested for gene expression analysis (n = 4/gp). (ag) Histomorphometric analyses of osteoclast cellular endpoints and resorbed bone were performed in the trabecular bone secondary spongiosa of tartrate-resistant acid phosphatase (TRAP) stained distal femur sections; TRAP + cell lining bone with ≥ 3 nuclei designated an osteoclast. (a) Representative images of TRAP-stained secondary spongiosa (400×). (b) N.Oc/B.Pm = osteoclast number per bone perimeter. (c) Oc.Ar/Oc = average osteoclast area. (d) Oc.Pm/B.Pm = osteoclast perimeter per bone perimeter. (e) E.Pm/B.Pm = eroded perimeter per bone perimeter. (f) Oc + E.Pm/B.Pm = osteoclast-positive eroded perimeter per bone perimeter. (g) Oc-E.Pm/B.Pm = osteoclast-negative eroded perimeter per bone perimeter. (hj) qRT-PCR analysis in bone marrow and calvaria to assess alterations in the RANKL/OPG Axis. (h) Tnfsf11(Rankl) mRNA in bone marrow and calvaria. (i) Tnfrsf11b(Opg) mRNA in bone marrow and calvaria. (j) Tnfsf11(Rankl):Tnfrsf11b(Opg) ratio in bone marrow and calvaria. Relative quantification of mRNA was performed via the comparative C T method (ΔΔCT); Gapdh was utilized as an internal control gene; data expressed as fold difference relative to SPF. Data reported as mean ± SEM. *p < 0.05 vs. SPF; **p < 0.01 vs SPF; ***p < 0.001 vs SPF.
Figure 4
Figure 4
Osteoclast-precursor (OCP) differentiation assays. (ap) 11 week-old male SPF & GF mice were euthanized; bone marrow harvested; hematopoietic progenitor cells (HPCs) isolated. Magnetic cell sorting was applied to separate CD11bneg HPCs, which were then stimulated in culture (primed with CSF1) to enrich for CD11bneg osteoclast-precursor (OCP) cells having high osteoclastic potential. CD11bneg OCP cultures were then stimulated with control (CSF1 alone) or treatment (CSF1 & RANKL) media for 3, 5 and 7 days. Cytomorphometric cellular differentiation endpoints were analyzed in TRAP stained CD11bneg OCP cultures at day-3, day-5, and day-7 to evaluate cell level alterations in RANKL-induced osteoclast differentiation; TRAP + cell with > 3 nuclei considered an osteoclast. Gene expression studies were carried out in CD11bneg OCP cultures at day-3 to detect early transcription level alterations in RANKL-stimulated osteoclast differentiation. (ad) Day-3 TRAP stain assay (n = 4/gp). (a) Representative images (200X) of CD11bneg OCP cultures stimulated with treatment (CSF1 & RANKL) media for 3 days. (b) N.Oc/Field = number of osteoclasts per field of view. (c) Oc.Ar/Oc = average osteoclast area. (d) N.Nc/Oc = nuclei number per osteoclast. (eh) Day-3 qRT-PCR gene expression assay (n = 4/gp). (e) Nfatc1 mRNA. (f) Tnfrsf11a mRNA. (g) Csf1r mRNA. (h) Dcstamp mRNA. Relative quantification of mRNA was performed via the comparative C T method (ΔΔCT); Gapdh was utilized as an internal control gene; data expressed as treatment (CSF1 and RANKL) fold change relative to control (CSF1). (il) Day-5 TRAP stain assay (n = 4/gp). (i) Representative images (100×) of CD11bneg OCP cultures stimulated with treatment (CSF1 & RANKL) media for 5 days. (j) N.Oc/Field. (k) Oc.Ar/Oc. (l) N.Nc/Oc. (mp) Day-7 TRAP stain assay (n = 4/gp). (m) Representative images (100×) of CD11bneg OCP cultures stimulated with treatment (CSF1 & RANKL) media for 7 days. (n) N.Oc/Field. (o) Oc.Ar/Oc. (p) N.Nc/Oc. Gene expression assay performed in duplicate (two technical replicate) cultures. TRAP stain assays performed in triplicate (three technical replicate) cultures; three fields of view analyzed per technical replicate culture. n-values represent biological replicates per group. Data reported as mean ± SEM. *p < 0.05 vs. SPF; **p < 0.01 vs. SPF; ***p < 0.001 vs SPF.
Figure 5
Figure 5
Commensal microbiota in vivo regulation of pro-inflammatory cytokines. 11 to 12 week-old male SPF & GF mice were euthanized; tissues harvested for (ad) gene expression assays, (e) flow cytometry assays, and (g,h) ELISA assays. (ad) RNA was isolated from tissues and qRT-PCR analysis was performed in (a) bone marrow (n = 4/gp), (b) ileum (n = 6/gp), (c) liver (n = 6/gp), (d) spleen (n = 4/gp) to assess Tnf, Il6, Csf1, Ccl2, Cxcl1 mRNA. Relative quantification of mRNA was performed via the comparative C T method (ΔΔCT); Gapdh was utilized as an internal control gene; data expressed as fold difference relative to SPF. (e) Mesenteric lymph node (MLN) cells and liver lymph node (LLN) cells were isolated and stained for flow cytometric analysis (n = 4/gp) to assess the frequency of CD11b+LY6G-F4/80+LY6Chi (inflammatory monocyte) cells. Cell percentages are expressed relative to total gated monocyte cells. (f) Schematic of newly identified/proposed Gut-Liver-Bone Axis. (g,h) Serum was isolated from whole blood (n = 9–10/gp); ELISA analysis of (g) TNF levels and (h) CSF1 levels. Data are reported as mean ± SEM. *p < 0.05 vs. SPF; **p < 0.01 vs. SPF; ***p < 0.001 vs. SPF.
Figure 6
Figure 6
Bone marrow effector CD4+ T-cell hematopoiesis. (ac) Marrow Transcription Factor Expression Assays: 12 week-old male SPF & GF mice were euthanized; femoral bone marrow cells were isolated and stained (n = 4/gp) for flow cytometric analysis to assess (a) % CD4+FOXP3+ (TREG) cells, (b) % CD4+RORγt+ (TH17) cells, and (c) % CD4+T-bet+ (TH1) cells. Percentages are expressed relative to CD4+ cells. (dg) Marrow Intracellular Cytokine Expression Assays: 11 week-old gender matched (2 male and 2 female per group) SPF & GF mice were euthanized; femoral whole marrow was plated overnight for cytokine activation (PMA, Ionomycin, Monensin). Cells were isolated and stained (n = 4/gp) for flow cytometric analysis to assess (d) % CD3+CD4+CD8IL10+IL17a (CD4+IL10+) cells, (e) % CD3+CD4+CD8IL10IL17a+ (CD4+IL17a+) cells, (f) % CD3+CD4+CD8IFNγIL17a+ (CD4+IL17a+) cells, and (g) % CD3+CD4+CD8IFNγ+IL17a (CD4+IFNγ+) cells. Percentages are expressed relative to CD3+CD4+CD8 cells. Data are reported as mean ± SEM. *p < 0.05 vs. SPF; **p < 0.01 vs. SPF.
Figure 7
Figure 7
Draining gut and liver lymph node T-cell hematopoiesis. (af) 12 week-old male SPF & GF mice were euthanized; Mesenteric lymph node (MLN) and liver lymph node (LLN) cells were isolated and stained for flow cytometric analysis (n = 4/gp). (a) % CD3+CD4+CD8 (helper) T-cells, (b) % CD3+CD4CD8+ (cytotoxic) T-cells, and (c) % CD3+CD4CD8TCRγδ+ (gamma delta) T-cells are expressed relative to total lymph node cells. (d) % CD4+CD25+FOXP3+ (TREG) cells, (e) % CD4+CD196+RORγt+ (TH17) cells, and (f) % CD4+CD183+T-bet+ (TH1) cells are expressed relative to CD4+ cells. Data are reported as mean ± SEM. **p < 0.01 vs. SPF; ***p < 0.001 vs. SPF.
Figure 8
Figure 8
Conventionalization study: GF mice colonized with SPF mice gut microbiota. (a) Conventionalization study timeline: Conventionalized (ConvD) mice were generated by transferring 8 week-old male GF C57BL/6 littermate mice from sterile isolator housing to ventilated cages in a SPF vivarium. Microbial association was performed via fecal inoculum derived from pooled fresh feces of age matched male SPF C57BL/6 littermate mice, which were housed in the same SPF vivarium. (bn) 12 week-old male SPF & ConvD mice were euthanized; tissues were harvested for analyses. (bf) Trabecular bone analysis: Micro-CT analysis of proximal tibia trabecular bone (n = 4/gp). (b) BMD = trabecular bone mineral density. (c) BV/TV = trabecular bone volume fraction. (d) Tb.N = trabecular number. (e) Tb.Th = trabecular thickness. (f) Tb.Sp = trabecular separation. (gh) In vivo regulation of osteoblastogenesis: (g) RNA was isolated from marrow (n = 4/gp), calvaria (n = 4/gp), liver (n = 4/gp) for qRT-PCR analysis. Igf1 mRNA assessed as a critical osteoblastic signaling factor. Relative quantification of mRNA was performed via the comparative C T method (ΔΔCT); Gapdh was utilized as an internal control gene; data expressed as fold difference relative to SPF. (h) Serum was isolated from whole blood (n = 4/gp); ELISA analysis of IGF1 levels. (ij) In vivo regulation of osteoclastogenesis : qRT-PCR analysis in calvaria to assess alterations in the RANKL/OPG Axis. (i) Tnfsf11(Rankl) and Tnfrsf11b(Opg) mRNA levels. (j) Tnfsf11(Rankl):Tnfrsf11b(Opg) ratio. Relative quantification of mRNA was performed via the comparative C T method (ΔΔCT); Gapdh was utilized as an internal control gene; data expressed as fold difference relative to SPF. (kn) In vivo pro-inflammatory cytokine expression: RNA was isolated from tissues and qRT-PCR analysis was performed in (k) bone marrow (n = 4/gp), (l) ileum (n = 4/gp), (m) liver (n = 4/gp), (n) spleen (n = 4/gp) to assess Tnf, Il6, Csf1, Ccl2, Cxcl1 mRNA. Relative quantification of mRNA was performed via the comparative C T method (ΔΔCT); Gapdh was utilized as an internal control gene; data expressed as fold difference relative to SPF. Data are reported as mean ± SEM. *p < 0.05 vs. SPF; ***p < 0.001 vs. SPF.

Similar articles

Cited by

References

    1. Round JL, Mazmanian SK. The gut microbiota shapes intestinal immune responses during health and disease. Nat Rev Immunol. 2009;9:313–323. doi: 10.1038/nri2515. - DOI - PMC - PubMed
    1. Ivanov II, Honda K. Intestinal commensal microbes as immune modulators. Cell Host Microbe. 2012;12:496–508. doi: 10.1016/j.chom.2012.09.009. - DOI - PMC - PubMed
    1. Belkaid Y, Bouladoux N, Hand TW. Effector and memory T cell responses to commensal bacteria. Trends Immunol. 2013;34:299–306. doi: 10.1016/j.it.2013.03.003. - DOI - PMC - PubMed
    1. Brestoff JR, Artis D. Commensal bacteria at the interface of host metabolism and the immune system. Nat Immunol. 2013;14:676–684. doi: 10.1038/ni.2640. - DOI - PMC - PubMed
    1. Rolig AS, Parthasarathy R, Burns AR, Bohannan BJ, Guillemin K. Individual Members of the Microbiota Disproportionately Modulate Host Innate Immune Responses. Cell Host Microbe. 2015;18:613–620. doi: 10.1016/j.chom.2015.10.009. - DOI - PMC - PubMed

Publication types

MeSH terms

Substances