. 2017 Jul 18;7(1):5680.
doi: 10.1038/s41598-017-05972-z.

Microbial turnover times in the deep seabed studied by amino acid racemization modelling

Affiliations

Microbial turnover times in the deep seabed studied by amino acid racemization modelling

Stefan Braun et al. Sci Rep. .

Abstract

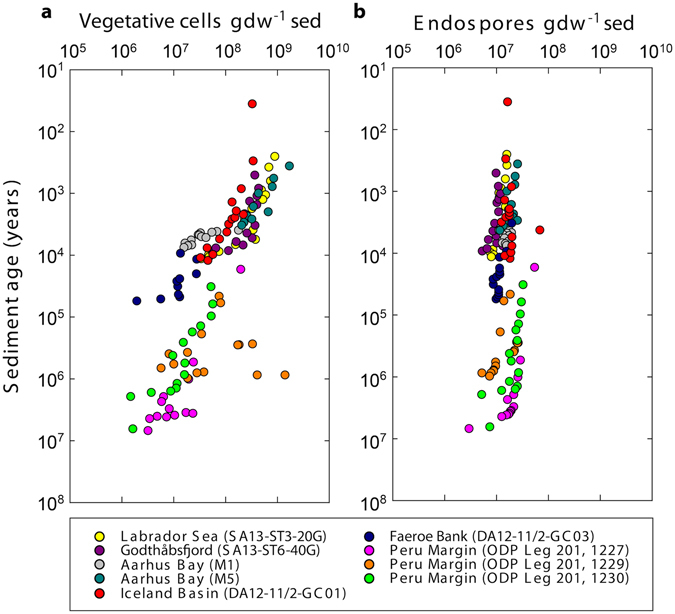
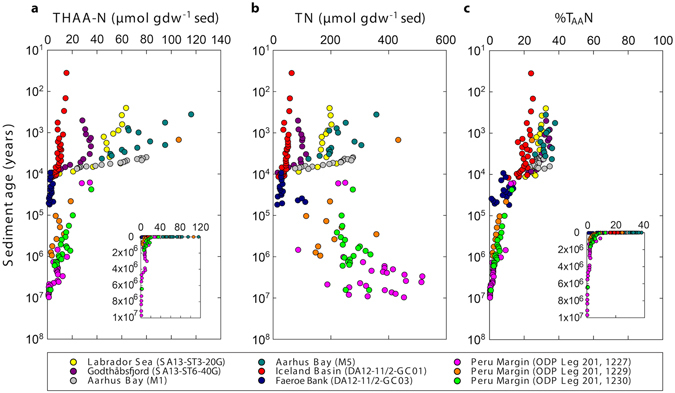
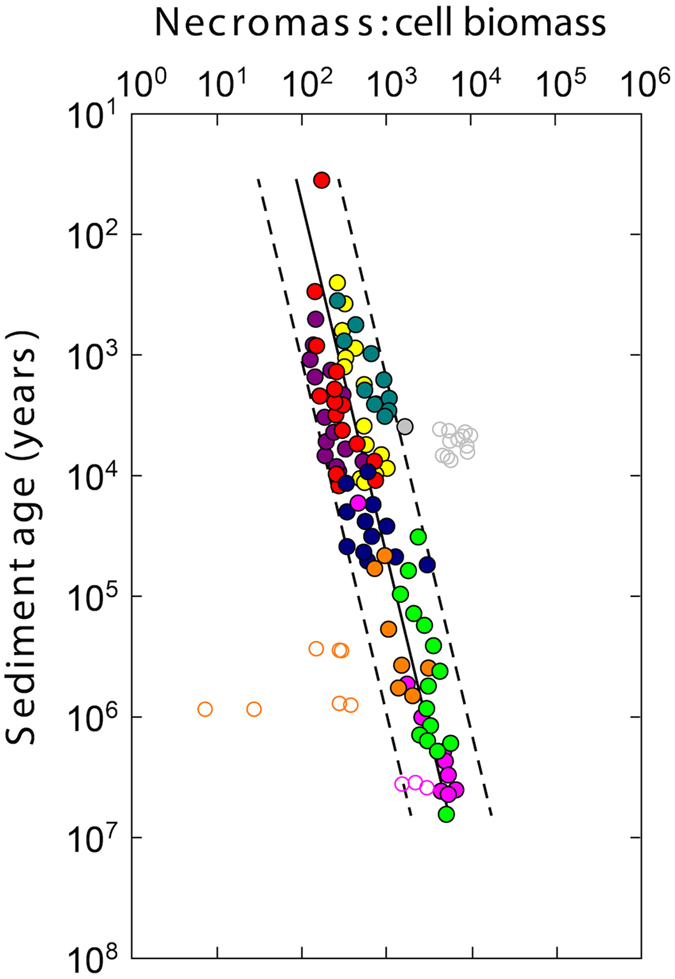
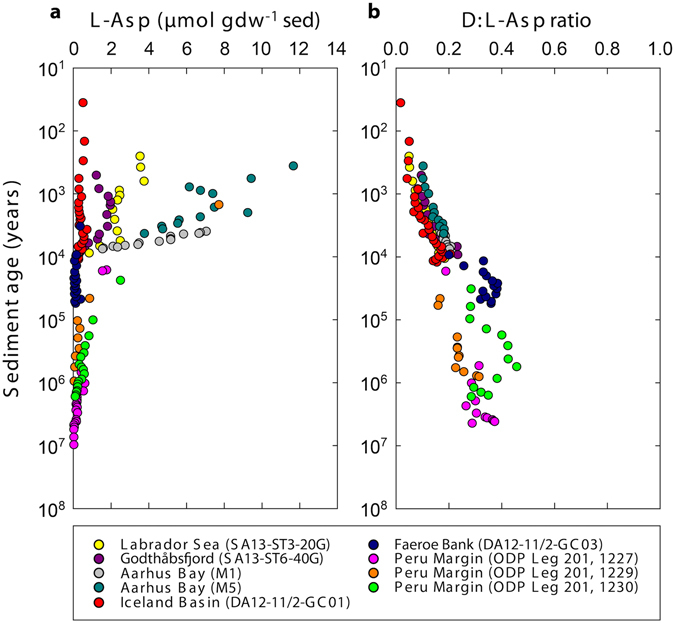
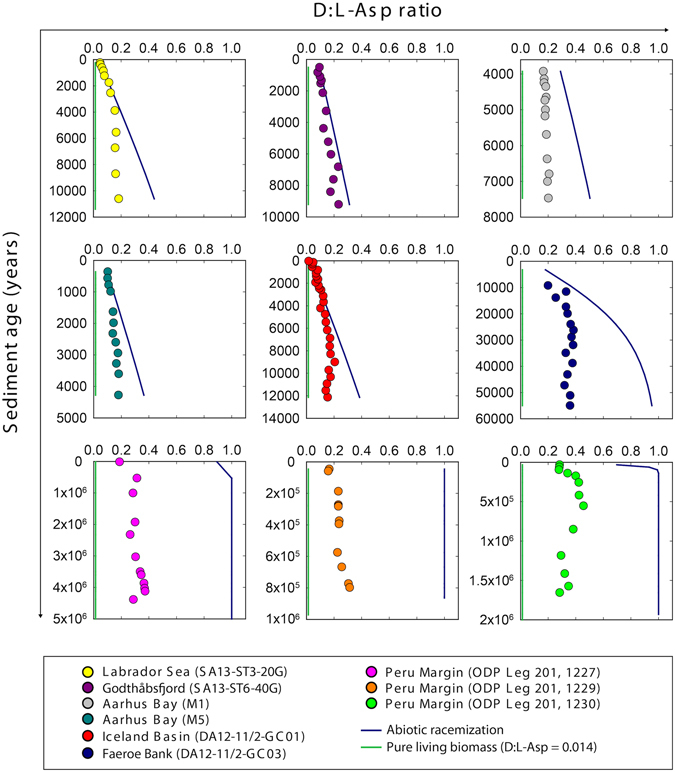
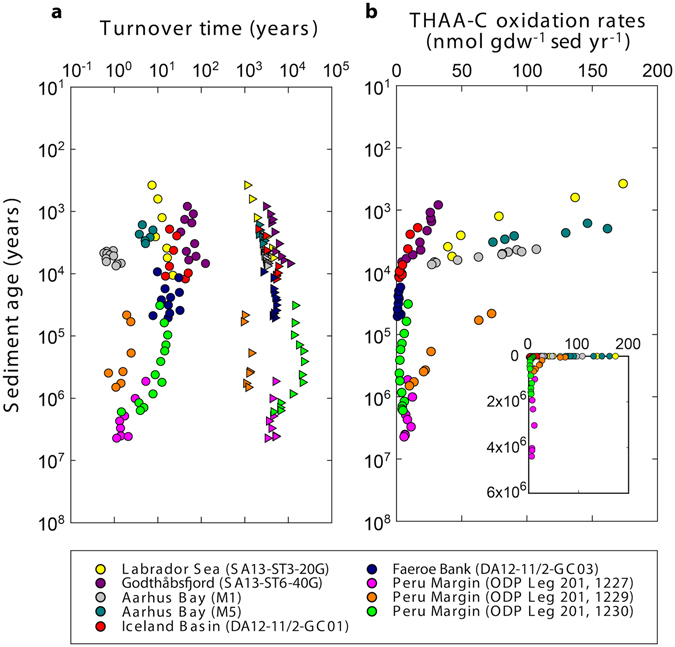
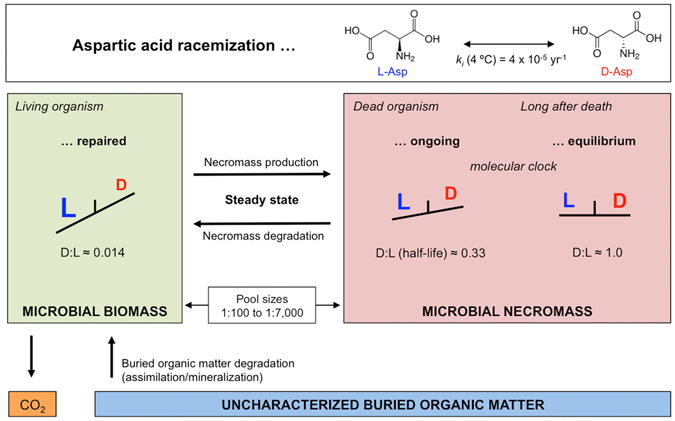
The study of active microbial populations in deep, energy-limited marine sediments has extended our knowledge of the limits of life on Earth. Typically, microbial activity in the deep biosphere is calculated by transport-reaction modelling of pore water solutes or from experimental measurements involving radiotracers. Here we modelled microbial activity from the degree of D:L-aspartic acid racemization in microbial necromass (remains of dead microbial biomass) in sediments up to ten million years old. This recently developed approach (D:L-amino acid modelling) does not require incubation experiments and is highly sensitive in stable, low-activity environments. We applied for the first time newly established constraints on several important input parameters of the D:L-amino acid model, such as a higher aspartic acid racemization rate constant and a lower cell-specific carbon content of sub-seafloor microorganisms. Our model results show that the pool of necromass amino acids is turned over by microbial activity every few thousand years, while the turnover times of vegetative cells are in the order of years to decades. Notably, microbial turnover times in million-year-old sediment from the Peru Margin are up to 100-fold shorter than previous estimates, highlighting the influence of microbial activities on element cycling over geologic time scales.


Conflict of interest statement

The authors declare that they have no competing interests.

Figures

Figure 1
Figure 1
Abundance of vegetative cells (a) and bacterial endospores (b) versus sediment age. Vegetative cell abundance was determined from epifluorescence microscopy. Endospores were quantified from the bacterial endospore marker dipicolinic acid (DPA). Vegetative cell counts for samples from the Labrador Sea and the Godthåbsfjord were first published in ref. . Vegetative cell counts for samples from Aarhus Bay and the Peru Margin are taken from refs and , respectively. Endospore data for the Peru Margin and Aarhus Bay are taken from refs and , respectively. The unit ‘per gram dry weight sediment’ is abbreviated with ‘gdw−1 sed’. Note the logarithmic scales on all axes.
Figure 2
Figure 2
Sedimentary concentrations of total hydrolysable amino acid-nitrogen (THAA-N) and total nitrogen (TN). (a) Concentrations of sedimentary THAA-N determined from HPLC analyses of amino acids. (b) Concentrations of total nitrogen in the sediment. (c) The fraction of total nitrogen present as amino acids (%TAAN). The unit ‘per gram dry weight sediment’ is abbreviated with ‘gdw−1 sed’. Note that sediment ages are on logarithmic scales. Inserts in (a) and (c) have linear age scales for better comprehension of the time dimensions.
Figure 3
Figure 3
Ratio between THAA-N in microbial necromass and biomass (vegetative cells only). The fraction of THAA-N derived from microbial necromass increases with age relative to that derived from vegetative cells. Note that the concentrations of THAA-N in vegetative cells and necromass were not measured directly, but calculated based on measurements on vegetative cell and endospore abundances and literature conversion factors for the cellular content of THAA-N (see Methods Summary for details on how the calculations were performed). Regression lines show necromass:vegetative cell biomass ratio versus sediment age (solid line; log10(necromass:vegetative cell biomass) = 1.405 × log10(sediment age) + 0.343, N = 98, R 2 = 0.76, P < 0.0001, least squares analysis) and 95% prediction interval (dashed lines). Open circles denote data points that have been removed from regression analysis (e.g. outliers, sulphate-methane transition zones). Note that sediment age is shown on a logarithmic scale. Colour legend is the same as for Figs 1 and 2.
Figure 4
Figure 4
Occurrence of L-Asp and D:L-Asp ratios. (a) Total concentrations of L-Asp. (b) D:L-Asp ratios increase with age of the sediment. The unit ‘per gram dry weight sediment’ is abbreviated with ‘gdw−1 sed’. Note that sediment ages are on logarithmic scales.
Figure 5
Figure 5
Balance between abiotic racemization and biological turnover of Asp. Ratios of D:L-Asp in the sediment (colored circles) are higher than that of pure vegetative cell biomass (green lines, D:L-Asp ratio = 0.014), but lower than those predicted from pure chemical racemization (blue lines), . In very old sediments (>105 years), D:L-Asp ratios are between 0.3 and 0.4, whereas pure racemization would have led to a ratio of 1.0.
Figure 6
Figure 6
Model-estimated carbon oxidation rates and turnover times of microbial bio- and necromass. (a) D:L-amino acid model-estimated turnover times of vegetative cells (circles) and necromass amino acids (triangles) in the seabed. (b) Model-estimated oxidation rates of amino acid-carbon (THAA-C) in the samples. The unit ‘per gram dry weight sediment per year’ is abbreviated with ‘gdw−1 sed yr−1’. Note that sediment ages are on logarithmic scales. Insert in (b) has a linear age scale for better comprehension of the time dimensions.
Figure 7
Figure 7
Scheme of the D:L-amino acid model. Conceptual scheme showing D:L-Asp ratios in bio- and necromass as well as different pools of amino acids with indications of the amino acid-cycling between pools. Pools are microbial biomass (vegetative cells + endospores), microbial necromass (necromass amino acids) and uncharacterized buried organic matter (not amino acids). Modified after ref. .

References

    1. Inagaki F, et al. Exploring deep microbial life in coal-bearing sediment down to ~2.5 km below the ocean floor. Science. 2015;349:420–424. doi: 10.1126/science.aaa6882. - DOI - PubMed
    1. Kallmeyer J, Pockalny R, Adhikari RR, Smith DC, D’Hondt S. Global distribution of microbial abundance and biomass in subseafloor sediment. Proc. Natl. Acad. Sci. USA. 2012;109:16213–16216. doi: 10.1073/pnas.1203849109. - DOI - PMC - PubMed
    1. Parkes RJ, et al. A review of prokaryotic populations and processes in sub-seafloor sediments, including biosphere:geosphere interactions. Mar. Geol. 2014;352:409–425. doi: 10.1016/j.margeo.2014.02.009. - DOI
    1. Whitman WB, Coleman DC, Wiebe WJ. Prokaryotes: the unseen majority. Proc. Natl. Acad. Sci. USA. 1998;95:6578–6583. doi: 10.1073/pnas.95.12.6578. - DOI - PMC - PubMed
    1. Lomstein BA, Langerhuus AT, D’Hondt S, Jørgensen BB, Spivack A. Endospore abundance, microbial growth and necromass turnover in deep subseafloor sediment. Nature. 2012;484:101–104. doi: 10.1038/nature10905. - DOI - PubMed

Publication types

LinkOut - more resources