

A Predictive Mathematical Modeling Approach for the Study of Doxorubicin Treatment in Triple Negative Breast Cancer
- PMID: 28720897
- PMCID: PMC5516013
- DOI: 10.1038/s41598-017-05902-z
A Predictive Mathematical Modeling Approach for the Study of Doxorubicin Treatment in Triple Negative Breast Cancer
Abstract
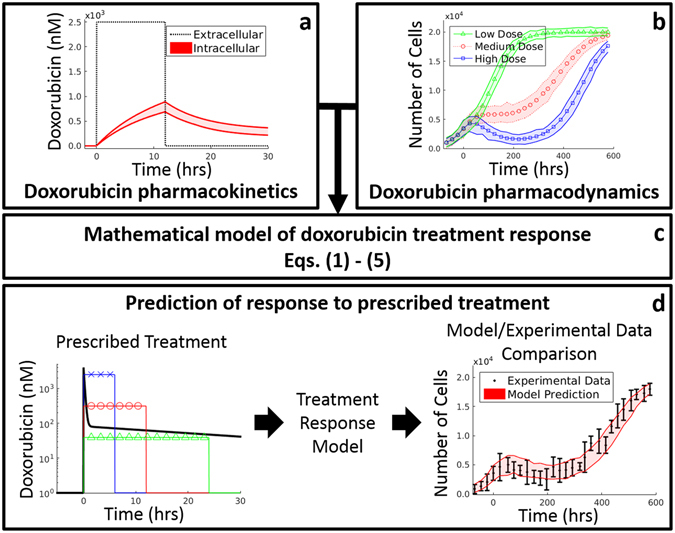
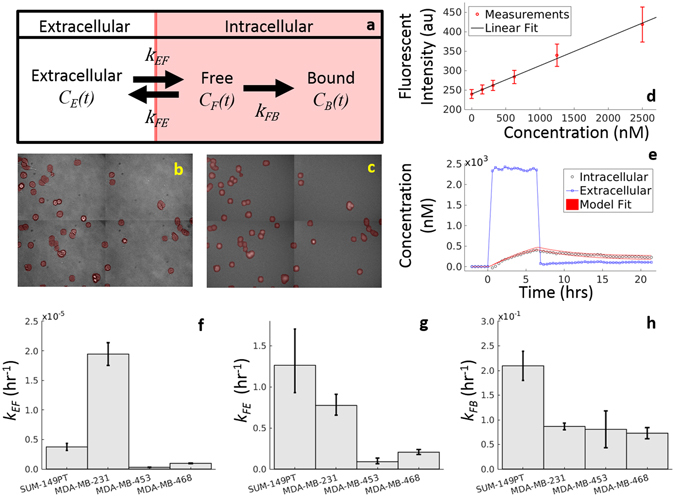
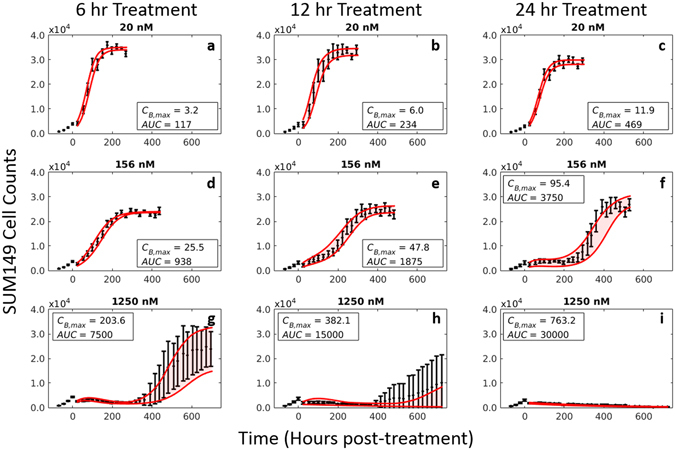
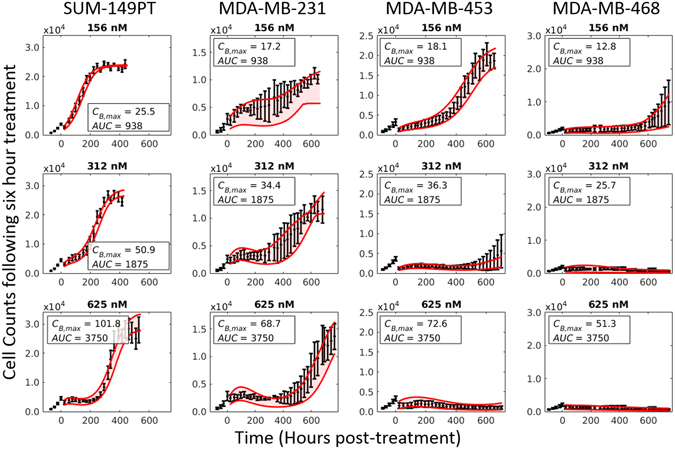
Doxorubicin forms the basis of chemotherapy regimens for several malignancies, including triple negative breast cancer (TNBC). Here, we present a coupled experimental/modeling approach to establish an in vitro pharmacokinetic/pharmacodynamic model to describe how the concentration and duration of doxorubicin therapy shape subsequent cell population dynamics. This work features a series of longitudinal fluorescence microscopy experiments that characterize (1) doxorubicin uptake dynamics in a panel of TNBC cell lines, and (2) cell population response to doxorubicin over 30 days. We propose a treatment response model, fully parameterized with experimental imaging data, to describe doxorubicin uptake and predict subsequent population dynamics. We found that a three compartment model can describe doxorubicin pharmacokinetics, and pharmacokinetic parameters vary significantly among the cell lines investigated. The proposed model effectively captures population dynamics and translates well to a predictive framework. In a representative cell line (SUM-149PT) treated for 12 hours with doxorubicin, the mean percent errors of the best-fit and predicted models were 14% (±10%) and 16% (±12%), which are notable considering these statistics represent errors over 30 days following treatment. More generally, this work provides both a template for studies quantitatively investigating treatment response and a scalable approach toward predictions of tumor response in vivo.
Conflict of interest statement
The authors declare that they have no competing interests.
Figures
Similar articles
-
Model selection for assessing the effects of doxorubicin on triple-negative breast cancer cell lines.J Math Biol. 2022 Nov 10;85(6-7):65. doi: 10.1007/s00285-022-01828-x. J Math Biol. 2022. PMID: 36352309
-
Repression of phosphoglycerate dehydrogenase sensitizes triple-negative breast cancer to doxorubicin.Cancer Chemother Pharmacol. 2016 Sep;78(3):655-9. doi: 10.1007/s00280-016-3117-4. Epub 2016 Jul 29. Cancer Chemother Pharmacol. 2016. PMID: 27473325
-
Doxorubicin-Loaded Micelle Targeting MUC1: A Potential Therapeutic for MUC1 Triple Negative Breast Cancer Treatment.Curr Drug Deliv. 2018;15(3):406-416. doi: 10.2174/1567201814666170712122508. Curr Drug Deliv. 2018. PMID: 28707580
-
Polyethylene glycol-liposomal doxorubicin. A review of its pharmacodynamic and pharmacokinetic properties, and therapeutic efficacy in the management of AIDS-related Kaposi's sarcoma.Drugs. 1997 Mar;53(3):520-38. doi: 10.2165/00003495-199753030-00011. Drugs. 1997. PMID: 9074848 Review.
-
Pharmacokinetic profiles of doxorubicin in combination with taxanes.Semin Oncol. 2001 Aug;28(4 Suppl 12):8-14. Semin Oncol. 2001. PMID: 11552225 Review.
Cited by
-
Combined effects of pioglitazone and doxorubicin on migration and invasion of MDA-MB-231 breast cancer cells.J Egypt Natl Canc Inst. 2022 Mar 28;34(1):13. doi: 10.1186/s43046-022-00110-x. J Egypt Natl Canc Inst. 2022. PMID: 35342925
-
Antitumor properties of Salvianolic acid B against triple-negative and hormone receptor-positive breast cancer cells via ceramide-mediated apoptosis.Oncotarget. 2018 Nov 20;9(91):36331-36343. doi: 10.18632/oncotarget.26348. eCollection 2018 Nov 20. Oncotarget. 2018. PMID: 30555632 Free PMC article.
-
A Mathematical Model of In Vitro Cellular Uptake of Zoledronic Acid and Isopentenyl Pyrophosphate Accumulation.Pharmaceutics. 2022 Jun 14;14(6):1262. doi: 10.3390/pharmaceutics14061262. Pharmaceutics. 2022. PMID: 35745834 Free PMC article.
-
Using mathematical modelling and AI to improve delivery and efficacy of therapies in cancer.Nat Rev Cancer. 2025 May;25(5):324-340. doi: 10.1038/s41568-025-00796-w. Epub 2025 Feb 19. Nat Rev Cancer. 2025. PMID: 39972158 Review.
-
In-silico tool based on Boolean networks and meshless simulations for prediction of reaction and transport mechanisms in the systemic administration of chemotherapeutic drugs.PLoS One. 2025 Feb 7;20(2):e0315194. doi: 10.1371/journal.pone.0315194. eCollection 2025. PLoS One. 2025. PMID: 39919263 Free PMC article.
References
-
- Stadtmauer EA, et al. Conventional-dose chemotherapy compared with high-dose chemotherapy plus autologous hematopoietic stem-cell transplantation for metastatic breast cancer. Philadelphia Bone Marrow Transplant Group. N. Engl. J. Med. 2000;342:1069–1076. doi: 10.1056/NEJM200004133421501. - DOI - PubMed
-
- Norton L. A Gompertzian model of human breast cancer growth. Cancer Res. 1988;48:7067–7071. - PubMed
Publication types
MeSH terms
Substances
Grants and funding
LinkOut - more resources
Full Text Sources
Other Literature Sources
Research Materials
