. 2015 Jun 17:1:15007.
doi: 10.1038/npjbiofilms.2015.7. eCollection 2015.

Comparative integrated omics: identification of key functionalities in microbial community-wide metabolic networks

Affiliations

Comparative integrated omics: identification of key functionalities in microbial community-wide metabolic networks

Hugo Roume et al. NPJ Biofilms Microbiomes. .

Abstract

Background: Mixed microbial communities underpin important biotechnological processes such as biological wastewater treatment (BWWT). A detailed knowledge of community structure and function relationships is essential for ultimately driving these systems towards desired outcomes, e.g., the enrichment in organisms capable of accumulating valuable resources during BWWT.

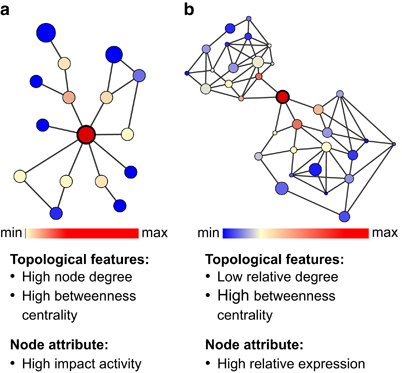
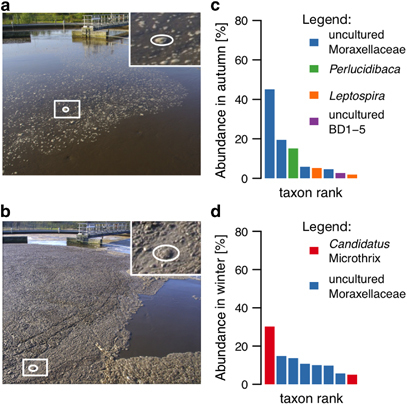
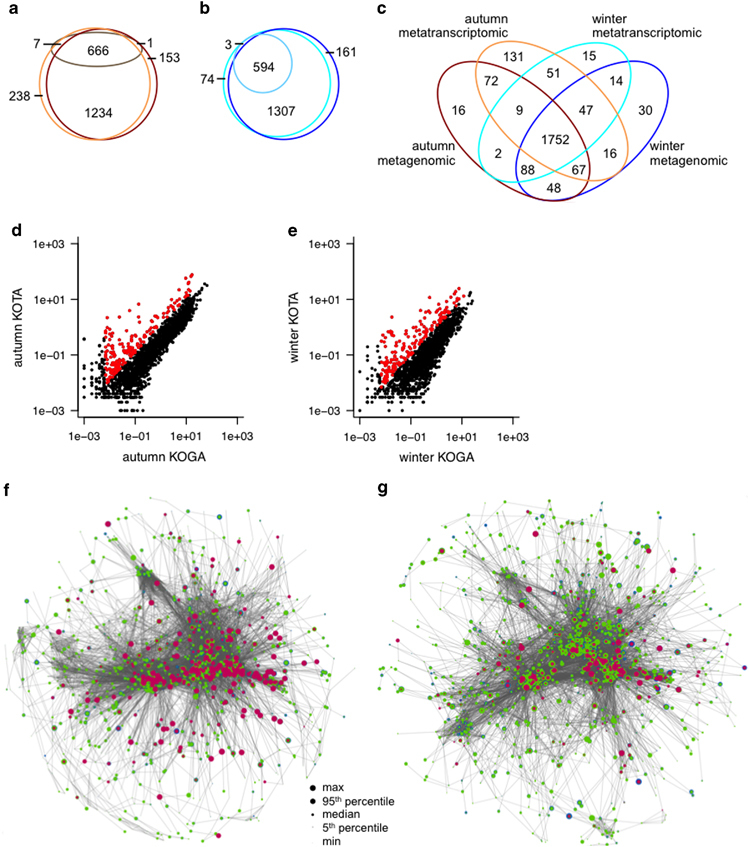
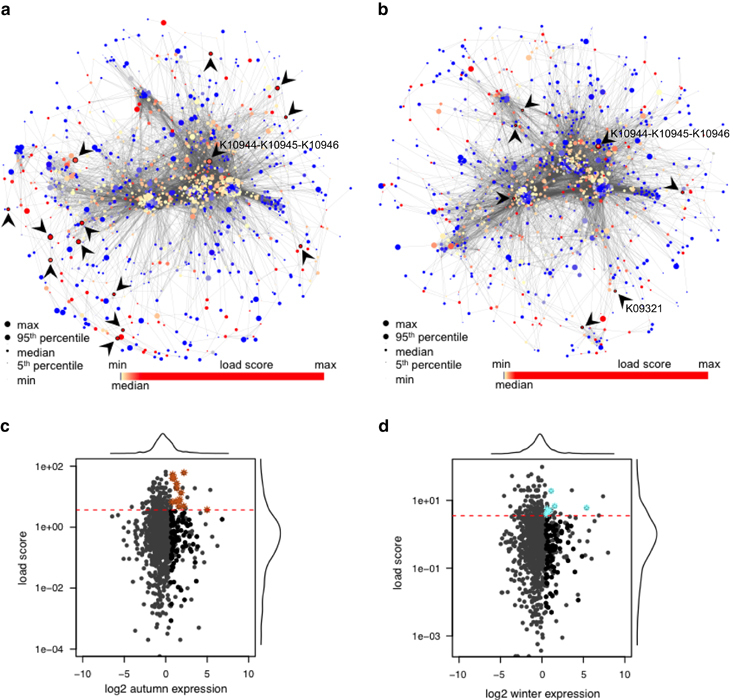
Methods: A comparative integrated omic analysis including metagenomics, metatranscriptomics and metaproteomics was carried out to elucidate functional differences between seasonally distinct oleaginous mixed microbial communities (OMMCs) sampled from an anoxic BWWT tank. A computational framework for the reconstruction of community-wide metabolic networks from multi-omic data was developed. These provide an overview of the functional capabilities by incorporating gene copy, transcript and protein abundances. To identify functional genes, which have a disproportionately important role in community function, we define a high relative gene expression and a high betweenness centrality relative to node degree as gene-centric and network topological features, respectively.

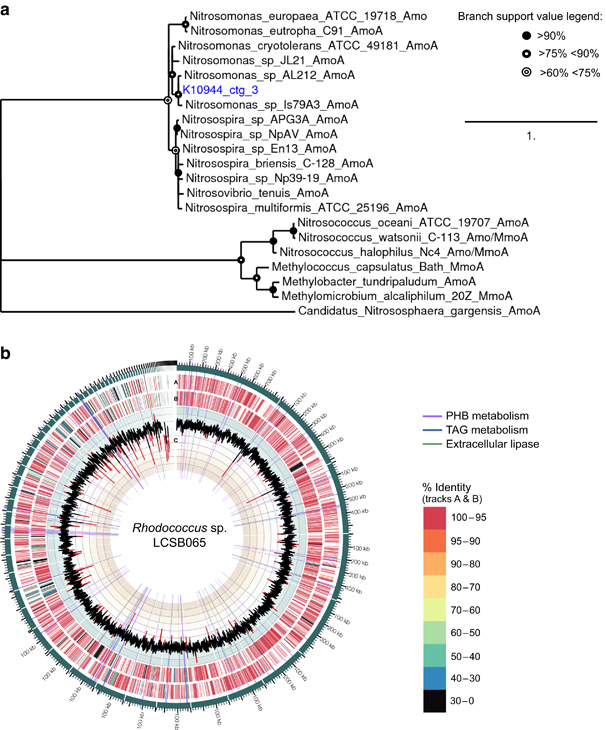
Results: Genes exhibiting high expression relative to gene copy abundance include genes involved in glycerolipid metabolism, particularly triacylglycerol lipase, encoded by known lipid accumulating populations, e.g., CandidatusMicrothrix parvicella. Genes with a high relative gene expression and topologically important positions in the network include genes involved in nitrogen metabolism and fatty acid biosynthesis, encoded by Nitrosomonas spp. and Rhodococcus spp. Such genes may be regarded as 'keystone genes' as they are likely to be encoded by keystone species.

Conclusion: The linking of key functionalities to community members through integrated omics opens up exciting possibilities for devising prediction and control strategies for microbial communities in the future.


Conflict of interest statement

The authors declare no conflict of interest.

Figures

Figure 1
Figure 1
Criteria for defining keystone nodes in microbial species interaction and community-wide metabolic networks. (a) Criteria for identifying keystone species in reconstructed species interaction networks. Nodes represent taxa and edges represent associations between them. Node sizes reflect activity. (b) Criteria for identifying genes encoding key functionalities in reconstructed community-wide metabolic networks. Nodes represent enzyme-coding genes and edges correspond to shared metabolites (either reactants, products or educts). Node sizes reflect relative expression.
Figure 2
Figure 2
OMMC composition in autumn and winter seasons. Photographs of the OMMCs located at the water surface of the anoxic tank at the Schifflange BWWT plant in (a) autumn and (b) winter sampling dates. Abundance of genera of dominant community members based on reconstructed 16S rRNA gene sequences from metagenomic data in (c) autumn and (d) winter. OMMC, oleaginous mixed microbial community; rRNA, ribosomal RNA.
Figure 3
Figure 3
Integration of metagenomic, metatranscriptomic and metaproteomic data. (a) Venn diagram highlighting subsets of KEGG orthologous groups (KOs) in metabolic pathways present in the metagenomic (dark brown), metatranscriptomic (orange) and metaproteomic (pale brown) data from the autumn sample. (b) Subsets of KOs in metabolic pathways present in the metagenomic (dark blue), metatranscriptomic (cyan) and metaproteomic (pale blue) data from the winter sample. (c) Comparison of occurrence of KOs in metabolic pathways in metagenomic and metatranscriptomic data sets from autumn and winter. (d) Comparison of KO gene copy abundance (KOGA) and transcript abundance (KOTA) of KOs in metabolic pathways in the autumn data set. (e) Comparison of KO gene copy abundance (KOGA) and transcript abundance (KOTA) in metabolic pathways in the winter data set. In d and e, highly expressed KOs are highlighted in red. (f) Simplified autumn-specific metabolic network reconstruction. (g) Simplified winter-specific metabolic network reconstruction. In f and g, size of nodes represents KO abundance at metagenomic (blue), metatranscriptomic (green) and metaproteomic (magenta) levels, respectively. KEGG, Kyoto Encyclopedia of Genes and Genome.
Figure 4
Figure 4
Topological analysis of the reconstructed season-specific community-wide metabolic networks and assessment of relative gene expression. (a) Autumn- and (b) winter-specific networks. In (a) and (b) node colours refer to load score and node sizes represent relative gene expression. KOs encoding key functionalities are encircled and highlighted by arrow heads. (c and d) Results of the topological analysis of KOs in simplified season-specific networks for (c) autumn and (d) winter. Highly expressed genes are indicated as black dots and KOs encoding key functionalities are indicated by brown (autumn) or cyan (winter) asterisks. Dotted red lines indicate minimal load score of KOs deemed to encode key functionalities.
Figure 5
Figure 5
Linking key functionalities to important community members. (a) Phylogenetic tree based on the AmoA amino acid sequence derived from a contig extended using combined metagenomic and metatranscriptomic data (K10944_ctg_3). (b) Circos plot of the genome of Isolate LCSB065, highlighting amino acid similarity of encoded proteins to the Rhodococcus erythropolis PR4 genome and genes involved in poly-hydroxybutyrate (PHB) and TAG accumulation as well as encoded extracellular lipases. From the outside to the inside track: contigs (green) arranged by size; A: open reading frames in forward direction; B: open reading frames in reverse direction; colours in tracks A and B indicate %-similarity to the Rhodococcus erythropolis PR4 genome; C: %G+C in 1,000 bp sliding windows. Highlighted rays indicate the location of genes involved in PHB metabolism (violet), genes involved in TAG metabolism (blue) and extracellular lipase genes (green). TAG, triacylglycerol.

References

    1. Muller EE, Glaab E, May P, Vlassis N, Wilmes P. Condensing the omics fog of microbial communities. Trends Microbiol 2013; 7: 325–333. - PubMed
    1. Helbling DE, Ackermann M, Fenner K, Kohler H-PE, Johnson DR. The activity level of a microbial community function can be predicted from its metatranscriptome. ISME J 2012; 6: 902–904. - PMC - PubMed
    1. Wilmes P, Bond PL. Microbial community proteomics: elucidating the catalysts and metabolic mechanisms that drive the Earth's biogeochemical cycles. Curr Opin Microbiol 2009; 12: 310–317. - PubMed
    1. Roume H, Muller EE, Cordes T, Renaut J, Hiller K, Wilmes P. A biomolecular isolation framework for eco-systems biology. ISME J 2013; 7: 110–121. - PMC - PubMed
    1. Tang J. Microbial metabolomics. Curr Genomics 2011; 12: 391–403. - PMC - PubMed