. 2015 Aug 12:1:15007.
doi: 10.1038/npjbcancer.2015.7. eCollection 2015.

Activin-A signaling promotes epithelial-mesenchymal transition, invasion, and metastatic growth of breast cancer

Affiliations

Activin-A signaling promotes epithelial-mesenchymal transition, invasion, and metastatic growth of breast cancer

Mohsin Bashir et al. NPJ Breast Cancer. .

Abstract

Background: Activins belong to the transforming growth factor-β (TGF-β) superfamily of cytokines. Although the role of TGF-β in cancer progression has been highly advocated, the role of activin signaling in cancer is not well known. However, overexpression of activin-A has been observed in several cancers.

Aims: The gene expression profile indicated higher expression of Activin-A in breast tumors. Hence the aim of this study was to evaluate the status and role of Activin signaling pathway in these tumors.

Methods: Microarray analysis was performed to reveal gene expression changes in breast tumors. The results were validated by quantitative PCR and immunohistochemical analysis in two independent sets of normal and tumor samples. Further, correlation of activin expression with survival and distant metastasis was performed to evaluate its possible role in tumor progression. We used recombinant activin-A, inhibitors, overexpression, and knockdown strategies both in vitro and in vivo, to understand the mechanism underlying the protumorigenic role of this signaling pathway.

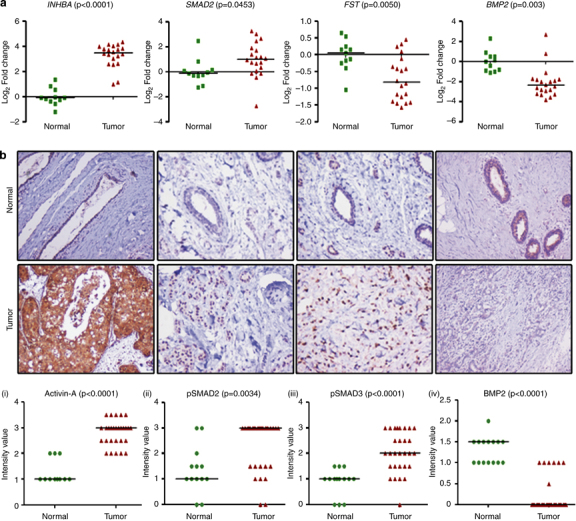
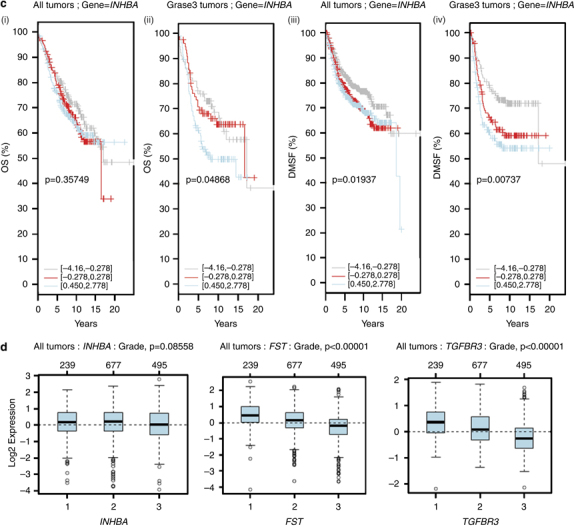
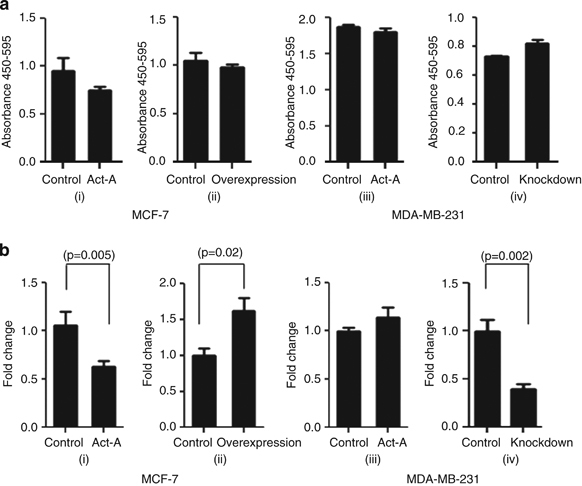
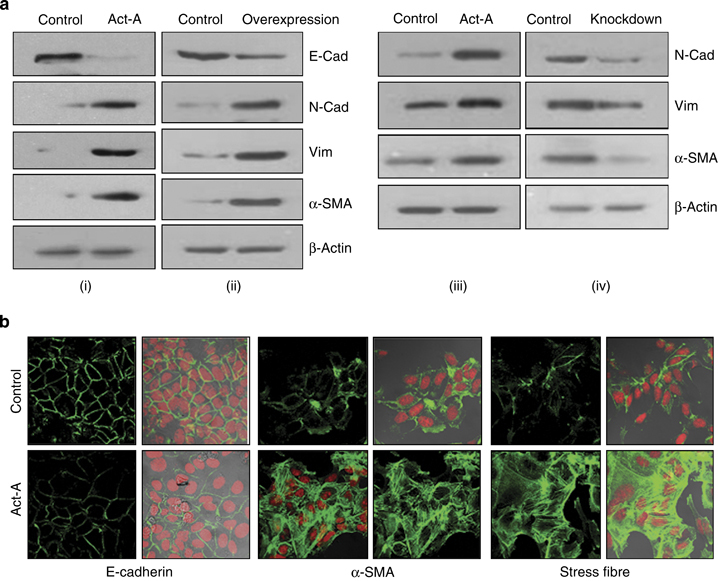
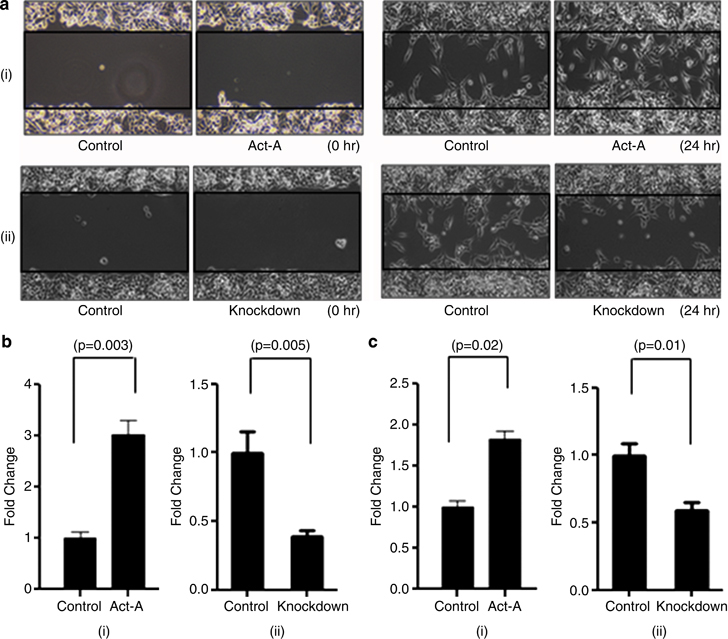
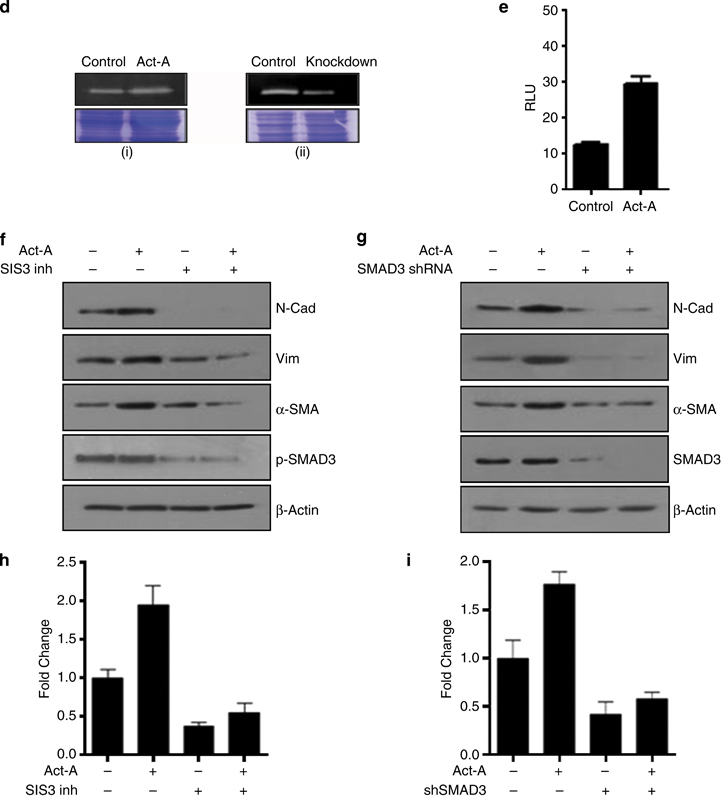
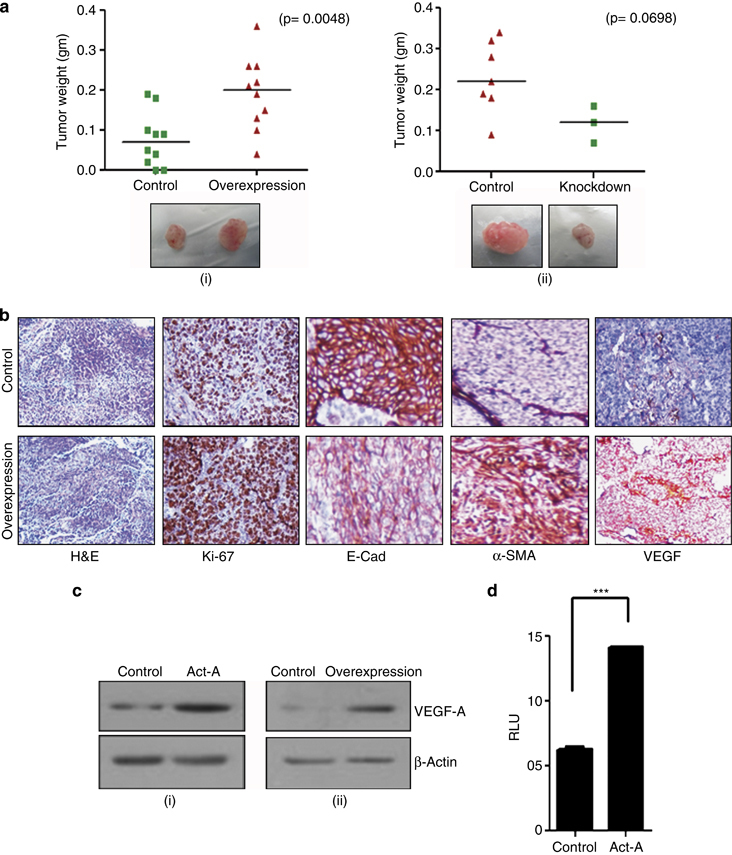
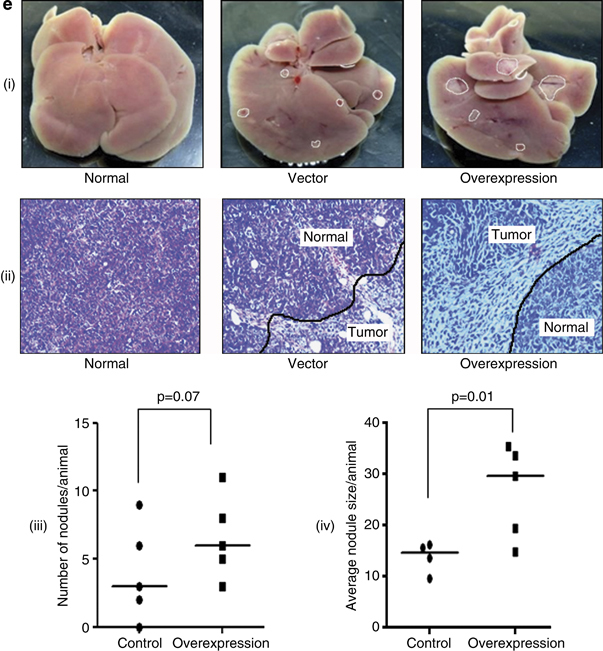
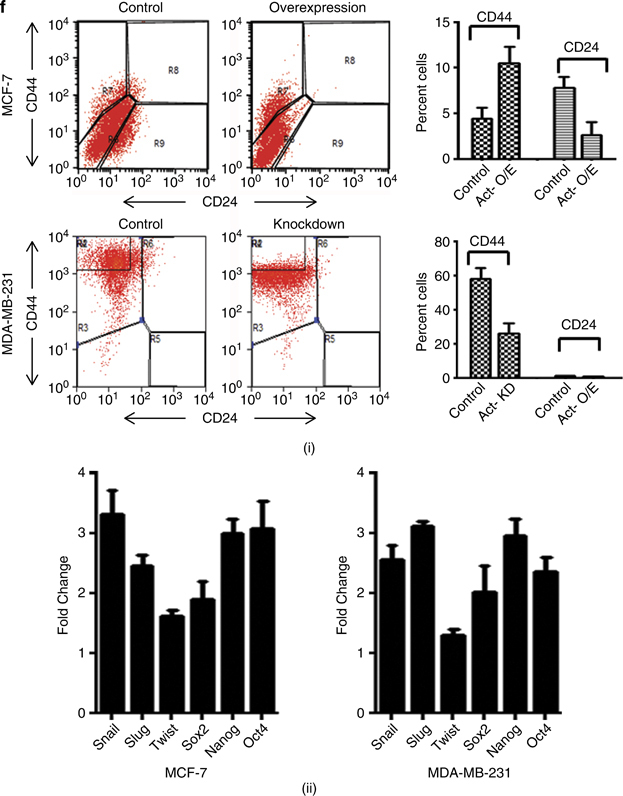
Results: We report that activin-A signaling is hyperactivated in breast cancers as indicated by higher activin-A, phosphoSMAD2, and phosphoSMAD3 levels in advanced breast cancers. Bone morphogenetic proteins and molecules involved in this signaling pathway were downregulated, suggesting its suppression in breast cancers. Activin-A expression correlates inversely with survival and metastasis in advanced breast cancers. Further, activin-A promotes anchorage-independent growth, epithelial-mesenchymal transition, invasion, angiogenesis, and stemness of breast cancer cells. We show that activin-A-induced phenotype is mediated by SMAD signaling pathway. In addition, activin-A expression affects the tumor-forming ability and metastatic colonization of cancer cells in nude mice.

Conclusions: These results suggest that activin-A has a critical role in breast cancer progression and, hence, targeting this pathway can be a valuable strategy in treating breast cancer patients.


Conflict of interest statement

The authors declare no conflict of interest.

Figures

Figure 1
Figure 1
Expression of activin and correlation with breast tumor progression. (a) Quantitative PCR analyses of INHBA, SMAD2, FST, and BMP2 expression in breast tumors compared with that in normal breast tissues. It is worth noting the significant increase in the expression of INHBA (activin-A) and Smad2. (b) Immunohistochemistry of activin-A (i), pSMAD2 (ii), pSMAD3 (iii), and BMP2 (iv) in normal and breast tumor sections. Breast tumors show higher levels of activin-A, pSMAD2, and pSMAD3, whereas normal samples have higher levels of BMP2 compared with tumor samples. Each graph below shows the intensity score of individual normal and tumor sample on a scale of 0 to 3. The statistical significance is indicated in the representative graph. (c) GOBO gene set analysis shows that INHBA expression inversely correlates with overall survival (OS) of high-grade breast cancer patients (ii). In addition, INHBA expression correlates inversely with the distant metastasis-free survival (DMSF) of breast cancer patients (iii and iv). (d) GOBO box plot expression analysis shows that expression levels of negative regulators of activin signaling pathway, FST and TGFβR3, decrease progressively from grade 1 to grade 3.
Figure 1
Figure 1
Expression of activin and correlation with breast tumor progression. (a) Quantitative PCR analyses of INHBA, SMAD2, FST, and BMP2 expression in breast tumors compared with that in normal breast tissues. It is worth noting the significant increase in the expression of INHBA (activin-A) and Smad2. (b) Immunohistochemistry of activin-A (i), pSMAD2 (ii), pSMAD3 (iii), and BMP2 (iv) in normal and breast tumor sections. Breast tumors show higher levels of activin-A, pSMAD2, and pSMAD3, whereas normal samples have higher levels of BMP2 compared with tumor samples. Each graph below shows the intensity score of individual normal and tumor sample on a scale of 0 to 3. The statistical significance is indicated in the representative graph. (c) GOBO gene set analysis shows that INHBA expression inversely correlates with overall survival (OS) of high-grade breast cancer patients (ii). In addition, INHBA expression correlates inversely with the distant metastasis-free survival (DMSF) of breast cancer patients (iii and iv). (d) GOBO box plot expression analysis shows that expression levels of negative regulators of activin signaling pathway, FST and TGFβR3, decrease progressively from grade 1 to grade 3.
Figure 2
Figure 2
Activin-A promotes anchorage-independent growth but not proliferation of breast cancer cells. (a) Bromodeoxyuridine (BrdU) incorporation assay following activin-A treatment of MCF7 (i) and MDA-MB-231 (iii) cells. Overexpression of INHBA in MCF7 cells (ii) and knockdown of INHBA by small hairpin RNA (shRNA) in MDA-MB-231 cells (iv). MCF-7 cells but not MDA-MB-231 cells show mild inhibition in proliferation on activin-A treatment. (b) Treatment of MCF-7 cells with activin-A results in reduced colony growth (i), but MCF-7 clones overexpressing activin-A show higher colony-forming ability (ii). Treatment of MDA-MB-231 cells with activin-A in soft agar does not show any effect (iii) and stable knockdown of activin-A in MDA-MB-231 cells results in a significant decrease in colony formation (iv).
Figure 3
Figure 3
Activin regulates epithelial–mesenchymal transition (EMT) markers in breast cancer cells. (a) Western blot analyses showing activin-A treatment (i) or its stable overexpression (ii) in MCF7 cells, or activin A treatment (iii) or knockdown (iv) in MDA-MB-231 cells regulates EMT markers (it is noteworthy that MDA-MB-231 cells do not express E-cadherin). (b) Confocal microscope images of activin-A-treated MCF7 cells show cytoskeletal changes marked by decreased E-cadherin, increased α-smooth muscle actin (SMA) and stress fibre formation (phalloidin-fluorescein isothiocyanate staining).
Figure 4
Figure 4
Activin promotes migration and invasion of breast cancer cells. (a and b) Activin-A treatment (i) increases, whereas its stable knockdown (ii) decreases migration of MDA-MB-231 cells as shown by the scratch assay and transwell migration assay, respectively. (c) Matrigel invasion assay shows that activin-A treatment (i) increases, whereas its knockdown (ii) decreases invasion of MDA-MB-231 cells. (d) Zymography using MDA-MB-231 cell supernatant shows that activin-A treatment increases (i) and its knockdown decreases (ii) active matrix metalloproteinase-2 (MMP2) levels. (e) Luciferase reporter assay in HEK 293T cells shows that activin-A regulates MMP2 promoter activity. (f and g) Activin-A regulation of epithelial–mesenchymal transition (EMT) markers is inhibited using SMAD3 inhibitor or by stable knockdown of SMAD3 using small hairpin RNA (shRNA) in MDA-MB-231 cells. (h and i) Activin-A-induced increase in invasion in MDA-MB-231 cells is abrogated in the presence of SMAD3 inhibitor or stable knockdown of SMAD3.
Figure 4
Figure 4
Activin promotes migration and invasion of breast cancer cells. (a and b) Activin-A treatment (i) increases, whereas its stable knockdown (ii) decreases migration of MDA-MB-231 cells as shown by the scratch assay and transwell migration assay, respectively. (c) Matrigel invasion assay shows that activin-A treatment (i) increases, whereas its knockdown (ii) decreases invasion of MDA-MB-231 cells. (d) Zymography using MDA-MB-231 cell supernatant shows that activin-A treatment increases (i) and its knockdown decreases (ii) active matrix metalloproteinase-2 (MMP2) levels. (e) Luciferase reporter assay in HEK 293T cells shows that activin-A regulates MMP2 promoter activity. (f and g) Activin-A regulation of epithelial–mesenchymal transition (EMT) markers is inhibited using SMAD3 inhibitor or by stable knockdown of SMAD3 using small hairpin RNA (shRNA) in MDA-MB-231 cells. (h and i) Activin-A-induced increase in invasion in MDA-MB-231 cells is abrogated in the presence of SMAD3 inhibitor or stable knockdown of SMAD3.
Figure 5
Figure 5
Activin promotes tumorigenicity of breast cancer cells in immunocompromised mice. (a) Stable overexpression of activin-A in MCF-7 enhances (i), whereas stable knockdown of activin-A in MDA-MB-231 cells (ii) reduces their tumor-forming ability in nude mice. Shown below are the representative images of the tumors formed s.c. (b) Immunohistochemical analysis of MCF-7-overexpressing tumors shows EMT-like changes and higher ki-67 index. (c) Treatment of MCF-7 cells with activin-A (i) or overexpression of activin-A in MCF-7 cells (ii) results in increased levels of vascular endothelial growth factor-A (VEGF-A). (d) Luciferase reporter assay in HEK 293T cells shows that activin-A regulates VEGF promoter activity. (e) Tail vein injection of activin-A-overexpressing MCF-7 cells shows better tumor-forming ability in the livers of nude mice (i). Normal is shown here as the reference from an animal without injection of any cells. The panel below (ii) shows the hematoxylin and eosin (H&E) staining of the liver tissue sections. The graph (iii) and (iv) shows number and size of nodules formed in the liver per animal. (f) CD44high/CD24low fluorescence-activated cell sorting (FACS) analysis of activin-A-overexpressing or knockdown cells shows that activin-A influences stemness of breast cancer cells (i). Quantitative PCR analysis shows that treatment of MCF-7 or MDA-MB-231 cells with recombinant activin-A induces various markers of stemness (ii).
Figure 5
Figure 5
Activin promotes tumorigenicity of breast cancer cells in immunocompromised mice. (a) Stable overexpression of activin-A in MCF-7 enhances (i), whereas stable knockdown of activin-A in MDA-MB-231 cells (ii) reduces their tumor-forming ability in nude mice. Shown below are the representative images of the tumors formed s.c. (b) Immunohistochemical analysis of MCF-7-overexpressing tumors shows EMT-like changes and higher ki-67 index. (c) Treatment of MCF-7 cells with activin-A (i) or overexpression of activin-A in MCF-7 cells (ii) results in increased levels of vascular endothelial growth factor-A (VEGF-A). (d) Luciferase reporter assay in HEK 293T cells shows that activin-A regulates VEGF promoter activity. (e) Tail vein injection of activin-A-overexpressing MCF-7 cells shows better tumor-forming ability in the livers of nude mice (i). Normal is shown here as the reference from an animal without injection of any cells. The panel below (ii) shows the hematoxylin and eosin (H&E) staining of the liver tissue sections. The graph (iii) and (iv) shows number and size of nodules formed in the liver per animal. (f) CD44high/CD24low fluorescence-activated cell sorting (FACS) analysis of activin-A-overexpressing or knockdown cells shows that activin-A influences stemness of breast cancer cells (i). Quantitative PCR analysis shows that treatment of MCF-7 or MDA-MB-231 cells with recombinant activin-A induces various markers of stemness (ii).

References

    1. Wakefield LM , Hill CS . Beyond TGFβ: roles of other TGFβ superfamily members in cancer. Nat Rev Cancer 2013; 13: 328–341. - PMC - PubMed
    1. Rivier C , Vale W , Rivier J . Studies of the inhibin family of hormones: a review. Horm Res 1987; 28: 104–118. - PubMed
    1. Tsuchida K , Nakatani M , Uezumi A , Murakami T , Cui X . Signal transduction pathway through activin receptors as a therapeutic target of musculoskeletal diseases and cancer. Endocr J 2008; 55: 11–21. - PubMed
    1. Ling N , Ying SY , Ueno N , Shimasaki S , Esch F , Hotta M et al. Pituitary FSH is released by a heterodimer of the beta-subunits from the two forms of inhibin. Nature 1986; 321: 779–782. - PubMed
    1. Vale W , Rivier J , Vaughan J , McClintock R , Corrigan A , Woo W et al. Purification and characterization of an FSH releasing protein from porcine ovarian follicular fluid. Nature 1986; 321: 776–779. - PubMed