. 2016 Jul 13:2:16022.
doi: 10.1038/npjbcancer.2016.22. eCollection 2016.

The molecular landscape of high-risk early breast cancer: comprehensive biomarker analysis of a phase III adjuvant population

Affiliations

The molecular landscape of high-risk early breast cancer: comprehensive biomarker analysis of a phase III adjuvant population

Timothy R Wilson et al. NPJ Breast Cancer. .

Abstract

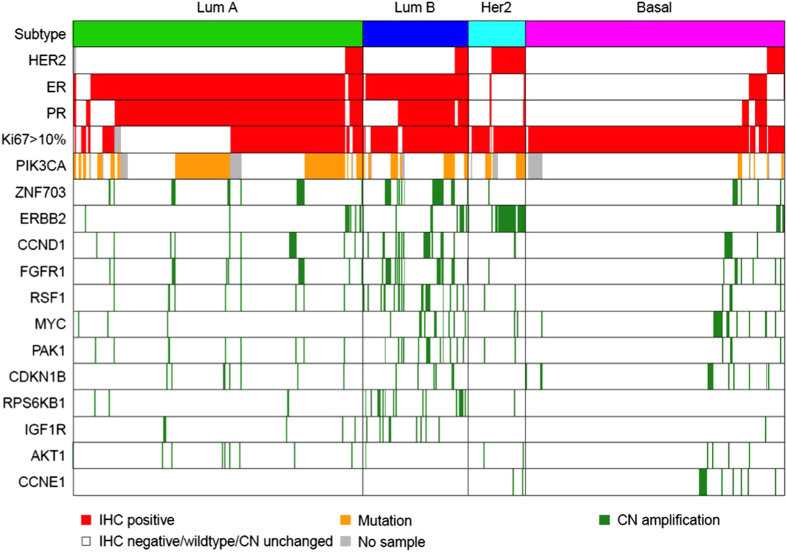
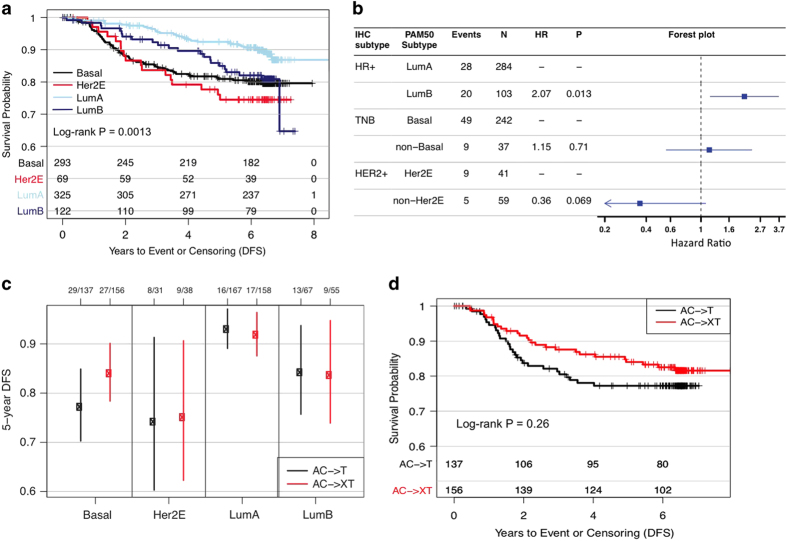
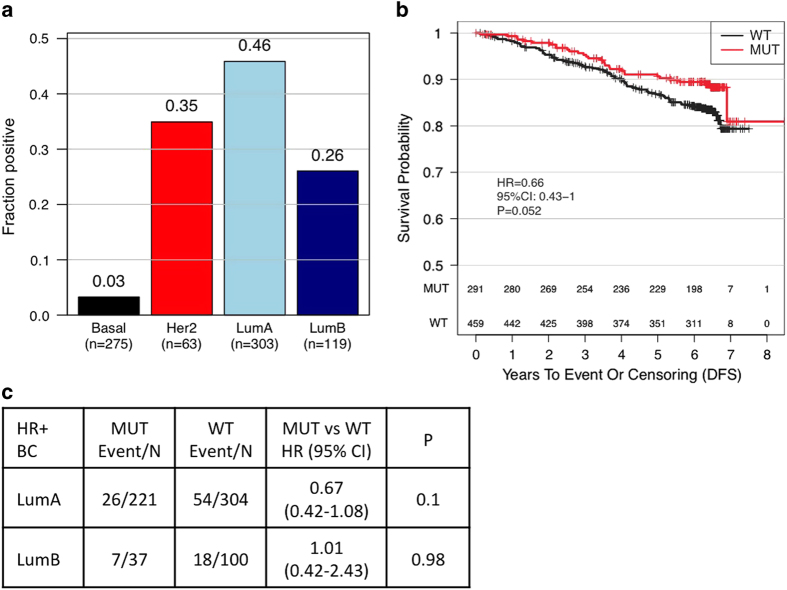
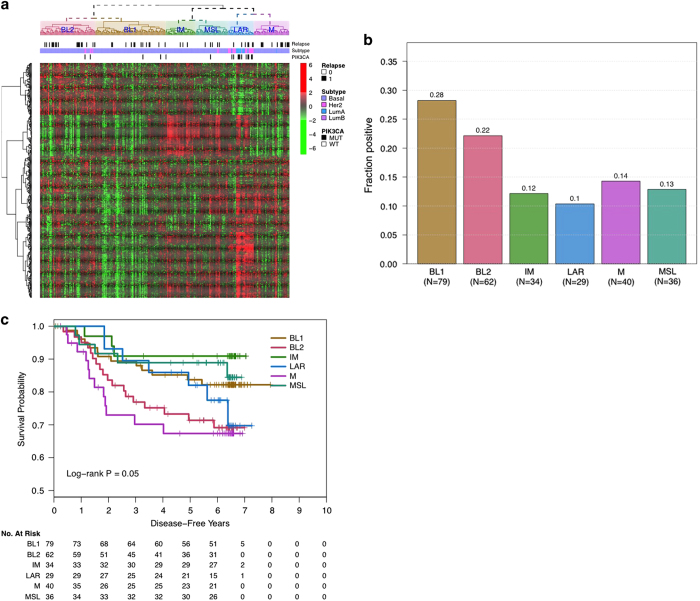
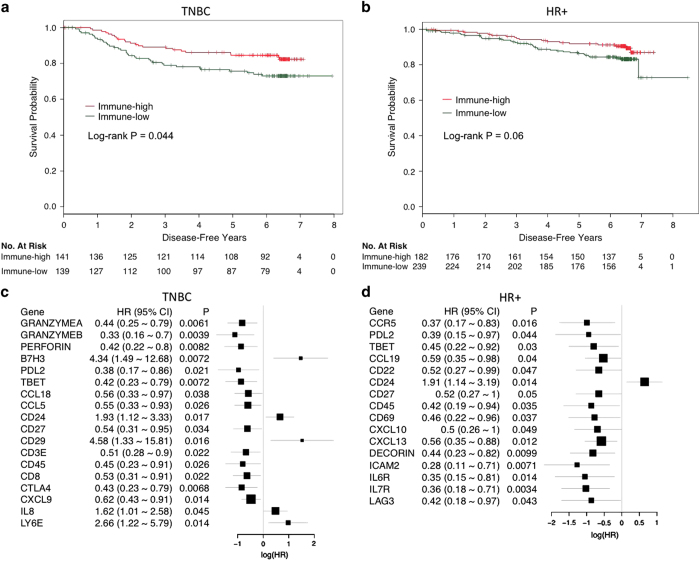
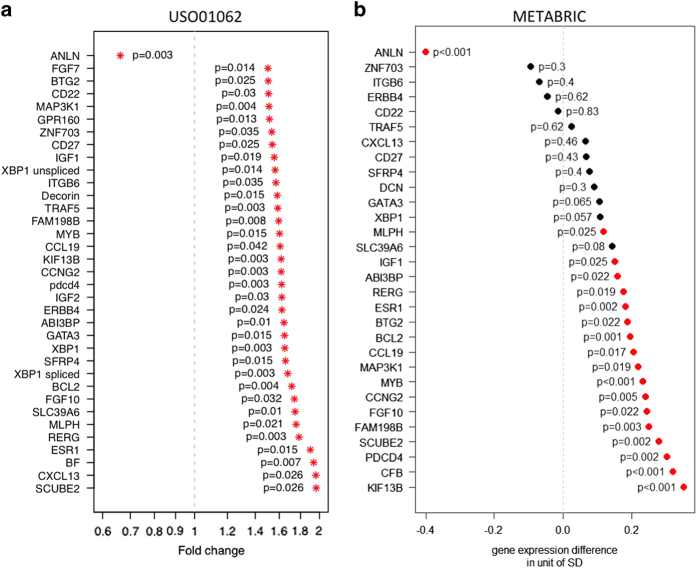
Breast cancer is a heterogeneous disease and patients are managed clinically based on ER, PR, HER2 expression, and key risk factors. We sought to characterize the molecular landscape of high-risk breast cancer patients enrolled onto an adjuvant chemotherapy study to understand how disease subsets and tumor immune status impact survival. DNA and RNA were extracted from 861 breast cancer samples from patients enrolled onto the United States Oncology trial 01062. Samples were characterized using multiplex gene expression, copy number, and qPCR mutation assays. HR+ patients with a PIK3CA mutant tumor had a favorable disease-free survival (DFS; HR 0.66, P=0.05), however, the prognostic effect was specific to luminal A patients (Luminal A: HR 0.67, P=0.1; Luminal B: HR 1.01, P=0.98). Molecular subtyping of triple-negative breast cancers (TNBCs) suggested that the mesenchymal subtype had the worst DFS, whereas the immunomodulatory subtype had the best DFS. Profiling of immunologic genes revealed that TNBC tumors (n=280) displaying an activated T-cell signature had a longer DFS following adjuvant chemotherapy (HR 0.59, P=0.04), while a distinct set of immune genes was associated with DFS in HR+ cancers. Utilizing a discovery approach, we identified genes associated with a high risk of recurrence in HR+ patients, which were validated in an independent data set. Molecular classification based on PAM50 and TNBC subtyping stratified clinical high-risk patients into distinct prognostic subsets. Patients with high expression of immune-related genes showed superior DFS in both HR+ and TNBC. These results may inform patient management and drug development in early breast cancer.


Conflict of interest statement

T.R.W., Y.X., J.S., J.Y., X.L., C.O.B., H.S., L.Y.H., W.Z., H.K., W.F.F., L.F., R.T., J.F., E.S., T.S., L.M., G.H. and M.R.L. are employed by Genentech and have equity in Roche. The remaining author declares no conflict of interest.

Figures

Figure 1
Figure 1
Molecular landscape of high-risk early breast cancer. Tumor samples are grouped according to intrinsic subtype; luminal A (n=285), luminal B (n=104), HER2-enriched (n=56), and basal-like (n=255). Red denotes IHC-positive cases, orange denotes PIK3CA mutation positive cases, green denotes copy-number amplified cases, white denotes wild-type or IHC-negative cases, and gray denotes no result available. IHC, immunohistochemical.
Figure 2
Figure 2
Effect of intrinsic subtypes on outcome. (a) Pooled arm analysis showing Kaplan–Meier curves of PAM50 status and DFS. (b) Forest plot depicting the effect of PAM50 status within IHC-defined subtypes. Her2E denotes HER2-enriched. In each subtype, the reported hazard ratio (HR) is calculated for DFS by comparing the two groups with the reference group being the top one. (c) Plot showing the effect of the addition of capecitabine to adjuvant chemotherapy with PAM50-defined subtypes. (d) Kaplan–Meier graph demonstrating the effect of capecitabine in the basal-like subgroup. A denotes doxorubicin, C denotes cyclophosphamide, T denotes docetaxel and X denotes capecitabine. DFS, disease-free survival; IHC, immunohistochemical.
Figure 3
Figure 3
Prevalence and prognostic role of PIK3CA mutations. (a) Bar graph showing the prevalence of PIK3CA mutations within intrinsic subtypes. (b) Kaplan–Meier graph showing the prognostic role of PIK3CA mutations in HR+ breast cancer patients. (c) Univariate CoxPH model assessing the prognostic role of PIK3CA mutations within luminal A and B cancers. HR+, hormone receptor positive.
Figure 4
Figure 4
Prevalence and prognostic implications of molecular subtypes within TNBC. Heatmap (a), prevalence (b) and prognostic role (c) of the Lehmann et al. molecular subtypes within triple-negative breast cancer patients. PAM50-defined subtype and PIK3CA mutation status are indicated in (a). BL1, basal-like 1; BL2, basal-like 2; IM, immunomodulatory; LAR, luminal androgen receptor; M, mesenchymal; MSL, mesenchymal stem-like; TNBCs, triple-negative breast cancers.
Figure 5
Figure 5
Role of immunologic and immune-related genes in TNBC and HR+ breast cancers. (a, b) Kaplan–Meier curves demonstrating the prognostic effect of the immune-high population (red) compared with the immune-low population (green) in TNBC (a) and HR+ breast cancer (b). (c, d) Forest plots showing the linear analysis of the significantly associated genes with clinical outcome, adjusted by treatment in both TNBC (c) and HR+ breast cancer (d). HR+, hormone receptor positive; TNBCs, triple-negative breast cancers.
Figure 6
Figure 6
Genes associated with decreased 5-year DFS in HR+ patients. (a) Forest plot depicting the 35 genes associated with an increased risk of recurrence within 5 years in HR+ patients. (b) Validation of high-risk genes utilizing the METABRIC data set. Genes that were significantly associated with a 5-year disease-specific survival (DSS) are indicated in red. HR+, hormone receptor positive.

References

    1. Hammond, M. E. et al. American Society of Clinical Oncology/College Of American Pathologists guideline recommendations for immunohistochemical testing of estrogen and progesterone receptors in breast cancer. J. Clin. Oncol. 28: 2784–2795 (2010). - PMC - PubMed
    1. Perou, C. M. et al. Molecular portraits of human breast tumours. Nature 406: 747–752 (2000). - PubMed
    1. Sorlie, T. et al. Gene expression patterns of breast carcinomas distinguish tumor subclasses with clinical implications. Proc. Natl Acad. Sci. USA 98: 10869–10874 (2001). - PMC - PubMed
    1. van 't Veer, L. J. et al. Gene expression profiling predicts clinical outcome of breast cancer. Nature 415: 530–536 (2002). - PubMed
    1. van de Vijver, M. J. et al. A gene-expression signature as a predictor of survival in breast cancer. N. Engl. J. Med. 347: 1999–2009 (2002). - PubMed