Universality and chaoticity in ultracold K+KRb chemical reactions
- PMID: 28722014
- PMCID: PMC5524979
- DOI: 10.1038/ncomms15897
Universality and chaoticity in ultracold K+KRb chemical reactions
Abstract
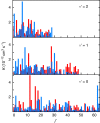
A fundamental question in the study of chemical reactions is how reactions proceed at a collision energy close to absolute zero. This question is no longer hypothetical: quantum degenerate gases of atoms and molecules can now be created at temperatures lower than a few tens of nanokelvin. Here we consider the benchmark ultracold reaction between, the most-celebrated ultracold molecule, KRb and K. We map out an accurate ab initio ground-state potential energy surface of the K2Rb complex in full dimensionality and report numerically-exact quantum-mechanical reaction dynamics. The distribution of rotationally resolved rates is shown to be Poissonian. An analysis of the hyperspherical adiabatic potential curves explains this statistical character revealing a chaotic distribution for the short-range collision complex that plays a key role in governing the reaction outcome.
Conflict of interest statement
The authors declare no competing financial interests.
Figures


 potential are shown by black and red lines, respectively. The grey shaded area indicates the closely spaced energetically allowed rotational levels of K2. The zero of energy is located at the dissociation limit of KRb and K2. (b) Reaction rate coefficients from J=0 EQM calculations based on either the full (black curves) or pairwise (red curves) potential as a function of collision energy in units of the Boltzmann constant. The total and vibrationally resolved reaction rate coefficients are shown. The green curve is the s-wave unitary rate coefficient for atom-dimer scattering. The closed circle with error bars (one s.d.) corresponds to an experimental measurement taken at a temperature of 250 nK. (c) Total reaction rate coefficient (green curve) as a function of temperature based on the J-shifting method and the J=0 EQM results for the full trimer potential. The black curve repeats this latter curve from (b) as a function of energy. The red curve shows the rate coefficient of the s-wave universal model (UM) as a function of collision energy, while the blue curve shows the UM data including all relevant partial waves as a function of temperature.


Similar articles
-
Non-adiabatic quantum interference in the ultracold Li + LiNa → Li2 + Na reaction.Phys Chem Chem Phys. 2021 Mar 11;23(9):5096-5112. doi: 10.1039/d0cp05499b. Phys Chem Chem Phys. 2021. PMID: 33576359
-
Direct observation of bimolecular reactions of ultracold KRb molecules.Science. 2019 Nov 29;366(6469):1111-1115. doi: 10.1126/science.aay9531. Science. 2019. PMID: 31780555
-
Quantum reactive scattering calculations for the cold and ultracold Li + LiNa → Li2 + Na reaction.J Chem Phys. 2021 Mar 28;154(12):124303. doi: 10.1063/5.0045712. J Chem Phys. 2021. PMID: 33810695
-
Bimolecular Chemistry in the Ultracold Regime.Annu Rev Phys Chem. 2022 Apr 20;73:73-96. doi: 10.1146/annurev-physchem-090419-043244. Epub 2021 Dec 10. Annu Rev Phys Chem. 2022. PMID: 34890257 Review.
-
Quantum control of reactions and collisions at ultralow temperatures.Chem Soc Rev. 2022 Mar 7;51(5):1685-1701. doi: 10.1039/d1cs01040a. Chem Soc Rev. 2022. PMID: 35169822 Review.
Cited by
-
Ultracold Molecular Collisions: Quasiclassical, Semiclassical, and Classical Approaches in the Quantum Regime.Chem Rev. 2025 Jul 23;125(14):6609-6652. doi: 10.1021/acs.chemrev.4c01014. Epub 2025 Jun 25. Chem Rev. 2025. PMID: 40558080 Free PMC article. Review.
-
Towards chemistry at absolute zero.Nat Rev Chem. 2021 Feb;5(2):125-140. doi: 10.1038/s41570-020-00239-0. Epub 2021 Jan 12. Nat Rev Chem. 2021. PMID: 37117610 Review.
-
Roaming pathways and survival probability in real-time collisional dynamics of cold and controlled bialkali molecules.Sci Rep. 2021 May 19;11(1):10598. doi: 10.1038/s41598-021-90004-0. Sci Rep. 2021. PMID: 34011983 Free PMC article.
-
Nonadiabatically Driven Quantum Interference Effects in the Ultracold K + KRb → Rb + K2 Chemical Reaction.J Phys Chem Lett. 2025 Jun 19;16(24):6171-6177. doi: 10.1021/acs.jpclett.5c01083. Epub 2025 Jun 11. J Phys Chem Lett. 2025. PMID: 40498682 Free PMC article.
-
Magnetization reversal driven by low dimensional chaos in a nanoscale ferromagnet.Nat Commun. 2019 Feb 1;10(1):543. doi: 10.1038/s41467-019-08444-2. Nat Commun. 2019. PMID: 30710092 Free PMC article.
References
-
- Ospelkaus S. et al.. Quantum-state controlled chemical reactions of ultracold potassium-rubidium molecules. Science 327, 853–857 (2010). - PubMed
-
- Bell M. T. & Softley T. P. Ultracold molecules and ultracold chemistry. Mol. Phys. 107, 99–132 (2009).
-
- Hutson J. M. Ultracold chemistry. Science 327, 788–789 (2010). - PubMed
-
- Carr L. D., DeMille D., Krems R. V. & Ye J. Cold and ultracold molecules: science, technology and applications. New J. Phys. 11, 055049 (2009).
-
- Krems R. V. Cold controlled chemistry. Phys. Chem. Chem. Phys. 10, 4079–4092 (2008). - PubMed
Publication types
LinkOut - more resources
Full Text Sources
Other Literature Sources

