. 2017 Jul 19:8:16027.
doi: 10.1038/ncomms16027.

Nanopore long-read RNAseq reveals widespread transcriptional variation among the surface receptors of individual B cells

Affiliations

Nanopore long-read RNAseq reveals widespread transcriptional variation among the surface receptors of individual B cells

Ashley Byrne et al. Nat Commun. .

Abstract

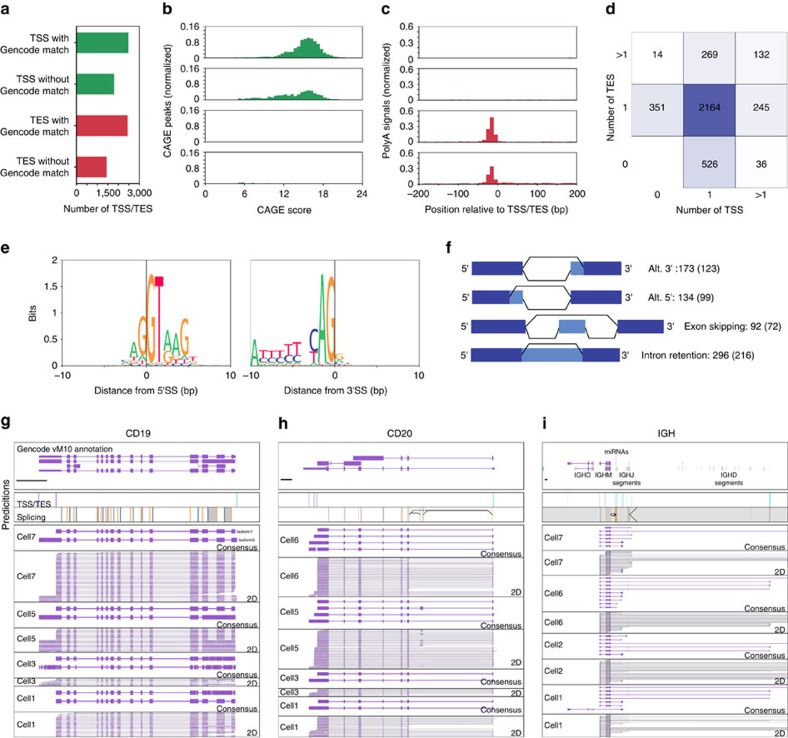
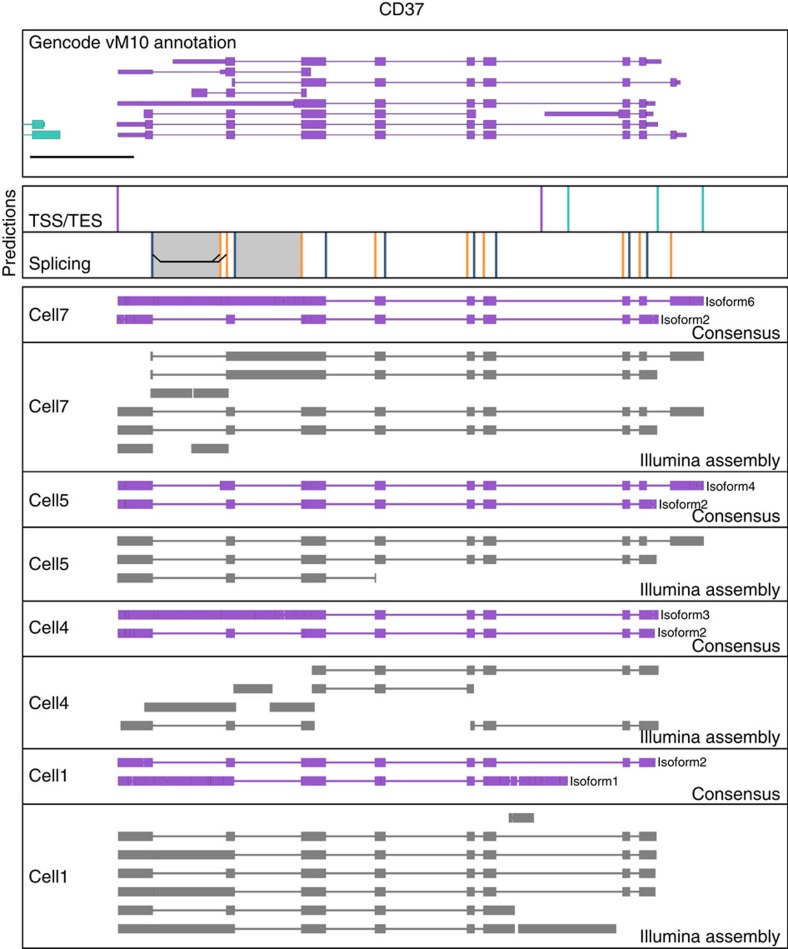
Understanding gene regulation and function requires a genome-wide method capable of capturing both gene expression levels and isoform diversity at the single-cell level. Short-read RNAseq is limited in its ability to resolve complex isoforms because it fails to sequence full-length cDNA copies of RNA molecules. Here, we investigate whether RNAseq using the long-read single-molecule Oxford Nanopore MinION sequencer is able to identify and quantify complex isoforms without sacrificing accurate gene expression quantification. After benchmarking our approach, we analyse individual murine B1a cells using a custom multiplexing strategy. We identify thousands of unannotated transcription start and end sites, as well as hundreds of alternative splicing events in these B1a cells. We also identify hundreds of genes expressed across B1a cells that display multiple complex isoforms, including several B cell-specific surface receptors. Our results show that we can identify and quantify complex isoforms at the single cell level.


Conflict of interest statement

M.A. is a paid consultant to Oxford Nanopore Technologies (Oxford, UK). The remaining authors declare no competing financial interests.

Figures

Figure 1
Figure 1. Experimental design and Oxford Nanopore sequencing read characteristics.
(a) Schematic of experimental design. FACS-sorted single B1a cells were lysed. PolyA-RNA was then reverse transcribed and PCR amplified using template switching. Full-length cDNA was split into two reactions. Half of the reaction was tagmented by Tn5 and sequenced using a Illumina HiSeq2500 sequencer. The other half of the reaction was ligated to ONT adaptors and sequenced on an ONT MinION sequencer. (b) Schematic of the Mandalorion pipeline used to analyse the ONT 2D read data.
Figure 2
Figure 2. ONT RNAseq recapitulates Illumina RNAseq gene expression quantification.
Scatter plot grid at the centre of the figure shows gene expression levels for each gene as determined by Illumina RNAseq and ONT RNAseq for the indicated cells. Correlations of gene expression levels are given as reads per gene per 10,000 reads (RPG10K) across seven single cells. Pearson r is given for each cell per sequencing method combination with each point representing transcript expression level (x-axes =Illumina and y-axes=ONT). Same cell comparisons have a blue border. ONT sequencing chemistry is shown on the right. Histograms found on the left and top of the figure represent number of genes found binned by their expression levels.
Figure 3
Figure 3. Quantifying gene and transcript expression with ONT RNAseq data.
(a) Stack barplots showing the number of genes detected in each cell corresponding to different sequencing technologies (Ill—Illumina, ONT—Oxford Nanopore). (b) Median expression levels of genes detected by both or individual technologies. Two expression levels (Ill and ONT) are given for genes detected in both technologies. (c) Gene length of genes detected by both or individual technologies. (d) Ratio of gene expression levels for genes detected by both technologies. Ratios are binned according to gene length and shown as boxplots with whiskers indicating 10th and 90th percentiles. (e) SIRV transcript levels of Replicate 1 (Rep1: 100fg SIRV pool E2) as measured with ONT RNAseq. Transcripts are binned by their starting molecule numbers. (f) SIRV transcript levels of Replicate 1 are plotted against transcript length with colours corresponding to groups in e. (g) Scatter plot showing correlation of SIRV transcript expression levels of Replicate 1 (Rep1: 100fg SIRV pool E2) and Replicate 2 (Rep2: 100 fg SIRV pool E2), both measured by ONT RNAseq. r-value shown is Pearson r. Colours corresponding to groups in e.
Figure 4
Figure 4. Identifying and quantifying transcript isoforms in SIRV E2 mixtures.
(a) Scatter plot shows correlation between ONT 2D reads and the SIRV transcripts they align to. Pearson r is shown. Colouring is as indicated in Fig. 3e–g (b) Distance between read alignment ends and transcript ends are shown as heatmap with the colour indicating the normalized alignment numbers. 90% of read alignments terminated outside the red lines (c) Genome Browser view of SIRV3(c) and SIRV6(d) gene loci. Top box contains transcript annotations with black 1 kb scale bar in bottom left corner, second and third box contain TSS (Teal)/TES (Purple) and splice sites (yellow: 5′SS, blue: 3′SS) locations predicted from the read data, respectively. Black lines and grey areas in box 3 indicate alternative splicing and intron retention events predicted from the read data. Box 4 contains read alignments of isoform consensus reads. Box 5 contains ONT 2D read alignments. Direction of transcripts, isoform consensus, and ONT 2D reads are indicated by their colour (Teal: 5′ to 3′, Purple: 3′ to 5′). (d) Scatter plot shows correlation between SIRV transcript quantification by aligning to annotated transcripts or by annotation-independent isoform grouping using Mandalorion. Pearson r is shown.
Figure 5
Figure 5. Analysis of ONT RNAseq data identifies isoform features in mouse B1a cells.
(a) TSSs and TESs predicted based on read data were separated into sites with or without GENCODE vM10 annotation matches. (b,c) TSSs/TESs with or without GENCODE matches were tested for FANTOM5 CAGE area enrichment (b) and polyA signals (c). (d) Overlap of TSSs and TESs with genes. Genes were sorted according to the number of TSSs and TESs they overlapped with. (e) Predicted base composition at 5′ and 3′ SS based on read data is shown as sequences logos. (f) Schematic for detection and corresponding number of detected alternative splice site combinations. Values in parentheses represent number of alternative splicing events validated using Illumina data. (gi) Genome Browser view of CD19, CD20 and IGH gene loci as shown in Fig. 4. ONT 2D reads and consensus sequence alignments are shown for the indicated cells. Splice sites for the highly repetitive IGH locus were not considered for isoform grouping due to the difficulty of aligning reads unambigiously.
Figure 6
Figure 6. Uncovering isoform diversity in B cell surface receptors.
Genome Browser view of the CD37 is shown as in Fig. 4. In addition to isoform consensus derived from ONT 2D reads, contigs assembled from Illumina data using Trinity are shown in grey for the indicated cells.

References

    1. Wu A. R. et al.. Quantitative assessment of single-cell RNA-sequencing methods. Nat. Methods 11, 41–46 (2014). - PMC - PubMed
    1. Treutlein B. et al.. Reconstructing lineage hierarchies of the distal lung epithelium using single-cell RNA-seq. Nature 509, 371–375 (2014). - PMC - PubMed
    1. Shalek A. K. et al.. Single-cell transcriptomics reveals bimodality in expression and splicing in immune cells. Nature 498, 236–240 (2013). - PMC - PubMed
    1. Welch J. D., Hu Y. & Prins J. F. Robust detection of alternative splicing in a population of single cells. Nucleic Acids Res. 44, e73 (2016). - PMC - PubMed
    1. Stamm S. et al.. Function of alternative splicing. Gene 344, 1–20 (2005). - PubMed

Publication types