

Sub-national mapping of population pyramids and dependency ratios in Africa and Asia
- PMID: 28722706
- PMCID: PMC5516541
- DOI: 10.1038/sdata.2017.89
Sub-national mapping of population pyramids and dependency ratios in Africa and Asia
Abstract
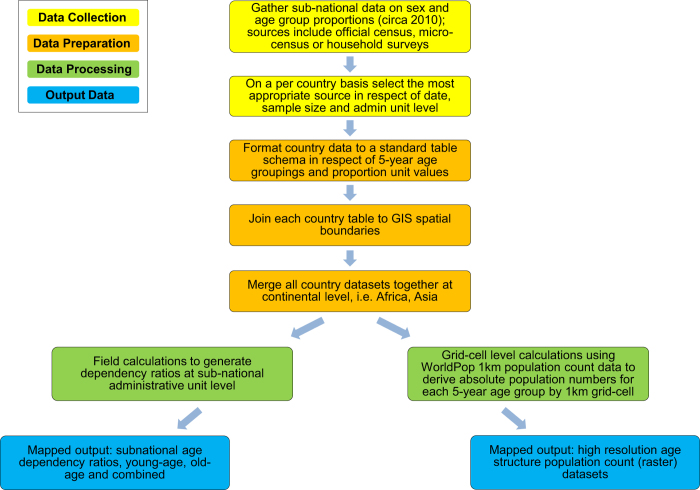
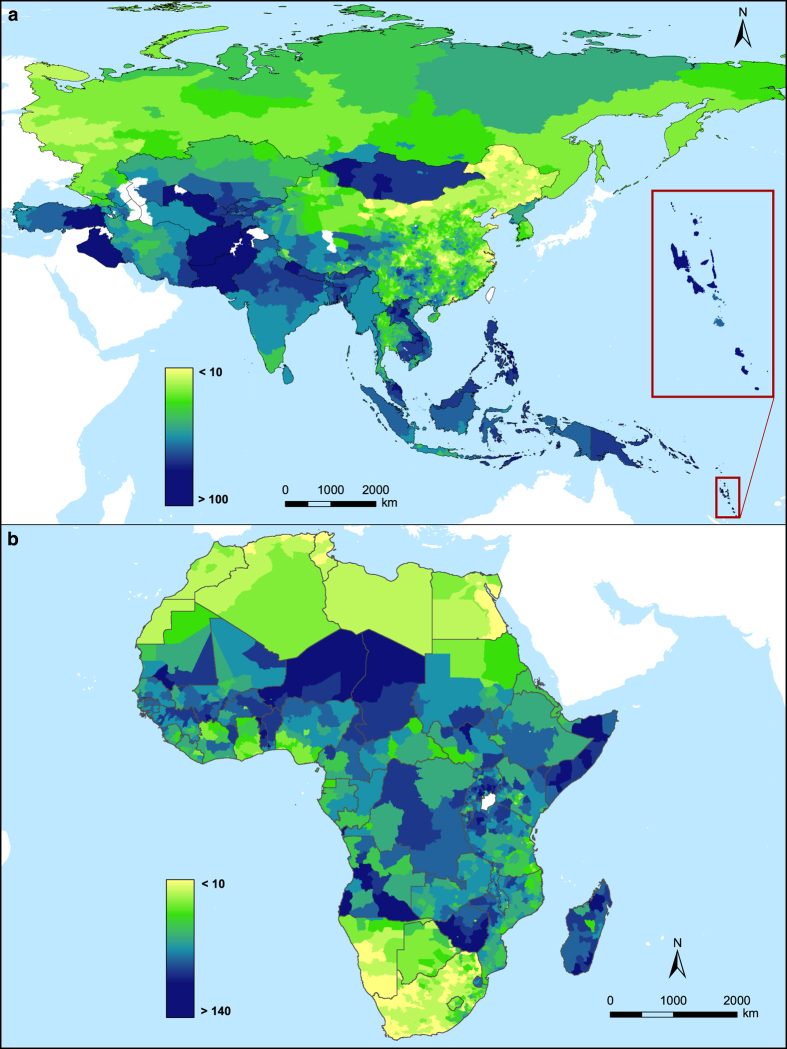
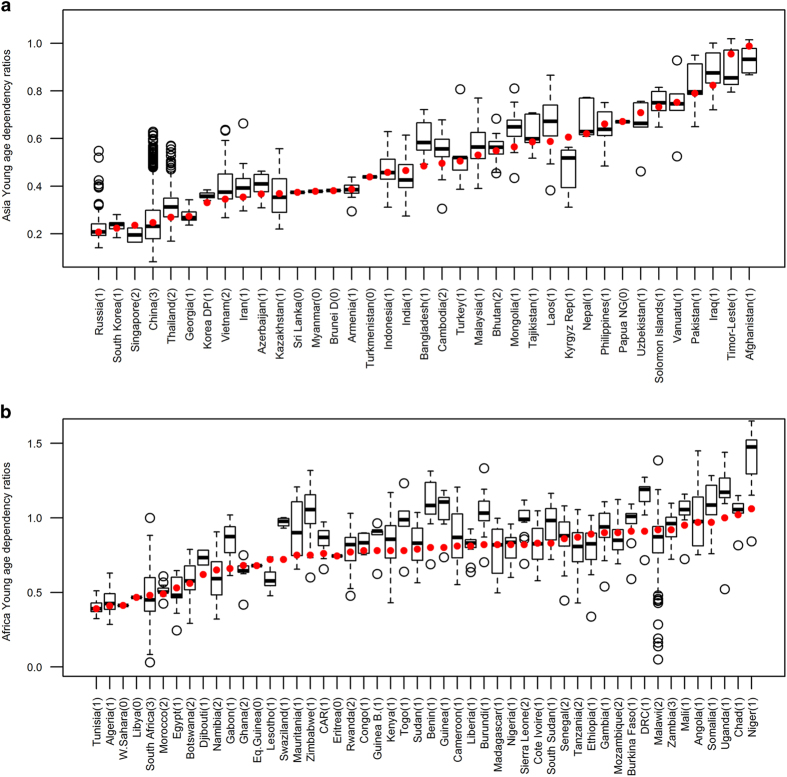
The age group composition of populations varies substantially across continents and within countries, and is linked to levels of development, health status and poverty. The subnational variability in the shape of the population pyramid as well as the respective dependency ratio are reflective of the different levels of development of a country and are drivers for a country's economic prospects and health burdens. Whether measured as the ratio between those of working age and those young and old who are dependent upon them, or through separate young and old-age metrics, dependency ratios are often highly heterogeneous between and within countries. Assessments of subnational dependency ratio and age structure patterns have been undertaken for specific countries and across high income regions, but to a lesser extent across the low income regions. In the framework of the WorldPop Project, through the assembly of over 100 million records across 6,389 subnational administrative units, subnational dependency ratio and high resolution gridded age/sex group datasets were produced for 87 countries in Africa and Asia.
Conflict of interest statement
The authors declare no competing financial interests.
Figures

References
Data Citations
-
- Pezzulo C. 2017. Harvard Dataverse. http://dx.doi.org/10.7910/DVN/S5JHQN - DOI
-
- Pezzulo C. 2017. Harvard Dataverse. http://dx.doi.org/10.7910/DVN/6TPPZ8 - DOI
-
- Pezzulo C. 2017. Harvard Dataverse. http://dx.doi.org/10.7910/DVN/4MJN3G - DOI
-
- Pezzulo C. 2017. Harvard Dataverse. http://dx.doi.org/10.7910/DVN/GUSJUZ - DOI
References
-
- United Nations. World Population Prospects: The 2015 Revision, Key Findings and Advance Tables. Department of Economic and Social Affairs, Population Division (UNDESA) (2015).
-
- United Nations. Population Dynamics in the Post-2015 Development Agenda: Report of the Global Thematic Consultation on Population Dynamics. United Nations Population Fund (2013).
-
- Herrmann M. Factoring population dynamics into sustainable development. Development Co-operation Report 2012: Lessons in Linking Sustainability and Development (OECD), ; DOI: 10.1787/dcr-2012-11-en (2012). - DOI
-
- Das Gupta M., Bongaarts J. & Cleland J. Population, Poverty, and Sustainable Development: A Review of the Evidence (World Bank, 2011).
-
- Bongaarts J. in Population Matters: Demographic Change, Economic Growth, and Poverty in the Developing World (Oxford University Press, 2001).
Publication types
MeSH terms
Grants and funding
LinkOut - more resources
Full Text Sources
Other Literature Sources
