. 2017 Jul 19;13(7):e1006909.
doi: 10.1371/journal.pgen.1006909. eCollection 2017 Jul.

Termination factor Rho: From the control of pervasive transcription to cell fate determination in Bacillus subtilis

Affiliations

Termination factor Rho: From the control of pervasive transcription to cell fate determination in Bacillus subtilis

Vladimir Bidnenko et al. PLoS Genet. .

Abstract

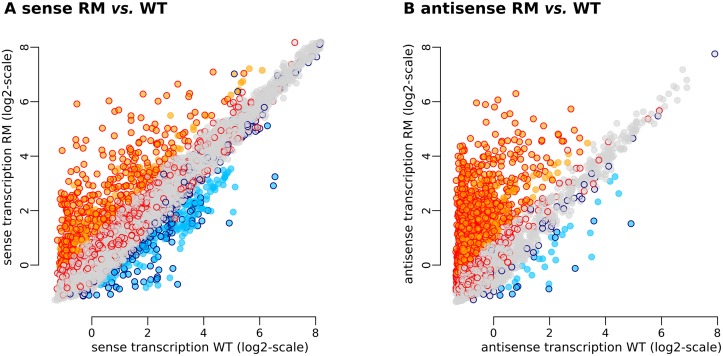
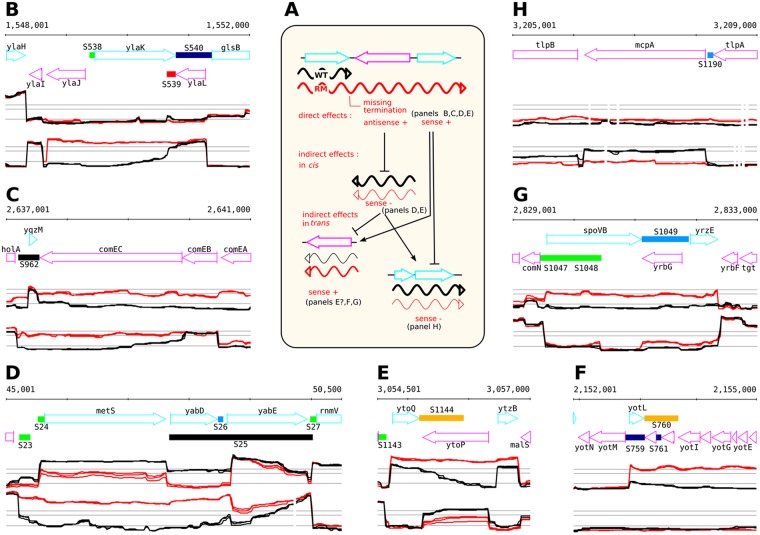
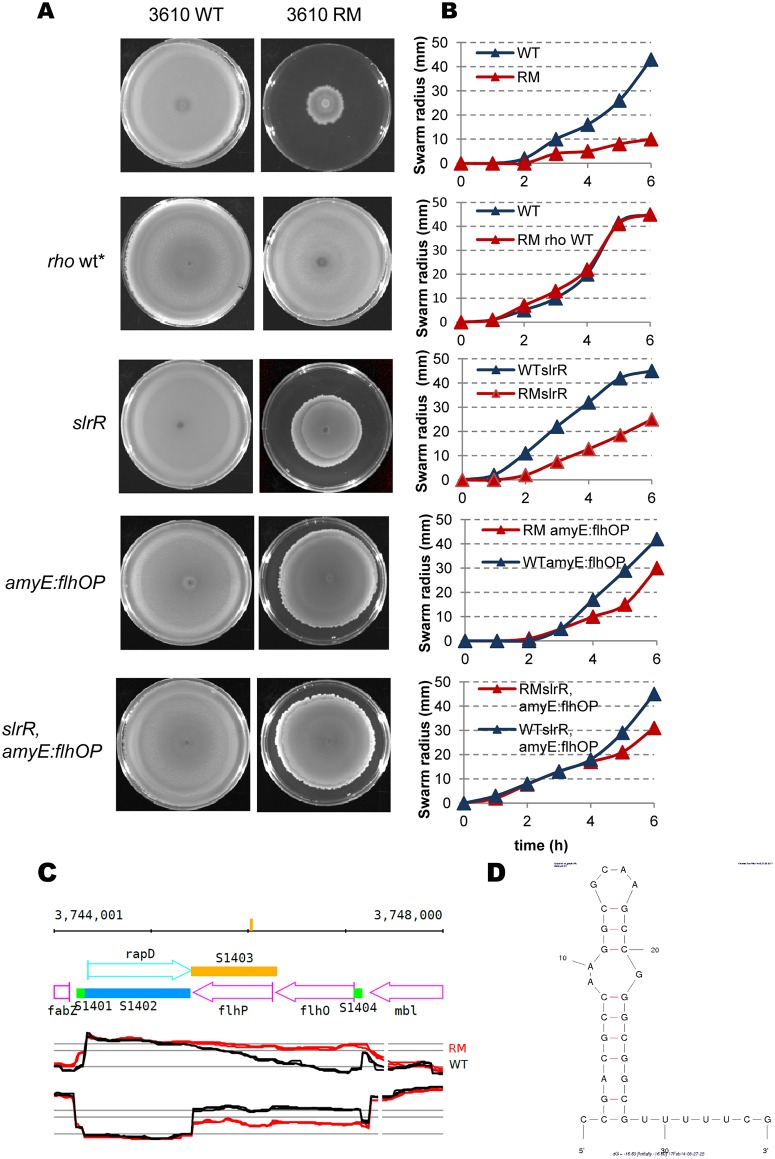
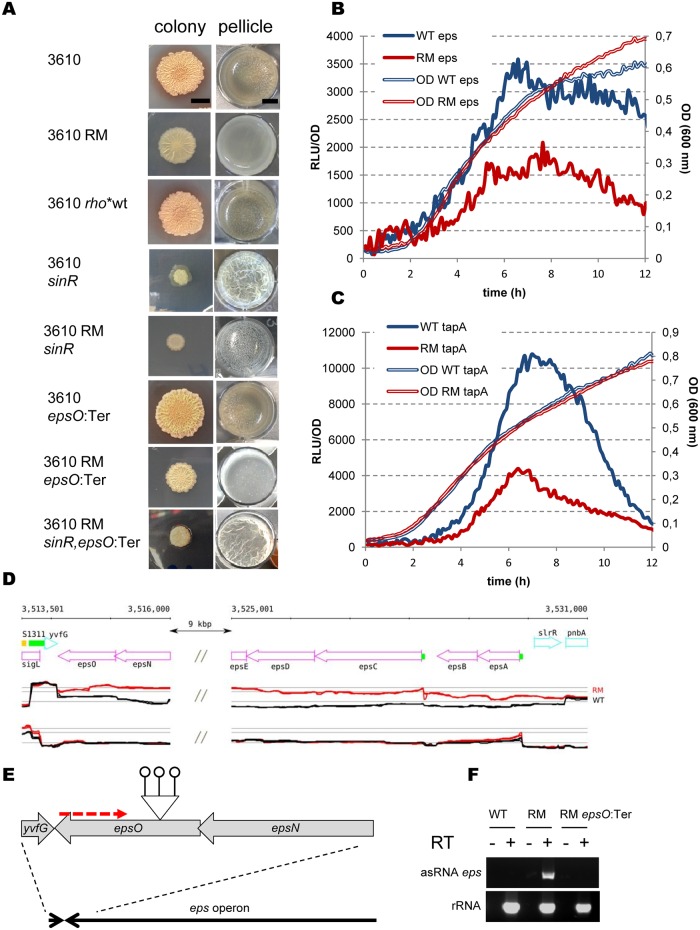
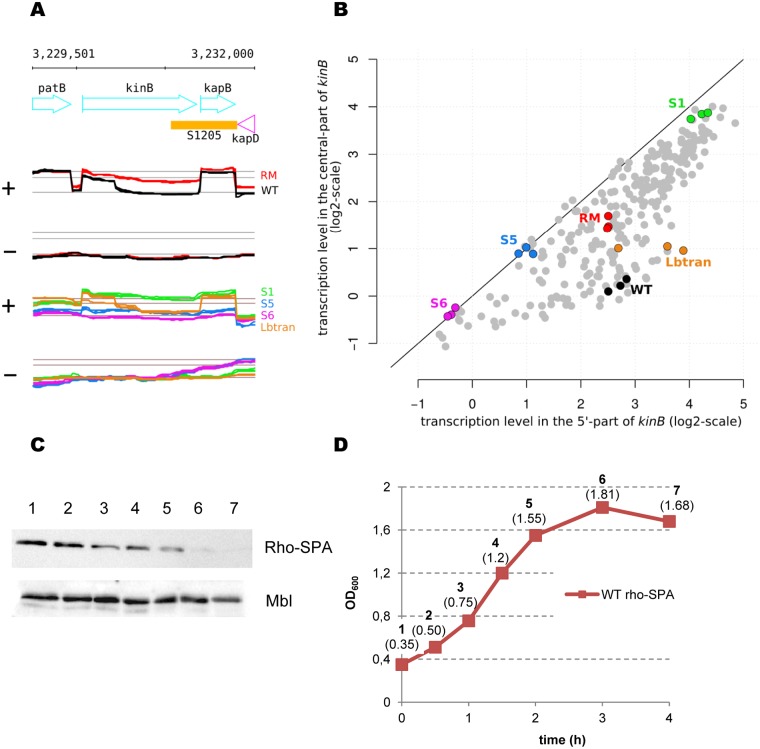
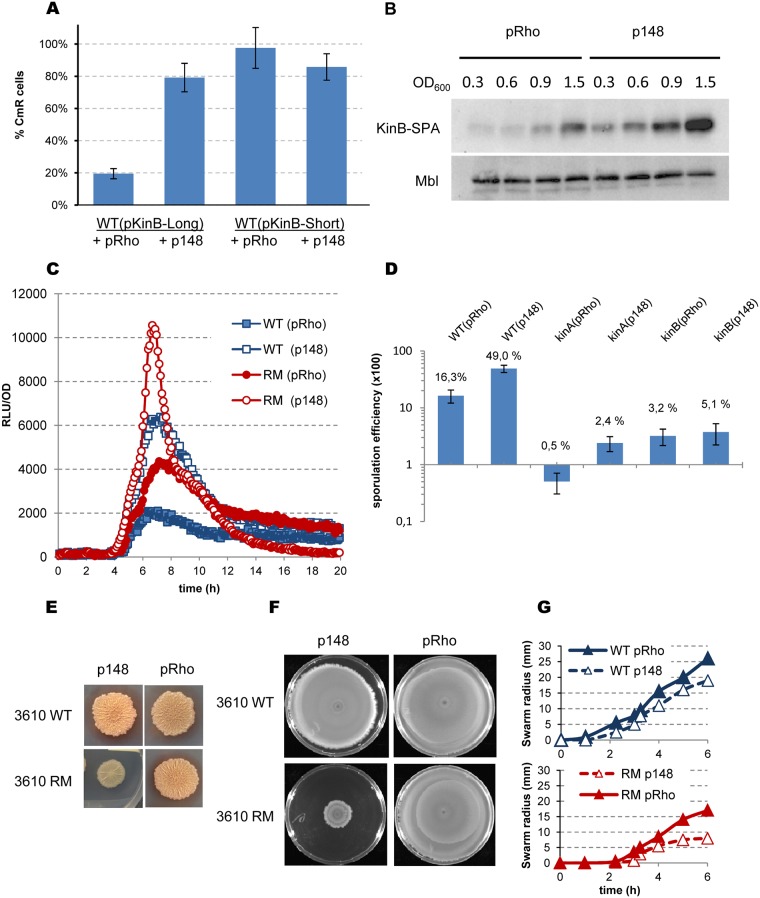
In eukaryotes, RNA species originating from pervasive transcription are regulators of various cellular processes, from the expression of individual genes to the control of cellular development and oncogenesis. In prokaryotes, the function of pervasive transcription and its output on cell physiology is still unknown. Most bacteria possess termination factor Rho, which represses pervasive, mostly antisense, transcription. Here, we investigate the biological significance of Rho-controlled transcription in the Gram-positive model bacterium Bacillus subtilis. Rho inactivation strongly affected gene expression in B. subtilis, as assessed by transcriptome and proteome analysis of a rho-null mutant during exponential growth in rich medium. Subsequent physiological analyses demonstrated that a considerable part of Rho-controlled transcription is connected to balanced regulation of three mutually exclusive differentiation programs: cell motility, biofilm formation, and sporulation. In the absence of Rho, several up-regulated sense and antisense transcripts affect key structural and regulatory elements of these differentiation programs, thereby suppressing motility and biofilm formation and stimulating sporulation. We dissected how Rho is involved in the activity of the cell fate decision-making network, centered on the master regulator Spo0A. We also revealed a novel regulatory mechanism of Spo0A activation through Rho-dependent intragenic transcription termination of the protein kinase kinB gene. Altogether, our findings indicate that distinct Rho-controlled transcripts are functional and constitute a previously unknown built-in module for the control of cell differentiation in B. subtilis. In a broader context, our results highlight the recruitment of the termination factor Rho, for which the conserved biological role is probably to repress pervasive transcription, in highly integrated, bacterium-specific, regulatory networks.


Conflict of interest statement

The authors have declared that no competing interests exist.

Figures

Fig 1
Fig 1. Genome wide effects of rho deletion on the B. subtilis transcriptome during exponential growth in rich medium.
(A and B) Transcriptome changes in the sense and antisense strands, respectively. Each point represents one of the 5875 native TRs. Coordinates on x- and y-axes correspond to the normalized expression level (average of three biological replicates) measured with tiling arrays in B. subtilis 1012 WT and RM, respectively. Background colors of the points indicate TRs whose transcription level is strongly up-regulated (orange) or down-regulated (light blue) in the RM vs. WT comparison made in B. subtilis 1012 by tiling arrays. Contour colors of the points indicate TRs whose transcription level is strongly up-regulated (red) or down-regulated (dark blue) in the RM vs. WT comparison made in B. subtilis NCIB 3610 by RNA-Seq.
Fig 2
Fig 2. A typology of the different effects of rho deletion on the transcriptome.
(A) Schematic illustration of the possible direct and indirect effects of Rho-controlled transcription. In WT, transcription terminates at Rho-controlled terminator (transcript is shown in black). In the RM, transcription is a result of missing termination (Rho-controlled transcript is shown in red). The transcript can be sense or antisense with respect to the orientation of the downstream genes. (B and C) Examples of direct up-regulation downstream of sites were termination is impaired in RM. (D and E) Examples of sense down-regulation facing up-regulated antisense transcripts arising from impaired termination in the RM. These down-regulations are presumably caused by indirect effects in cis. (F, G and H) Examples of up- or down-regulation occurring in chromosomal regions without visible impaired termination events. These are presumably caused by indirect effects in trans. Sections show annotated genome (top) and expression profiles on the (+) and (–) strands (mid and bottom sections, respectively). WT (black) and RM (red) profiles are shown. Expression profiles are from the B. subtilis expression data browser (http://genome.jouy.inra.fr/cgi-bin/seb/index.py).
Fig 3
Fig 3. Impact of Rho inactivation on swarming motility of B. subtilis cells.
(A) Motility defect of the NCIB 3610 RM cells can be partially suppressed by the deletion of slrR and ectopic expression of flhO-flhP genes. Bacterial cultures were grown to an OD600 0.5, concentrated and spotted on the plate as described (Materials and methods). The images were acquired after 20 hours of incubation at 37°C. Each icon represents top-grown image of centrally inoculated Petri plate (diameter 9 cm) containing LB and 0.7% of agar. Relevant genotypes are indicated on the side of each image. The repaired back to the wild type NCIB 3610 RM is denoted as rho wt*. The experiment was reproduced at least five times and included three biological replicas for each strain. The results from the representative experiment are presented. (B) Quantitative swarming assay of the indicated NCIB 3610 (blue lines) and isogenic NCIB 3610 RM (red lines) derivative strains. Values represent the mean of at least five experiments. (C) Impact of rho deletion on sense and antisense transcription of the flhO-flhP operon in the B. subtilis 1012 cells. Expression profiles are from the B. subtilis expression data browser (http://genome.jouy.inra.fr/cgi-bin/seb/index.py). Vertical bar on the top line indicates position of predicted putative terminator (shown in D). Sections show annotated genome (top) and expression profiles on the (+) and (–) strands (mid and bottom sections). Wild type (black) and RM (red) profiles are shown. (D) MFOLD [83] predicted secondary structure (ΔG = −16, 30) within flhP asRNA.
Fig 4
Fig 4. Rho inactivation negatively affects biofilm formation in B. subtilis.
(A) Colony (left column) and pellicle (right column) biofilm formation by B. subtilis NCIB 3610 WT and RM strains. Relevant genotypes are indicated on the side of each image. The colony column shows individual colonies grown on MSgg agar medium for 72h at 30°C. The scale bar is 5mm. The pellicle column shows microtitre wells (diameter 1.5 cm) in which cells were grown in MSgg medium without agitation for 72h at 30°C. The scale bar is 5 mm. For the colony assay, 2μl of culture was spotted onto MSgg agar plate. For pellicle assay, 2μl of culture was added to 2ml of MSgg medium in a well of 24-well sterile microtiter plate. The experiment was reproduced at least five times including four replicas for each strain. Presented are the results from the representative experiment. (B and C) Rho inactivation decreases expression of biofilm-specific genes. Promoters of the operons epsA-O (B) and tapA-sipW-tasA (C) encoding exopolysaccharides and amyloid-like protein fibers, respectively, were fused to the butterfly luciferase gene luc and tested for transcription activity in B. subtilis BSB1 WT (blue lines) and RM (red lines) cells grown in liquid biofilm-stimulating medium MSgg as described in Materials and Methods. The thin double lines depict growth curves measured by optical density OD 600nm and the thick lines show relative luminescence readings corrected for OD. The unmarked individual points of the curves are the means of the values measured at the 5 min intervals in four independent isogenic cultures during the same experiment. The experiment was reproduced three times and the results of the representative one are shown. (D) B. subtilis genomic region corresponding to the epsA-O operon shows asRNA of ~15740 nt long starting from the epsO gene and overlapping the entire operon in 1012 RM strain. The double slash marks represent internal part of eps operon (epsE-epsF-epsH-epsI-epsJ-epsK-epsL-epsM-epsN) that is not shown (the whole operon can be visualized on http://genome.jouy.inra.fr/cgi-bin/seb/index.py). Sections show annotated genome (top) and expression profiles of WT (black) and RM (red) on the (+) and (–) strands (mid and bottom sections). (E) Schematic illustration of the construction of NCIB 3610 epsO:Ter insertion mutant. Bars tipped with open circles and red dotted arrow denote Rho-independent terminators and eps asRNA respectively; elements not to scale. (F) RT-PCR analysis of antisense transcription of eps operon region (top section) in the NCIB 3610 WT and RM strains. RT-PCR analysis of rRNA (bottom section) was used as a control. Synthesis of cDNA was performed using 50 ng of total RNA as template (Materials and methods). Reactions were performed with (+) and without (-) reverse transcriptase (RT). PCR was done with oligonucleotides specific for eps asRNA within epsK gene (asRNA eps) and for rRNA (rRNA) (S7 Table).
Fig 5
Fig 5. Rho inactivation increases expression of KinA and KinB kinases.
WT (W) and RM (r) cells containing kinA-SPA or kinB-SPA translational fusions at natural chromosomal loci were grown in LB (lanes 1–4) or sporulation-inducing DS medium (lanes 5–10) to mid-exponential (expo; OD600 ∼ 0.5) or stationary (stat; OD600∼ 1.5) phases and analyzed for KinA and KinB proteins using ANTI-FLAG M2 monoclonal antibodies. Equal amounts of protein were loaded onto the gel as quantified by the Bradford assay. To control equilibrium between the samples, total protein extracts from cells with kinB-SPA fusion were analyzed for MreB protein using anti-MreB specific antibodies.
Fig 6
Fig 6. Rho inactivation increases Spo0A phosphorylation.
B. subtilis BSB1 WT (blue lines) and RM (red lines) cells bearing transcription fusions of luciferase gene luc with the promoters of spo0A (A and B; solid lines), tapA (A; lines with squares), spoIIAA (C) and gerE (D) genes were analyzed for Luc expression during growth in biofilm-promoting MSgg medium (A) and sporulation-inducing DS medium (B, C and D) as described in Materials and Methods. Measurements were taken every 5 minutes after cells inoculation in media at optical density OD600 ∼0.025 (time point 0). For each strain, plotted are the mean values of luminescence readings corrected for OD from four independent cultures analyzed simultaneously. In (A and B), double-lined curves depict characteristic growth kinetics of cells measured by OD 600nm. In (B), arrow indicates entry in sporulation (T0) as established in [96]. In (C) and (D), shadowed double-lined curves reproduce kinetics of spo0A expression established in (B) during the same experiment. The experiment was reproduced at least three times. The results from the representative experiment are presented.
Fig 7
Fig 7. Rho inactivation accelerates sporulation of B. subtilis cells.
(A) Sporulation kinetics of B. subtilis BSB1 WT and RM cells. Cells were grown in sporulation-inducing DS medium at 37°C with vigorous aeration up to OD600 1.5. Starting from this time-point (sporulation point T0), samples were taken from cultures each hour and analyzed for spores by heating at 75°C as described in Materials and Methods. Sporulation efficiency was estimated as proportion of viable cells in the heated and unheated cultures. Plotted are the average values and standard deviations from four independent experiments each incorporating three biological replicas of each strain. (B) Sporulation efficiency of the BSB1, PY79, NCIB 3610 and TF8A WT strains and their respective RM derivatives at sporulation point T7. Cells were grown in DS medium during seven hours after T0 and analyzed for heat resistant spores as described in (A). (C) Sporulation efficiency of the BSB1 WT, BSB1 RM strains and their respective kinA and kinB mutants. Cells were inoculated in DS medium at OD600 0.05, incubated at 37° during 20 hours and analyzed for spores as in (A). Totally, nine biological replicas of each strain were analyzed for (B) and twelve replicas for (C) in three independent experiments. Plotted are the average values with standard deviation error bars. (D) Kinetics of luciferase expression from spoIIA-luc fusion in the BSB1 WT (blue lines), BSB1 RM (red lines) and their respective kinA (light lines) and kinB (double lines) derivatives during growth in DS medium as described in Materials and Methods. For each strain, plotted are the mean values of relative luminescence readings corrected for OD from four independent cultures analyzed simultaneously. The experiment was reproduced at least three times. The results from the representative experiment are presented.
Fig 8
Fig 8. B. subtilis kinB gene contains intragenic Rho-dependent terminator.
(A and B) Schema of the experimental design used for analysis of the kinB putative Rho-dependent terminator. (A) Cartoon of the kinB expression unit and the expression profiles of kinB in the WT (black) and RM (red) cells [17]. (B) Transcription initiation region (small red rectangle) and the 5’-terminal parts of kinB gene were cloned at the plasmid pGKV210 [116] upstream the promoter-less chloramphenicol-resistance gene (open arrow). The cloned fragments are delineated by the dotted lines. (C) Rho activity determines cellular resistance to chloramephenicol. B. subtilis BSB1 WT and RM cells containing pKinB-Short (pKinB-S) and pKinB-Long (pKinB-L) plasmids were grown to OD 0.5 and platted in sequential dilutions at the LB-plates containing or not chloramphenicol (Cm) at the indicated concentrations (μg/ml). Cm-resistant cells were scored after 24 hours of incubation at 37°C and compared to total number of viable cells. The bars represent average values from three independent experiments totally including twelve biological replicas for each strain. (D-G) Initiation rate of kinB translation negatively affects efficiency of Rho-dependent intragenic termination of kinB transcription. (D) Nucleotide sequence of the translation initiation regions (TIR) carrying native (RBSwt; [112]) and the modified strong (RBSm+) or weak (RBSm-) ribosome binding sites. The RBS sequences are bolded and underlined. The whole modifications of TIR sequences are bolded and in italics. The kinB transcriptional start (+1) and ATG codon are underlined. (E, F) B. subtilis BSB1 WT cells carrying pKinB-S or pKinB-L plasmids with different kinB RBS (RBSwt, RBSm+ and RBSm-) were analyzed for Cm-resistance as described in (C). (E) Modifications of kinB RBS have no effect on Cm-resistance when plasmids do not contain transcription terminator within kinB (pKinB-S). (F) In the presence of kinB transcription terminator, the level of Cm-resistance depends on the strength of kinB RBS (pKinB-L). (G) The pKinB-L-RBSm- plasmid with a weak RBS determines high level of Cm-resistance after Rho inactivation in RM cells. Each experiment depicted in (E-G) included three biological replicas of each strain and was repeated at least three times. The data for WT cells with pKinB-S and pKinB-L plasmids presented in (E) and (F) are independent from (C).
Fig 9
Fig 9. Rho-mediated control of kinB transcription is removed during sporulation.
(A) The kinB gene is expressed differently during sporulation. Top and middle panels: Annotated genome and transcriptional profiles of kinB gene on the coding (+) and uncoding (−) strands in WT (black) and RM (red) cells during exponential growth in LB medium. Bottom panels: Transcriptional profiles of kinB gene in WT cells during transition phase (LBtran, orange), early (S1, green) and late (S5, blue and S6, pink) sporulation stages at both strands. The only normalization applied to the LBtran, S1, S5, and S6 profiles consisted in subtracting the chromosome median, whereas the RM and WT were subjected to the normalization procedure described in the Matherials and Methods section. The expression profiles are from [17] and include three biological replicas. (B) Comparison of expression levels between the 5’- and central parts of kinB gene across B. subtilis growth conditions represented by 269 re-annotated RNA samples collected for the wild-type [17]. The highlighted points correspond to the WT profiles shown in panel (A): LBtran (orange), S1 (green), S5 (blue), S6 (pink); and RM (red) and WT (black) during exponential growth in LB. Detailed values are provided in S5 Table. (C and D) Intracellular levels of Rho decrease during sporulation. B. subtilis BSB1 WT cells containing rho-SPA translational fusion at natural chromosomal locus were grown in sporulation- inducing DS medium at 37°C. Samples were taken at the indicated OD600 (D) and analyzed for Rho-SPA protein (C) as described in Materials and Methods. The three last samples (5 to 7) were taken from the sporulating cultures with a one-hour interval. To control equilibrium between the samples established by the Bradford analysis, total protein extracts were analyzed for Mbl protein using anti-Mbl specific antibodies. The experiment was reproduced three times. The results from the representative experiment are presented.
Fig 10
Fig 10. Effects of Rho over-expression in B. subtilis cells.
(A) Over-expression of Rho reinforces Rho-dependent termination within kinB gene. The analysis of chloramphenicol-resistance of the BSB1 WT cells containing pKinB-L or pKinB-S plasmids described in Fig 8C was reproduced in the presence of Rho over-producing plasmid pRho or the control p148 vector; the applied concentration of Cm 3μg/ml. The experiment was repeated three times with nine biological replicas of each strain. (B) Over-expression of Rho suppresses synthesis of KinB in B. subtilis BSB1 WT cells. B. subtilis cells containing kinB-SPA translational fusion at natural chromosomal loci and pRho or p148 plasmids were grown in sporulation-inducing DS medium at 37°C to indicated OD600 and analyzed for KinB-SPA protein as described in Materials and Methods. To control equilibrium between the samples, total protein extracts were analyzed for Mbl protein using anti-Mbl specific antibodies. The experiment was reproduced twice. (C and D) Over-expression of Rho reduces sporulation. (C) Kinetics of luciferase expression from spoIIA-luc fusion in BSB1 WT (blue squares) and RM (red circles) cells in the presence of pRho (filled-in symbols) or p148 (opened symbols) plasmids. The experiments were performed as in Fig 6 three times. The results from the representative experiment are shown. (D) Analysis of the sporulation efficiency of B. subtilis BSB1 WT, BSB1 kinA and BSB1 kinB mutant cells containing pRho or p148 plasmids was performed as in Fig 7C after 20 hours of incubation in DS medium. Average values and standard deviations from three independent experiments are multiplied by 100 and plotted in a log10 scale. In total, twelve biological replicas of each strain were analyzed. (E) Colony biofilm formation by B. subtilis NCIB 3610 WT and RM cells containing pRho plasmid or p148 vector. Relevant genotypes are indicated on the side of each image. Each icon represents image of individual colonies grown on MSgg agar medium for 72h at 30°C. The experiment was reproduced at least five times. The results from the representative experiment are presented. (F and G) Over-expression of Rho reinforces cells motility. (F) Swarming motility of NCIB 3610 WT and NCIB 3610 RM containing pRho plasmid or p148 vector was assayed as in Fig 3 using LB 0.7% agar plates. The images were acquired after 20 hours of incubation at 37°C. The experiment was performed five times. The results from the representative experiment are shown. (G) Quantitative swarming assay of the NCIB 3610 (blue) and NCIB 3610 RM (red) strains containing pRho plasmid (solid lines; filled-in triangles) or p148 vector (dotted lines; empty triangles). Values represent the mean of five experiments including two replicas for each strain.

References

    1. Libri D. Sleeping Beauty and the Beast (of pervasive transcription). RNA. 2015; 21: 678–679. doi: 10.1261/rna.050948.115 - DOI - PMC - PubMed
    1. Kapranov P, Willingham AT, Gingeras TR. Genome-wide transcription and the implications for genomic organization. Nat Rev Genet. 2007; 8: 413–423. doi: 10.1038/nrg2083 - DOI - PubMed
    1. Berretta J, Morillon A. Pervasive transcription constitutes a new level of eukaryotic genome regulation. EMBO Rep. 2009; 10: 973–982. doi: 10.1038/embor.2009.181 - DOI - PMC - PubMed
    1. Canny SP, Reese TA, Johnson LS, Zhang X, Kambal A, Duan E, et al. Pervasive transcription of a herpesvirus genome generates functionally important RNAs. MBio. 2014; 5: e01033–13. doi: 10.1128/mBio.01033-13 - DOI - PMC - PubMed
    1. Lybecker M, Bilusic I, & Raghavan R. Pervasive transcription: detecting functional RNAs in bacteria. Transcription. 2014; 5: e944039 doi: 10.4161/21541272.2014.944039 - DOI - PMC - PubMed

MeSH terms

LinkOut - more resources