Case Reports
. 2017 Jul 19;9(1):67.
doi: 10.1186/s13073-017-0452-y.

Novel promoters and coding first exons in DLG2 linked to developmental disorders and intellectual disability

Affiliations
Case Reports

Novel promoters and coding first exons in DLG2 linked to developmental disorders and intellectual disability

Claudio Reggiani et al. Genome Med. .

Abstract

Background: Tissue-specific integrative omics has the potential to reveal new genic elements important for developmental disorders.

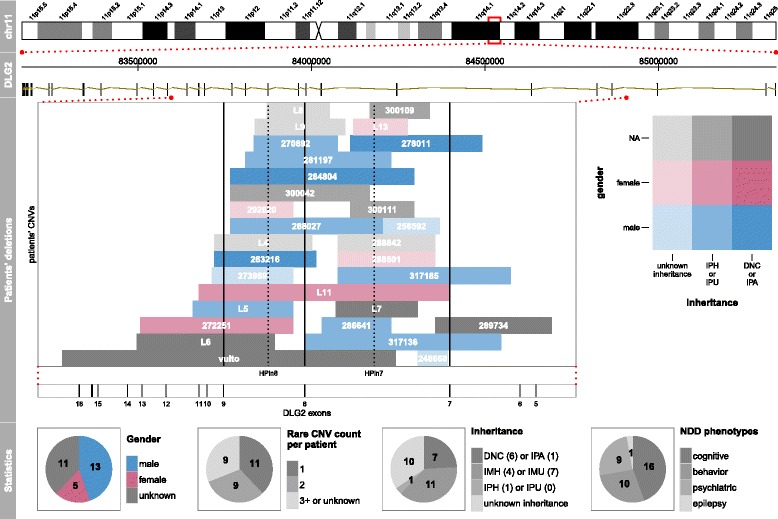
Methods: Two pediatric patients with global developmental delay and intellectual disability phenotype underwent array-CGH genetic testing, both showing a partial deletion of the DLG2 gene. From independent human and murine omics datasets, we combined copy number variations, histone modifications, developmental tissue-specific regulation, and protein data to explore the molecular mechanism at play.

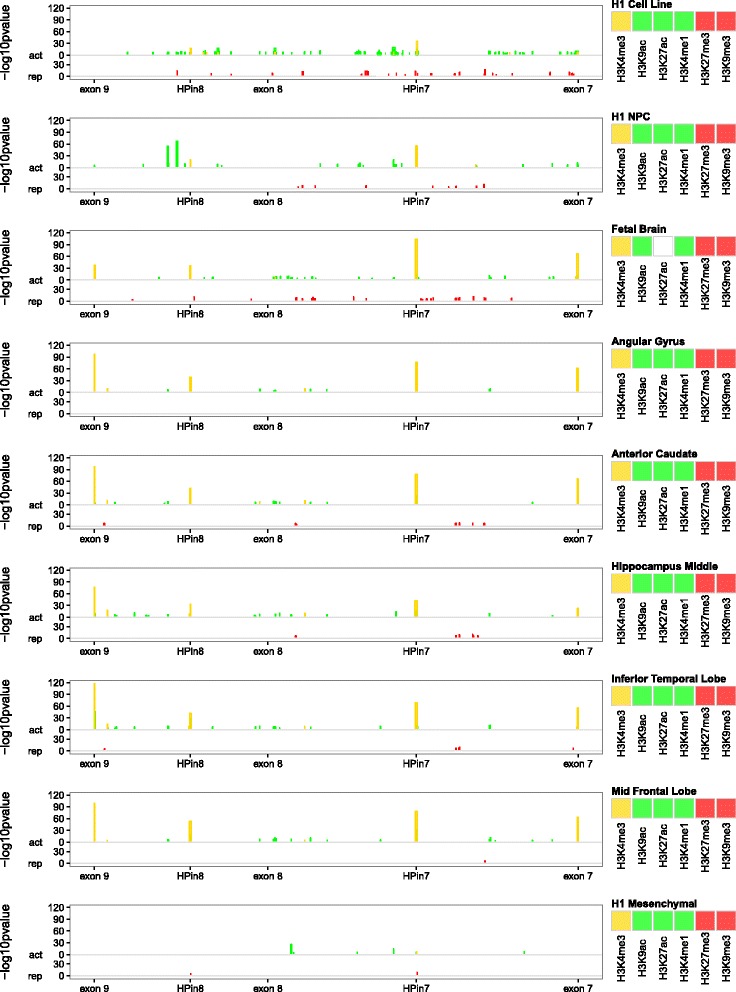
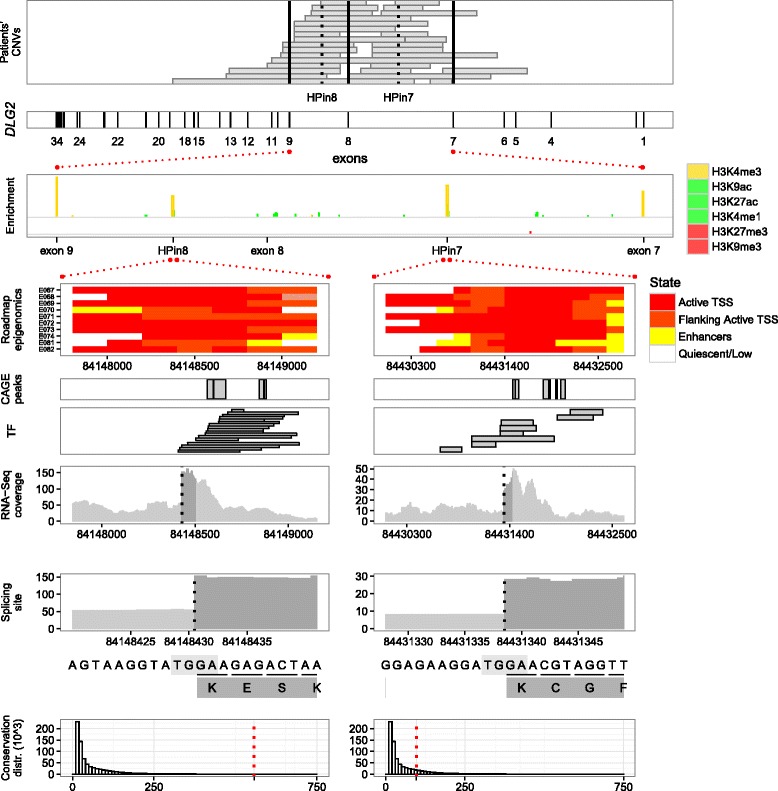
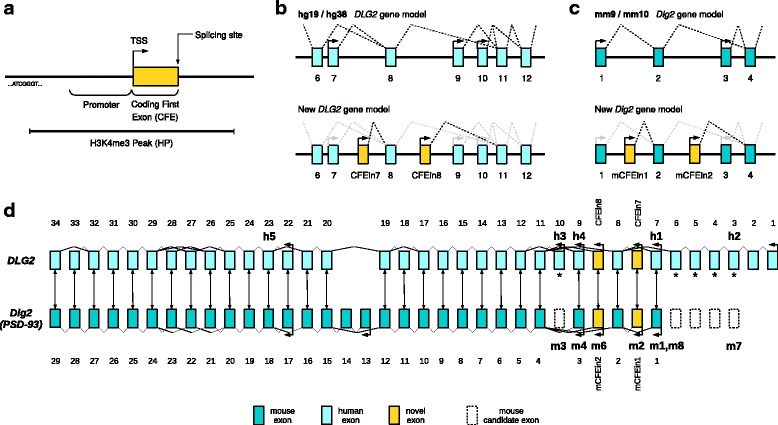
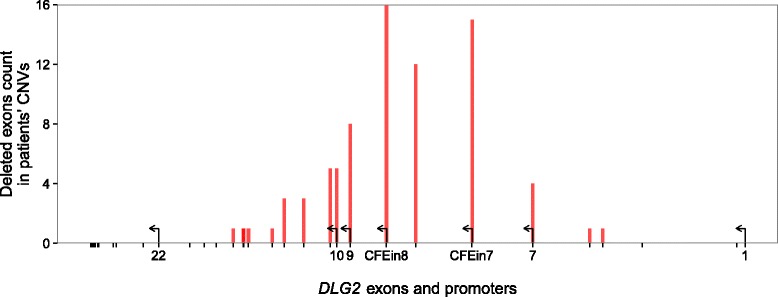
Results: Integrating genomics, transcriptomics, and epigenomics data, we describe two novel DLG2 promoters and coding first exons expressed in human fetal brain. Their murine conservation and protein-level evidence allowed us to produce new DLG2 gene models for human and mouse. These new genic elements are deleted in 90% of 29 patients (public and in-house) showing partial deletion of the DLG2 gene. The patients' clinical characteristics expand the neurodevelopmental phenotypic spectrum linked to DLG2 gene disruption to cognitive and behavioral categories.

Conclusions: While protein-coding genes are regarded as well known, our work shows that integration of multiple omics datasets can unveil novel coding elements. From a clinical perspective, our work demonstrates that two new DLG2 promoters and exons are crucial for the neurodevelopmental phenotypes associated with this gene. In addition, our work brings evidence for the lack of cross-annotation in human versus mouse reference genomes and nucleotide versus protein databases.

Keywords: DLG2; Functional genomics; Intellectual disability; Neurodevelopmental disorders; Promoters.


Conflict of interest statement

Consent for publication

The parents of patients 1 and 2 have provided consent to publish the clinical and genomic details presented.

Competing interests

The authors declare that they have no competing interests.

Publisher’s Note

Springer Nature remains neutral with regard to jurisdictional claims in published maps and institutional affiliations.

Figures

Fig. 1
Fig. 1
Patient overview for the DLG2. Four tracks are shown representing the data at different granularity levels. The first track, “chr11”, shows chromosome 11 with its cytobands; the rectangular red box indicates the DLG2 location. The second track, “DLG2”, shows genomic coordinates on the top and all unified exons (Additional file 1: Table S1 and Figure S1) at the bottom. The third track, “Patients’ deletions”, shows CNV locations for the 29 patients from DECIPHER, ULB, and the literature; each box represents a deletion carrying three kinds of patient information: i) id, ii) gender, and iii) inheritance type (detailed in Additional file 1: Tables S7–S11). Vertical solid black lines represent exons, while dotted lines highlight histone peaks (HPs) discovered using Roadmap Epigenomics data integration and described in the present work. The fourth track, “Statistics”, summarizes some basic statistics about the patients’ CNVs and clinical characteristics. In the “Inheritance” pie chart, we used the following abbreviations: DNC de novo constitutive, IMH inherited from a healthy mother, IMU inherited from a mother with unknown phenotype, IPH inherited from a healthy parent, IPU inherited from a parent with unknown phenotype, IPA inherited from a parent affected by the same phenotype. NDD neurodevelopmental disorder. All genomics coordinates are in hg19
Fig. 2
Fig. 2
Discretized ChIP-Seq profile overview of different markers across different tissues or cell types. The data come from profile–control comparisons of Roadmap Epigenomics Project data using MACS v2.1.0. The y-axis reports the -log10p value as measurements of marker against control enrichments; the greater the height, the higher the statistical confidence. Each of the nine stacked plots reports a discretized ChIP-Seq profile for different markers in one specific tissue. Starting from the top we have stem cells (H1 cell line), neuronal progenitor cells (H1 derived neuronal progenitor cultured cells), fetal brain, adult brain tissues, and, at the bottom, one non-brain-related tissue, H1 derived mesenchymal stem cells. In each plot, histone modifications are grouped according to their related function: promoter marker (in gold), activation markers (“act”, in green) or repression markers (“rep”, in red). The same y scale is applied to the three groups. Exons 7, 8, and 9 along with HPin7 and HPin8 are reported on the x-axis. All markers are listed in the legend, mixed and overlapped in the plot. A white box in the marker legend means data are not available. All genomic coordinates are in hg19
Fig. 3
Fig. 3
HPin7 and HPin8 data integration. The integration of genotypic, epigenomic, RNA-Seq, and complementary functional datasets for DLG2 with a focus on HPin7 and HPin8, along with the 5′ splice site locations. Conservation is represented by the CEGA score [63]
Fig. 4
Fig. 4
DLG2 gene model and exon mapping in mouse and human. a Qualitative graphical representation of H3K4me3 peak (HP), upstream promoter, and coding first exon (CFE). TSS transcription start site. b Two DLG2 gene models using UCSC data: the hg19/hg38 model at the top and the new model integrating our research regarding two novel promoters and coding first exons (CFEin7 and CFEin8) at the bottom. c mm9/mm10 and new Dlg2 models comparison. d DLG2/Dlg2 exon mapping by DNA sequence alignment. Bidirectional arrows between exons represent the best match according to NCBI BLAST. Arrows with tips pointing leftwards show transcription start sites according to UCSC, updated with our results. Bold annotations, such as “h3” and “m8”, mark the beginning of protein isoforms according to UniProtKB/Swiss-Prot, in human (Q15700) and mouse (Q91XM9). Regarding the mouse isoform terminology, “mX” stands for Q91XM9-X and m1, 2, 3, 4, 6, and 7 correspond, respectively, to PSD93-alpha, beta, gamma, delta, epsilon, and zeta. Human exons 3–6 and 10 are annotated with an asterisk because there is evidence (see “Methods” and Additional file 1: Supplementary note 10) that they map to unannotated Dlg2 mouse exons in mm10 reference genomes. Those “missing” murine exons code for “m3” and “m7” protein isoforms, and are depicted with dashed borders. “m5” represents DLG2 isoform “Q91XM9-5” and maps from mouse exon 3 to exon 11 (Additional file 1: Supplementary note 4). It is not included in the figure because no experimental confirmation of its existence is available. In UniProt, “h5” is also reported as not experimentally proven. However, in GTEx (adult brain), it is the most expressed isoform (see ENST00000426717 in Additional file 1: Figure S26). Hence, it is included in the figure
Fig. 5
Fig. 5
Number of times each exon is deleted in DLG2 patients’ CNVs. Distribution of CNV deletions from patients in the DLG2 cohort. Red bars represent the number of deletions overlapping the exon in consideration. On the x-axis, the exons that correspond to a transcription start site are reported with a number (shown by arrows)
Fig. 6
Fig. 6
Genome analysis workflows used to discover novel promoters and first exons statistically associated with NDDs. a The smallest regions of overlap (SRO) definition (see also Additional file 1: Figure S56). b Summary of the whole genome analysis steps used to discover novel promoters and first exons statistically associated with NDDs. DECIPHER and GDD/ID cases are aggregated. The control cohorts are kept separate under the alternative approach (Additional file 1: Supplementary note 2). The four cohorts were used to define the SROs. aAdditional file 1: Supplementary note 2. bOne aggregated region corresponds to the set of one or multiple adjacent SROs. cAdditional file 1
Fig. 7
Fig. 7
The main steps and results of the research. Summary of the high-level steps and main outcomes of the research described in this paper. HPin7 H3K4me3 peak in DLG2 intron 7, HPin8 H3K4me3 peak in DLG2 intron 8, HP either HPin7 or HPin8, HPs both HPin7 and HPin8, CFE coding first exon, NDD neurodevelopmental disorder

References

    1. Hoischen A, Krumm N, Eichler EE. Prioritization of neurodevelopmental disease genes by discovery of new mutations. Nat Neurosci. 2014;17:764–72. doi: 10.1038/nn.3703. - DOI - PMC - PubMed
    1. Li J, Cai T, Jiang Y, Chen H, He X, Chen C, et al. Genes with de novo mutations are shared by four neuropsychiatric disorders discovered from NPdenovo database. Mol Psychiatry. 2015;21:290–7. doi: 10.1038/mp.2015.40. - DOI - PMC - PubMed
    1. Marín O. Developmental timing and critical windows for the treatment of psychiatric disorders. Nat Med. 2016;22:1229–38. doi: 10.1038/nm.4225. - DOI - PubMed
    1. O’Donovan MC, Owen MJ. The implications of the shared genetics of psychiatric disorders. Nat Med. 2016;22:1214–9. doi: 10.1038/nm.4196. - DOI - PubMed
    1. Bourgeron T. From the genetic architecture to synaptic plasticity in autism spectrum disorder. Nat Rev Neurosci. 2015;16:551–63. doi: 10.1038/nrn3992. - DOI - PubMed

Publication types