. 2017 Aug 23;37(34):8077-8091.
doi: 10.1523/JNEUROSCI.0313-17.2017. Epub 2017 Jul 19.

Depressed Synaptic Transmission and Reduced Vesicle Release Sites in Huntington's Disease Neuromuscular Junctions

Affiliations

Depressed Synaptic Transmission and Reduced Vesicle Release Sites in Huntington's Disease Neuromuscular Junctions

Ahmad Khedraki et al. J Neurosci. .

Abstract

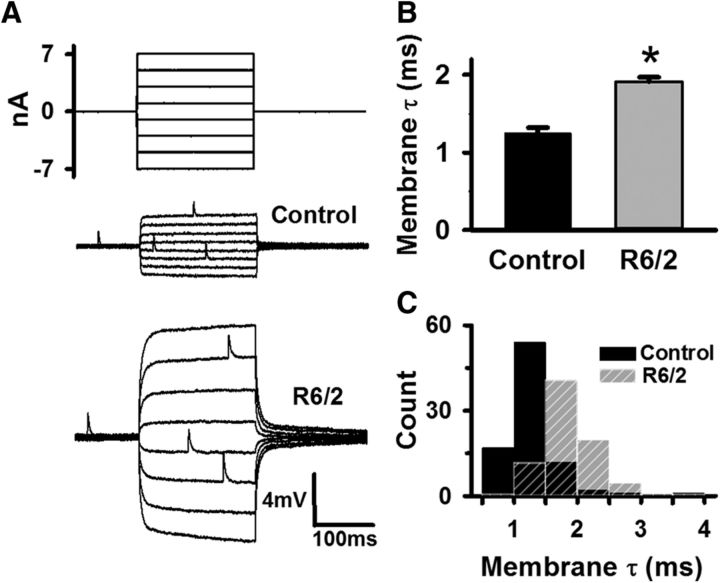
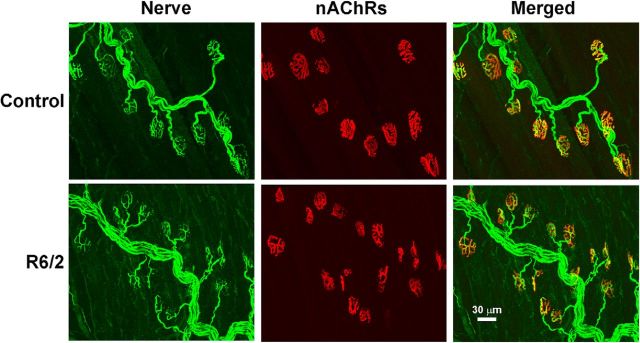
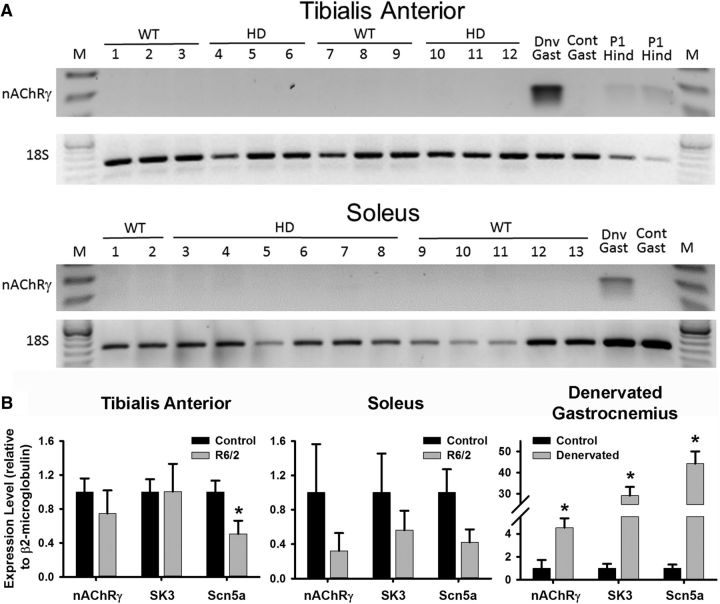
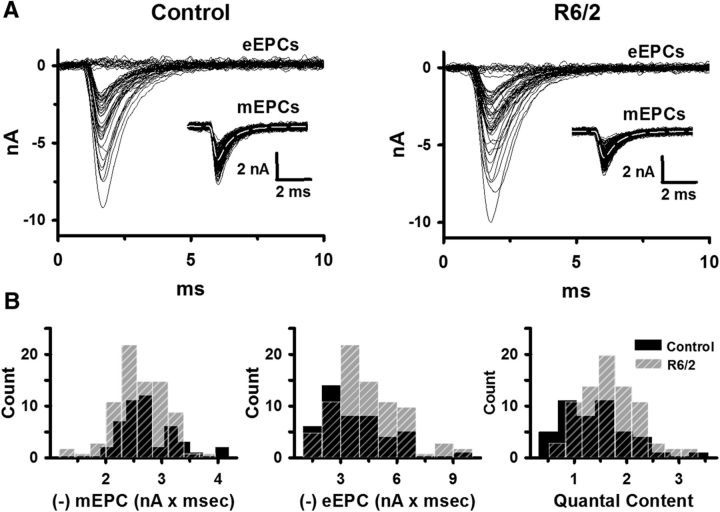
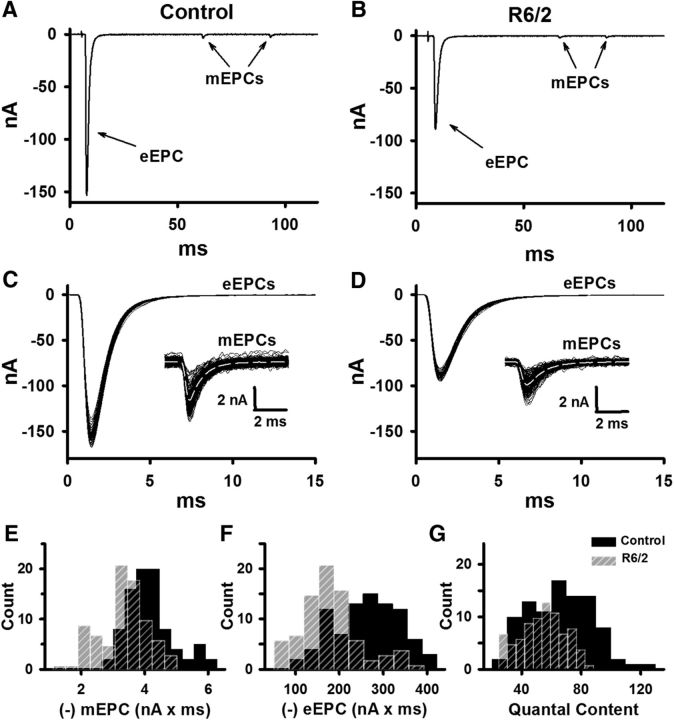
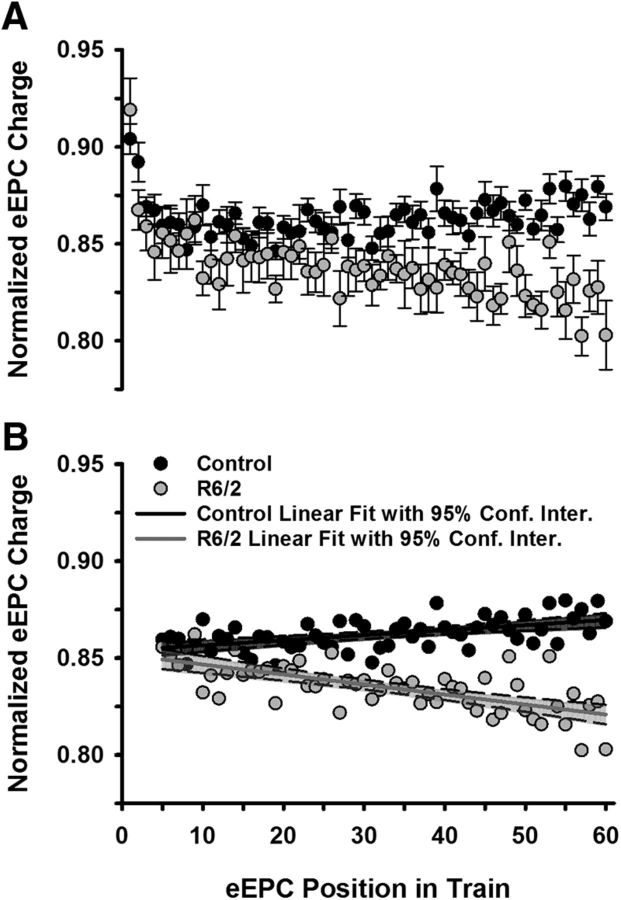
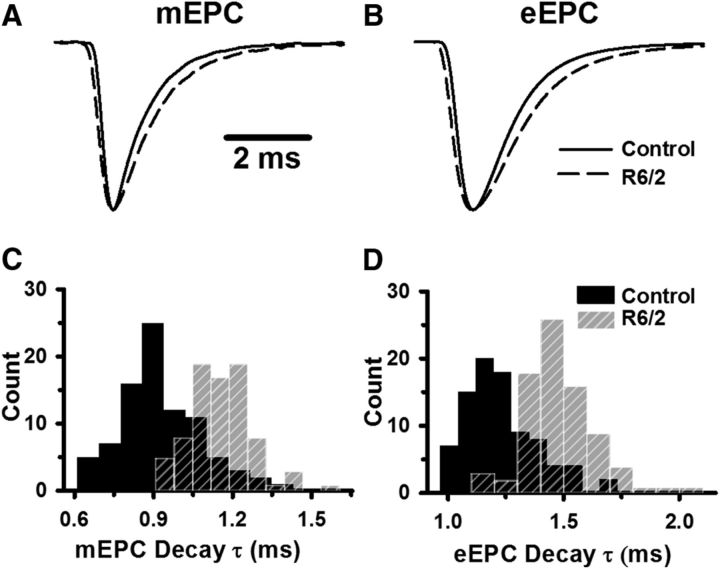
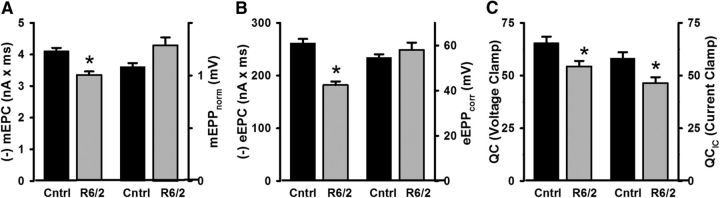
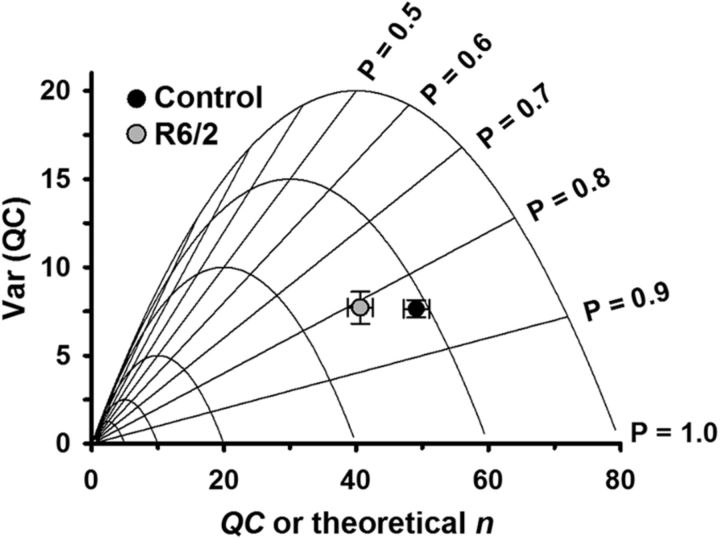
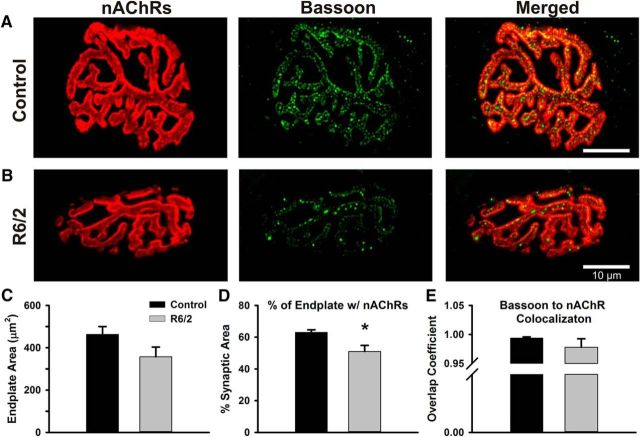
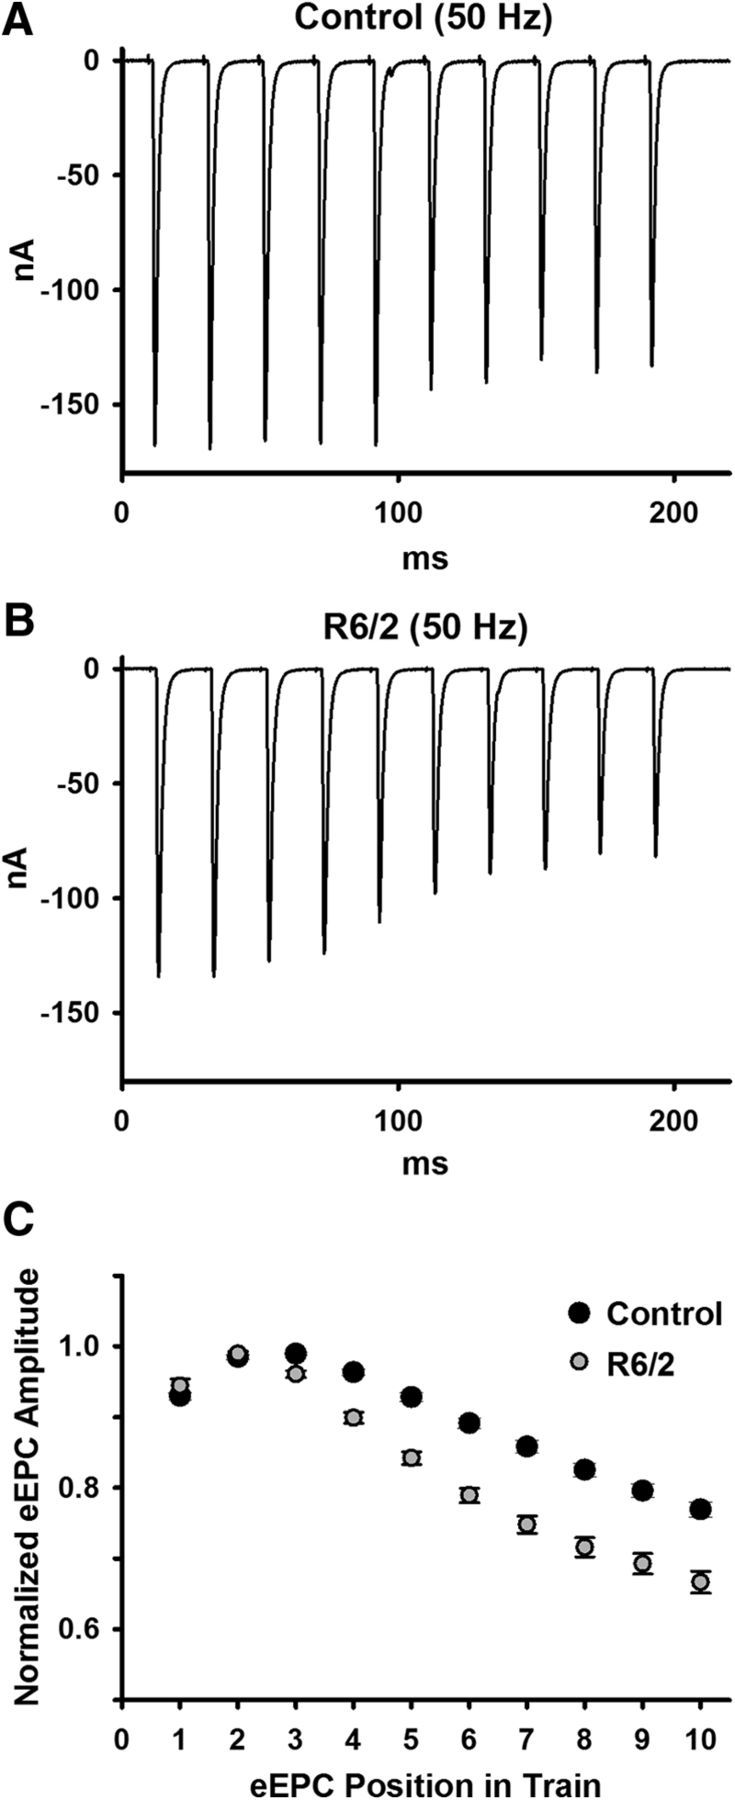
Huntington's disease (HD) is a progressive and fatal degenerative disorder that results in debilitating cognitive and motor dysfunction. Most HD studies have focused on degeneration of the CNS. We previously discovered that skeletal muscle from transgenic R6/2 HD mice is hyperexcitable due to decreased chloride and potassium conductances. The progressive and early onset of these defects suggest a primary myopathy in HD. In this study, we examined the relationship between neuromuscular transmission and skeletal muscle hyperexcitability. We used an ex vivo preparation of the levator auris longus muscle from male and female late-stage R6/2 mice and age-matched wild-type controls. Immunostaining of the synapses and molecular analyses revealed no evidence of denervation. Physiologically, we recorded spontaneous miniature endplate currents (mEPCs) and nerve-evoked EPCs (eEPCs) under voltage-clamp, which, unlike current-clamp records, were independent of the changes in muscle membrane properties. We found a reduction in the number of vesicles released per action potential (quantal content) in R6/2 muscle, which analysis of eEPC variance and morphology indicate is caused by a reduction in the number of vesicle release sites (n) rather than a change in the probability of release (prel). Furthermore, analysis of high-frequency stimulation trains suggests an impairment in vesicle mobilization. The depressed neuromuscular transmission in R6/2 muscle may help compensate for the muscle hyperexcitability and contribute to motor impersistence.SIGNIFICANCE STATEMENT Recent evidence indicates that Huntington's disease (HD) is a multisystem disorder. Our examination of neuromuscular transmission in this study reveals defects in the motor nerve terminal that may compensate for the muscle hyperexcitability in HD. The technique we used eliminates the effects of the altered muscle membrane properties on synaptic currents and thus provides hitherto the most detailed analysis of synaptic transmission in HD. Clinically, the striking depression of neurotransmission we found may help explain the motor impersistence in HD patients. Therapies that target the highly accessible peripheral nerve and muscle system provide a promising new avenue to lessen the debilitating motor symptoms of HD.

Keywords: Huntington's disease; electrophysiology; neuromuscular transmission; synaptic transmission; trinucleotide repeat disorder.


Figures

Figure 1.
Figure 1.
Increased membrane time constant (τm) indicative of hyperexcitable R6/2 skeletal muscle fibers. A, Injected current steps (top traces) and the resulting membrane potential responses in representative control and R6/2 muscle fibers (bottom traces) in normal calcium. B, Average control and R6/2 τm. C, Histogram of control (solid black bars) and R6/2 (striped gray bars) τm. *Indicates a significant difference compared with control (p = 5.94 × 10⁻⁶, t test). Regions of overlap as black striped bars. Error bars are ±SEM.
Figure 2.
Figure 2.
Representative images of stained control and R6/2 NMJs from 12-week-old mice. Motor nerves and terminals were identified by a combination of neurofilament staining (SMI-31) of axons and SV2b staining of synaptic vesicles (both in green; nerve). Motor endplates were labeled by staining of nicotinic acetylcholine receptors with rhodamine-conjugated α-bungarotoxin (red; nAChRs). The regions of superimposed nerve and nAChRs are yellow in the merged images. In both the control and R6/2 fibers, all nAChRs were directly aligned with nerve terminals. Scale bar: bottom right, 30 μm.
Figure 3.
Figure 3.
RT-PCR analyses of the expression of denervation-induced gene mRNAs in R6/2 and control mice. A, Gel-based RT-PCR for the expression of nAChRγ. Neither control nor R6/2 tibialis anterior nor soleus muscles showed expression of nAChRγ. In contrast, expression of nAChRγ was detectable in denervated (Dnv), but not control (Cont) mouse gastrocnemius (Gast) muscle. Also, expression of nAChRγ was observed in postnatal day 1 (P1) hindlimb muscles (Hind) of mice. The M designates base-pair size markers. B, Real-time RT-PCR analyses of nAChRγ, the SK3, and Scn5a mRNAs relative to β2-microglobulin in control and R6/2 mice. No significant changes in the mRNAs for nAChRγ and SK3 were observed in R6/2 mouse tibialis anterior (left; nAChRγ: p = 0.398, t test; SK3: p = 0.991, t test) and soleus (middle; nAChRγ: p = 0.289, t test; SK3: p = 0.403, t test) muscle compared with control. There was a significant decrease in the levels of Scn5a in R6/2 tibialis anterior (p = 0.025, t test) but not soleus muscle (p = 0.094, t test) relative to control. In contrast, there was a marked increase in the expression of nAChRγ (p = 0.0099, t test), SK3 (p = 0.0002, t test), and Scn5a (p = 0.0001, t test) mRNA in denervated gastrocnemius relative to the innervated contralateral muscle in control mice (n = 4 muscles/group). *Indicates a significant difference. Error bars are ±SEM.
Figure 4.
Figure 4.
The mEPC charge, eEPC charge, and QC in control and R6/2 NMJs in low extracellular Ca2+ (0.5 mm) and high Mg2+ (4 mm). A, Superimposed representative eEPC traces from control and R6/2 NMJs with an inset of superimposed representative mEPC traces from the same NMJs under two-electrode voltage-clamp. B, Histograms of average control (solid black bars) and R6/2 (striped gray bars) mEPC charge, eEPC charge, and QC. Regions of overlap as black striped bars.
Figure 5.
Figure 5.
The mEPC charge, eEPC charge, and QC in control and R6/2 NMJs in physiological extracellular Ca2+ (1.2 mm) and Mg2+ (0.6 mm). A, B, Representative control (A) and R6/2 (B) recordings under two-electrode voltage-clamp showing mEPCs and eEPCs (baseline adjusted to 0). C, D, Superimposed representative eEPC traces from control (C) and R6/2 (D) NMJs with an inset of superimposed mEPC traces from the same NMJs. EG, Histograms of average control (solid black bars) and R6/2 (striped gray bars) mEPC charge (E), eEPC charge (F), and QC (G). Regions of overlap as black striped bars.
Figure 6.
Figure 6.
Synaptic modulation at low-frequency stimulation (0.5 Hz). A, Average control (10 mice) and R6/2 (7 mice) eEPC charges normalized to the peak eEPC charge in a train of 60 eEPCs stimulated at 0.5 Hz. B, Normalized eEPCs (postion 5–60 in train) from A showing the linear regression for control (solid black line) and R6/2 (solid gray line). Data are shown with the 95% confidence interval for each linear regression (control shaded black and R6/2 shaded gray). Error bars are ±SEM.
Figure 7.
Figure 7.
Kinetics of control and R6/2 mEPCs and eEPCs. A, B, Average mEPC (A) and eEPC (B) from representative control (solid lines) and R6/2 (dashed lines) NMJs, each normalized to peak (peak value set to 1 for each endplate current). C, D, Histograms of the control (solid black bars) and R6/2 (striped gray bars) mEPC decay constants (C) and eEPC decay constants (D). Regions of overlap as black striped bars.
Figure 8.
Figure 8.
Comparison of NMJ transmission data collected under voltage-clamp (mEPC and eEPC) and current-clamp (mEPPnorm and eEPPcorr) from the same control (cntrl) and R6/2 fibers. A, mEPCs (p = 0.003, t test), but not mEPPnorm (p = 0.071, t test), were significantly lower in R6/2 compared with control fibers. B, Similarly, eEPCs (p = 6.4 × 10⁻⁵, t test), but not eEPPcorr (p = 0.45, t test), were significantly lower in R6/2 compared with control fibers. C, Estimates of quantal content from voltage-clamp (QC) and current-clamp (QCIC) were lower for R6/2 compared with control (p = 0.008 and p = 0.02, respectively, t test). *Indicates a significant difference compared with control NMJs. Error bars are ±SEM.
Figure 9.
Figure 9.
Var(QC) versus QC plot for estimating the probability of release (prel) and number of vesicle release sites (n). Experimental Var(QC) and QC data superimposed on two theoretical models (parabolas and straight lines). The parabolas model Var(QC) and QC while varying prel and holding n constant. Straight lines model Var(QC) and QC while varying n and holding prel constant. The lower QC (vesicle release per impulse) in R6/2 compared with control fibers was primarily due to a lower n. Error bars are ±SEM.
Figure 10.
Figure 10.
Comparison of R6/2 and control NMJs stained for postsynaptic nAChRs and presynaptic bassoon proteins. A, B, Representative control (A) and R6/2 (B) NMJs stained for nAChRs on the motor endplate (red, left), bassoon in the motor nerve terminals (green, middle), and the merge image of the nAChR and bassoon staining (right). nAChRs were stained with α-bungarotoxin-AlexaFluor 555 and bassoon was detected by immunofluorescence. C, Total endplate area for control (black bar) and R6/2 (gray bar) NMJs determined by circumscribing the nAChR staining region. D, The percentage of the control (black bar) and R6/2 (gray bar) endplate occupied by nAChR. This estimate of synaptic area was significantly less in R6/2 compared with control NMJs (p = 0.01, t test). E, The overlap coefficient of bassoon to nAChR in control (black bar) and R6/2 (gray bar) NMJs. A value of 1 indicates that each pixel of bassoon staining (green) colocalized with red pixels (nAChR). *Indicates a significant difference compared with control NMJs. Error bars are ±SEM.
Figure 11.
Figure 11.
eEPC depression during high-frequency (50 Hz) stimulation trains. A, B, Representative raw traces for control (A) and R6/2 (B) NMJs. C, Average control (10 mice) and R6/2 (7 mice) eEPC amplitudes normalized to the peak eEPC amplitude in a train of 10 eEPCs at 50 Hz stimulation. Error bars are ±SEM.

Similar articles

Cited by

References

    1. Adams L, Carlson BM, Henderson L, Goldman D (1995) Adaptation of nicotinic acetylcholine receptor, myogenin, and MRF4 gene expression to long-term muscle denervation. J Cell Biol 131:1341–1349. 10.1083/jcb.131.5.1341 - DOI - PMC - PubMed
    1. Albuquerque EX, McIsaac RJ (1970) Fast and slow mammalian muscles after denervation. Exp Neurol 26:183–202. 10.1016/0014-4886(70)90099-3 - DOI - PubMed
    1. Ariano MA, Cepeda C, Calvert CR, Flores-Hernández J, Hernández-Echeagaray E, Klapstein GJ, Chandler SH, Aronin N, DiFiglia M, Levine MS (2005) Striatal potassium channel dysfunction in Huntington's disease transgenic mice. J Neurophysiol 93:2565–2574. 10.1152/jn.00791.2004 - DOI - PubMed
    1. Bhide PG, Day M, Sapp E, Schwarz C, Sheth A, Kim J, Young AB, Penney J, Golden J, Aronin N, DiFiglia M (1996) Expression of normal and mutant huntingtin in the developing brain. J Neurosci 16:5523–5535. - PMC - PubMed
    1. Busse ME, Hughes G, Wiles CM, Rosser AE (2008) Use of hand-held dynamometry in the evaluation of lower limb muscle strength in people with Huntington's disease. J Neurol 255:1534–1540. 10.1007/s00415-008-0964-x - DOI - PubMed

Publication types

MeSH terms

LinkOut - more resources