. 2017 Jul 20;2(14):e93534.
doi: 10.1172/jci.insight.93534.

ALX receptor ligands define a biochemical endotype for severe asthma

Affiliations

ALX receptor ligands define a biochemical endotype for severe asthma

Isabell Ricklefs et al. JCI Insight. .

Erratum in

  • ALX receptor ligands define a biochemical endotype for severe asthma.
    Ricklefs I, Barkas I, Duvall MG, Cernadas M, Grossman NL, Israel E, Bleecker ER, Castro M, Erzurum SC, Fahy JV, Gaston BM, Denlinger LC, Mauger DT, Wenzel SE, Comhair SA, Coverstone AM, Fajt ML, Hastie AT, Johansson MW, Peters MC, Phillips BR, Levy BD; National Heart Lung and Blood Institute’s Severe Asthma Research Program- Investigators. Ricklefs I, et al. JCI Insight. 2018 Mar 22;3(6):e120932. doi: 10.1172/jci.insight.120932. JCI Insight. 2018. PMID: 29563345 Free PMC article. No abstract available.

Abstract

Background: In health, inflammation resolution is an active process governed by specialized proresolving mediators and receptors. ALX/FPR2 receptors (ALX) are targeted by both proresolving and proinflammatory ligands for opposing signaling events, suggesting pivotal roles for ALX in the fate of inflammatory responses. Here, we determined if ALX expression and ligands were linked to severe asthma (SA).

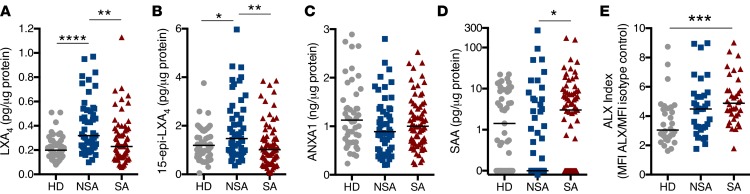
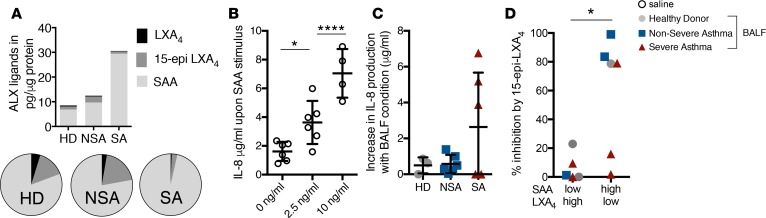
Methods: ALX expression and levels of proresolving ligands (lipoxin A4 [LXA4], 15-epi-LXA4, and annexin A1 [ANXA1]), and a proinflammatory ligand (serum amyloid A [SAA]) were measured in bronchoscopy samples collected in Severe Asthma Research Program-3 (SA [n = 69], non-SA [NSA, n = 51] or healthy donors [HDs, n = 47]).

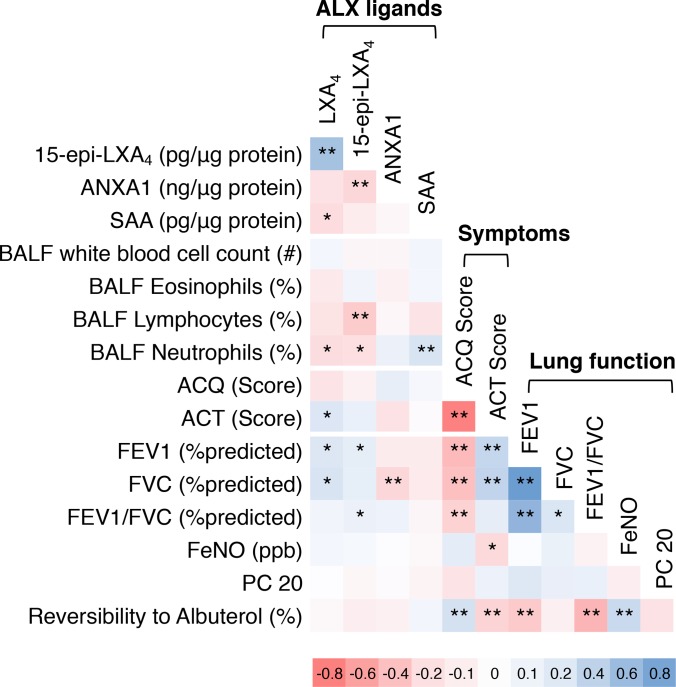
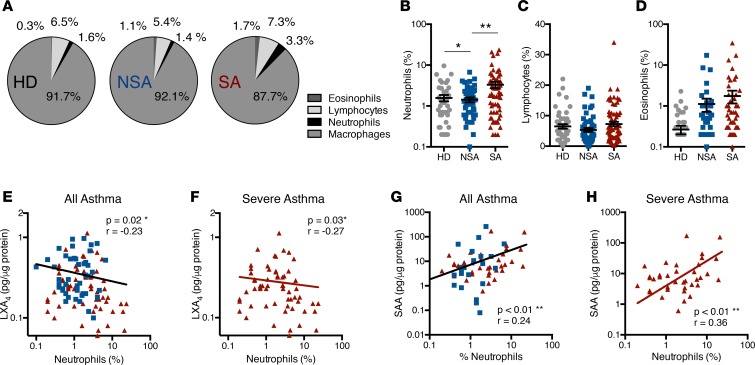
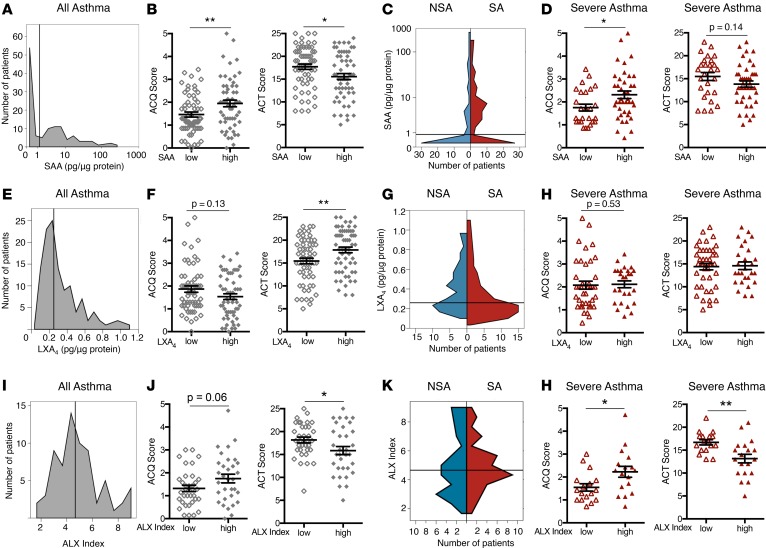
Results: Bronchoalveolar lavage (BAL) fluid LXA4 and 15-epi-LXA4 were decreased and SAA was increased in SA relative to NSA. BAL macrophage ALX expression was increased in SA. Subjects with LXA4loSAAhi levels had increased BAL neutrophils, more asthma symptoms, lower lung function, increased relative risk for asthma exacerbation, sinusitis, and gastroesophageal reflux disease, and were assigned more frequently to SA clinical clusters. SAA and aliquots of LXA4loSAAhi BAL fluid induced IL-8 production by lung epithelial cells expressing ALX receptors, which was inhibited by coincubation with 15-epi-LXA4.

Conclusions: Together, these findings have established an association between select ALX receptor ligands and asthma severity that define a potentially new biochemical endotype for asthma and support a pivotal functional role for ALX signaling in the fate of lung inflammation.

Trial registration: Severe Asthma Research Program-3 (SARP-3; ClinicalTrials.gov NCT01606826)FUNDING Sources. National Heart, Lung and Blood Institute, the NIH, and the German Society of Pediatric Pneumology.

Keywords: Inflammation; Pulmonology.


Conflict of interest statement

Conflict of interest: B.D. Levy is a coinventor on patent 8,119,691 assigned to Brigham and Women’s Hospital.

Figures

Figure 1
Figure 1. Relative abundance of BALF ALX ligands and ALX receptor expression differs in asthma.
BALF was obtained from subjects with asthma (n = 120) and healthy donors (n = 47, gray circles). Asthmatic subjects were assigned to NSA (n = 51, blue squares) and SA (n = 69, red triangles) cohorts by SARP criteria. (A) LXA4 and (B) 15-epi-LXA4 were extracted from BALF and quantified by ELISA (see Methods). (C) ANXA1 and (D) SAA levels were determined by ELISA. Scatter plots show individual data points for each subject normalized to protein levels with the median value noted by the horizontal line. (E) Flow cytometry was performed on viable BAL macrophages in n = 32 HD, n = 33 NSA, and n = 38 SA subjects to measure surface ALX expression. Data are expressed as the ALX index (MFI ALX divided by MFI isotype control). *P < 0.05, **P < 0.01, ***P < 0.005, ****P < 0.001 by Kruskal-Wallis test, followed by Dunn’s test for multiple comparisons. BALF, bronchoalveolar lavage fluid; ALX, airway lipoxin A4 receptor; HD, healthy donors; NSA, nonsevere asthma; SA, severe asthma; SARP, Severe Asthma Research Program; LXA4, lipoxin A4; 15-epi-LXA4, 15-epimer lipoxin A4; ELISA, enzyme-linked immunosorbent assay; ANXA1, annexin A1; SAA, serum amyloid A; MFI, median fluorescence intensity.
Figure 2
Figure 2. Relationship between ALX ligands, lung inflammation, asthma symptoms, and lung function in asthma.
The relationships between BALF ALX ligand levels, BAL leukocytes, asthma symptom score, and measures of lung function, were determined by Pearson correlation matrix (see Methods) for n = 51 NSA and n = 69 SA subjects. Positive correlations are noted in blue and negative correlations in red. The color intensity is proportional to Pearson’s correlation coefficient, with deeper colors denoting stronger associations. *P < 0.05, **P < 0.01 by Pearson correlation analysis. BALF, bronchoalveolar lavage fluid; ALX, airway lipoxin A4 receptor; NSA, nonsevere asthma; SA, severe asthma; LXA4, lipoxin A4; 15-epi-LXA4, 15-epimer lipoxin A4; ANXA1, annexin A1; SAA, serum amyloid A; ACQ, Asthma Control Questionnaire; ACT, Asthma Control Test; FEV1, forced expiratory volume in 1 second; FVC, forced vital capacity; FeNO, fractional exhaled nitric oxide; PC 20, provocation challenge causing a 20% fall in FEV1.
Figure 3
Figure 3. BAL neutrophils are increased in severe asthma and differentially related to BALF LXA4 and SAA levels.
BAL samples were obtained from NSA and SA subjects and leukocyte subsets were enumerated. (A) Pie charts express the mean percentage of BAL neutrophils, lymphocytes, eosinophils, and macrophages in n = 47 HD, n = 51 NSA, and n = 69 SA subjects. (BD) Scatter plots show individual subject data points with mean ± SEM for BAL (B) neutrophils, (C) lymphocytes, and (D) eosinophils in the HD (gray circles), NSA (blue squares), and SA (red triangles) cohorts. *P < 0.05, **P < 0.01 by 1-way ANOVA. (E and F) The relationship between BALF neutrophils and LXA4 was determined for (E) all asthma subjects and (F) for the SA cohort only. (G and H) The relationship between BALF neutrophils and SAA was determined for (G) all asthma subjects and (H) for the SA cohort only. SAA levels that were undetectable were assigned a value of 0 pg/μg protein and were included in the correlation analysis. Pearson correlation r value and significance are noted and regression lines are shown. BALF, bronchoalveolar lavage fluid; HD, healthy donors; NSA, nonsevere asthma; SA, severe asthma; LXA4, lipoxin A4; SAA, serum amyloid A.
Figure 4
Figure 4. SAA and macrophage ALX expression are associated with increased symptoms in severe asthma.
Asthma subjects were categorized into subgroups based on low or high BALF levels of SAA (AD), LXA4 (EH), and macrophage ALX expression (IL). The median value for each variable was used to define the cutoff between the low and high subgroups (SAA cutoff = 1.22 pg/μg protein, LXA4 cutoff = 0.25 pg/μg protein, ALX index cutoff = 4.6 pg/μg protein). Cutoff values are delineated by the gray vertical line. A histogram shows the distribution of subjects based on BALF (A) SAA level, (E) LXA4 level, and (I) BAL macrophage ALX index. (B, F, and J) Validated measures of asthma symptoms (ACQ and ACT scores) were compared between low (open diamonds) and high (closed diamonds) subgroups for SAA, LXA4, and ALX index. (C, G, and K) The distributions of SAA, LXA4, and ALX index among NSA (blue) and SA (red) subjects are shown in violin plots. (D, H, and L) ACQ and ACT scores were compared in SA subjects for low (open triangles) and high (closed triangles) subgroups for SAA, LXA4, and ALX index. Scatter plots show individual subject data with mean ± SEM. n = 51 NSA and n = 69 SA subjects.*P < 0.05, **P < 0.01 by Mann-Whitney test or 2-tailed Student’s t test. BALF, bronchoalveolar lavage fluid; SAA, serum amyloid A; ACQ, asthma control questionnaire; ACT, asthma control test; NSA, nonsevere asthma; SA, severe asthma; LXA4, lipoxin A4; ALX, airway lipoxin A4 receptor.
Figure 5
Figure 5. BALF SAA and LXA4 levels are distinct in clinically severe and nonsevere asthma.
(A) The number and percentages of asthma subjects with BALF levels of LXA4 and SAA that were below (low) or above (high) the median value were identified and subjects were grouped into 4 phenotypes based on LXA4 and SAA levels. Noted are subjects in the LXA4hiSAAlo group (beige quadrant) and LXA4loSAAhi group (purple quadrant). The relationship between individual subject levels of LXA4 and SAA was determined for all asthma subjects. (B) The 4 groups of subjects based on BALF SAA and LXA4 low and high cohorts were determined for subjects and stratified by asthma severity; NSA (left), SA (right). (C) The relationship between the SAA/LXA4 ratio and BAL neutrophils (%) was determined in n = 120 asthma subjects. Pearson correlation r value and significance are noted and regression line is shown. (DF) Scatter plots show comparisons of subjects in the LXA4hiSAAlo group (beige) to subjects in the LXA4loSAAhi group (purple) for measures of (D) inflammation (BALF neutrophils [%]), (E) asthma symptoms (ACQ and ACT scores), and (F) lung function (percentage predicted FEV1 and FVC). (G) Subjects in the LXA4hiSAAlo and LXA4loSAAhi groups were assigned to clinical clusters as defined in SARP-1 (5) and the percentage of subjects assigned to NSA and SA clusters is indicated. n = 51 NSA and n = 69 SA subjects.*P < 0.05, **P < 0.01 by 2-tailed Student’s t test. BALF, bronchoalveolar lavage fluid; LXA4, lipoxin A4; SAA, serum amyloid A; NSA, nonsevere asthma; SA, severe asthma; ACQ, Asthma Control Questionnaire; ACT, Asthma Control Test; FEV1, forced expiratory volume in 1 second; FVC, forced vital capacity; SARP, Severe Asthma Research Program.
Figure 6
Figure 6. SAA and 15-epi-LXA4 signaling via ALX receptors regulates production of the neutrophil chemoattractant IL-8.
A549 human epithelial cells expressing human ALX receptors (A549hALX) were exposed to BALF from HD, NSA, or SA subjects (24 hours, 37°C, 5% CO2) and IL-8 levels were measured in the cell-free supernatant by ELISA (see Methods). (A) Mean levels of LXA4, 15-epi-LXA4, and SAA in BALF from n = 15 subjects used for A549hALX cell incubations are shown in stacked bar graphs and the relative proportions are noted in pie charts. (B) IL-8 production by A549hALX cells was measured after incubation with saline control or SAA (2.5 ng/ml or 10 ng/ml) for 24 hours. (C) IL-8 production by A549hALX cells was measured after 24 hours of exposure to BALF from HD (n = 3), NSA (n = 6), or SA (n = 5) and is expressed as an increase relative to saline controls. Incubations with BALF without an increase in IL-8 production relative to saline control were assigned a value of zero. (D) A549hALX epithelial cells were exposed to BALF from subjects with endogenous levels that were LXA4hiSAAlo (n = 5) or LXA4loSAAhi (n = 6) followed by exposure to exogenous 15-epi-LXA4 (100 nM). Percentage inhibition of IL-8 production after 15-epi-LXA4 exposure was calculated. *P < 0.05, ****P < 0.001 by (B) 1-way ANOVA, (C) Kruskal-Wallis test, and (D) Mann-Whitney test. ALX, airway lipoxin A4 receptor; LXA4, lipoxin A4; 15-epi-LXA4, 15-epimer lipoxin A4; SAA, serum amyloid A; HD, healthy donors; NSA, nonsevere asthma; SA, severe asthma; IL-8, interleukin-8; BALF, bronchoalveolar lavage fluid.

References

    1. Most Recent Asthma Data. Center for Disease Control and Prevention. https://www.cdc.gov/asthma/most_recent_data.htm Updated February 27, 2017. Accessed June 6, 2017.
    1. Levy BD, et al. Future research directions in asthma. An NHLBI working group report. Am J Respir Crit Care Med. 2015;192(11):1366–1372. doi: 10.1164/rccm.201505-0963WS. - DOI - PMC - PubMed
    1. Ray A, Raundhal M, Oriss TB, Ray P, Wenzel SE. Current concepts of severe asthma. J Clin Invest. 2016;126(7):2394–2403. doi: 10.1172/JCI84144. - DOI - PMC - PubMed
    1. Modena BD, et al. Gene expression correlated with severe asthma characteristics reveals heterogeneous mechanisms of severe disease. Am J Respir Crit Care Med. 2017;195(11):1449–1463. doi: 10.1164/rccm.201607-1407OC. - DOI - PMC - PubMed
    1. Moore WC, et al. Identification of asthma phenotypes using cluster analysis in the Severe Asthma Research Program. Am J Respir Crit Care Med. 2010;181(4):315–323. doi: 10.1164/rccm.200906-0896OC. - DOI - PMC - PubMed

Associated data

LinkOut - more resources