. 2017 Jul 20;2(14):e92930.
doi: 10.1172/jci.insight.92930.

Increasing the level of peroxisome proliferator-activated receptor γ coactivator-1α in podocytes results in collapsing glomerulopathy

Affiliations

Increasing the level of peroxisome proliferator-activated receptor γ coactivator-1α in podocytes results in collapsing glomerulopathy

Szu-Yuan Li et al. JCI Insight. .

Abstract

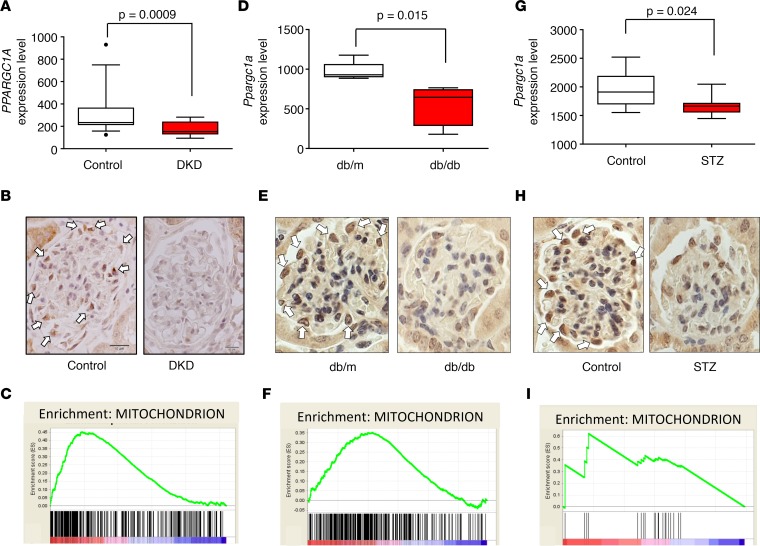
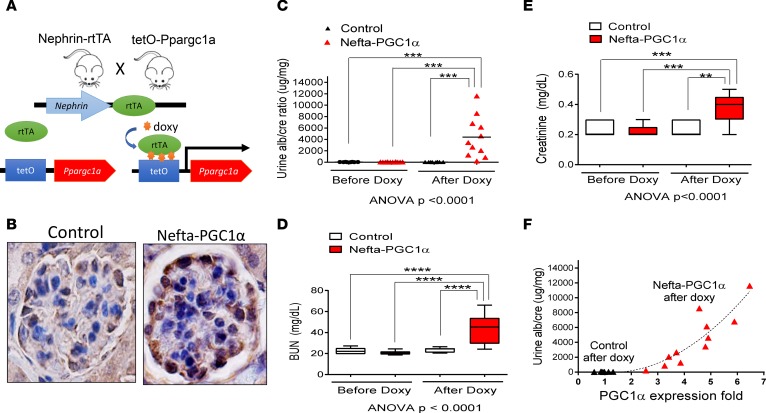
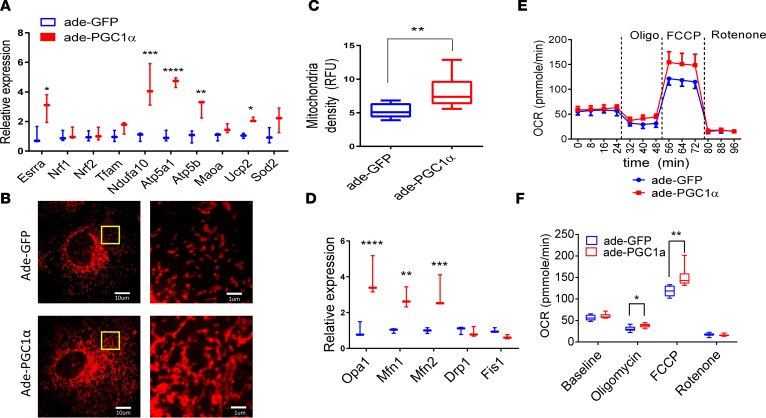
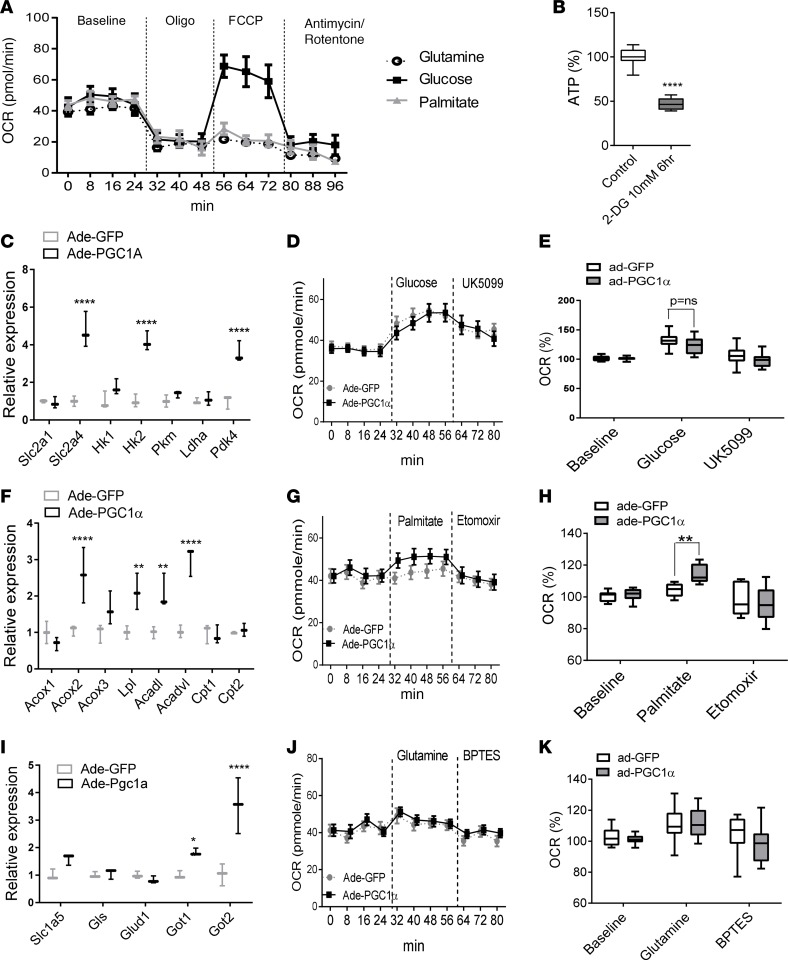
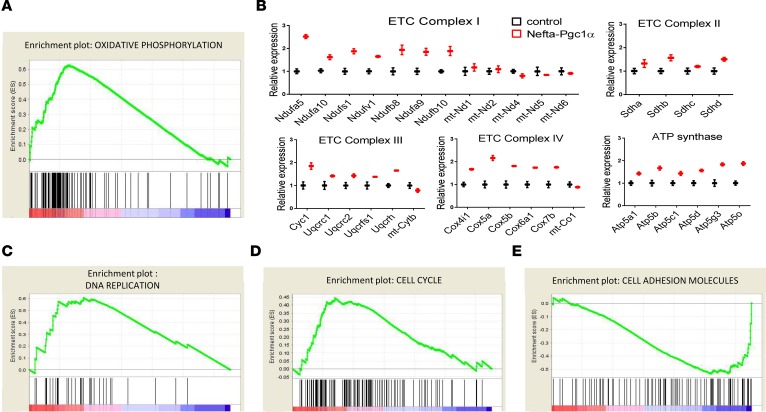
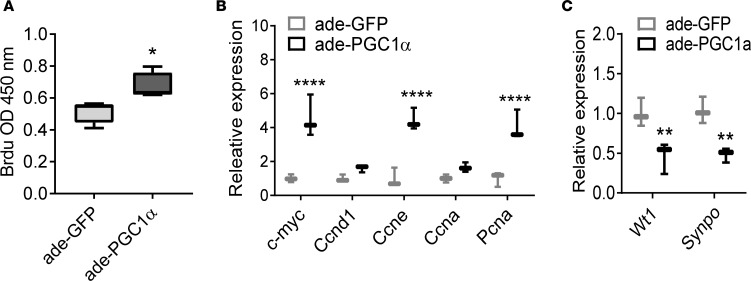
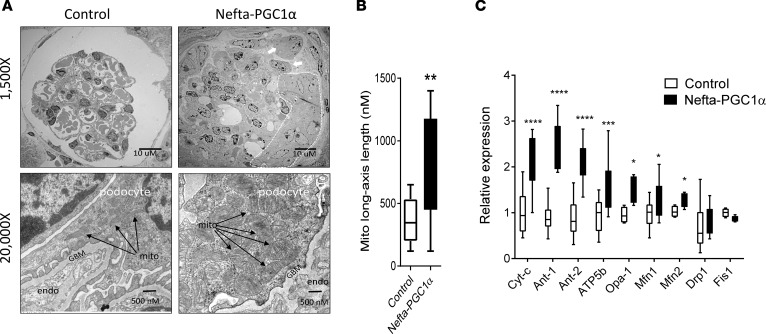
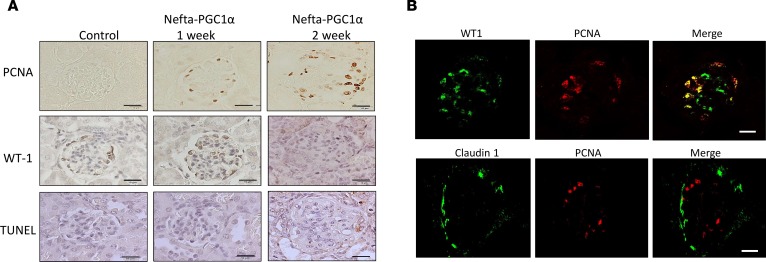
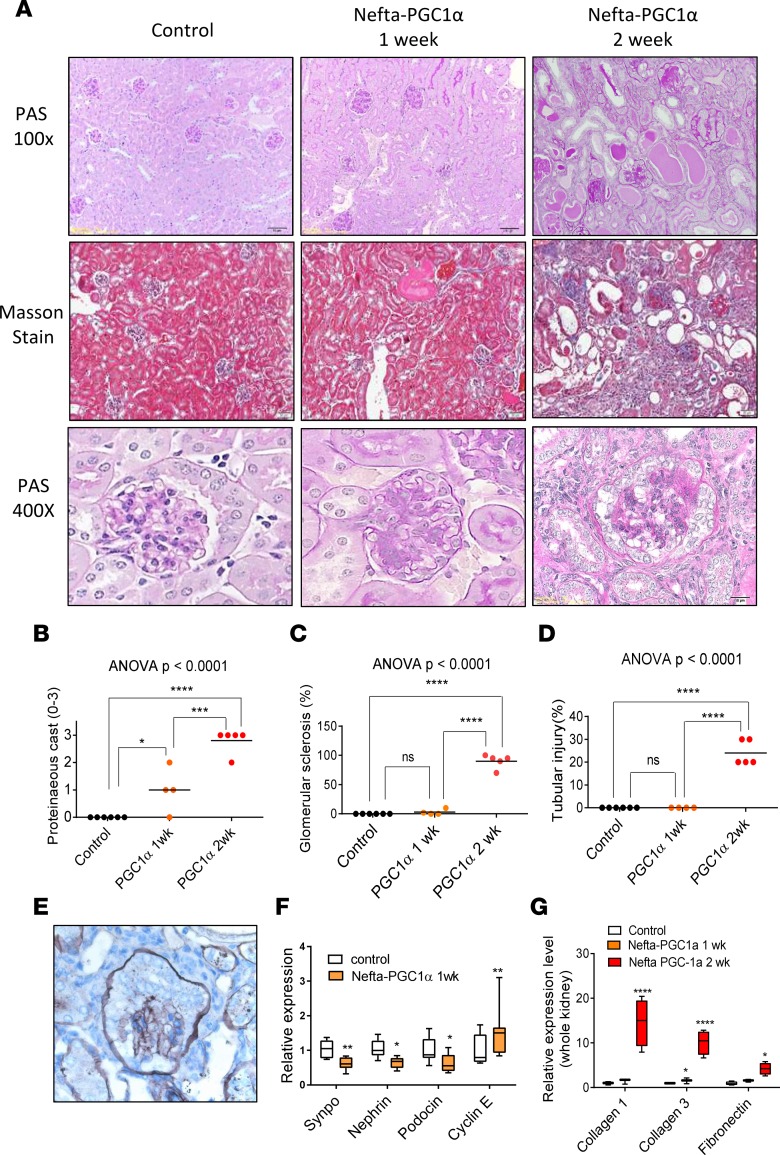
Inherited and acquired mitochondrial defects have been associated with podocyte dysfunction and chronic kidney disease (CKD). Peroxisome proliferator-activated receptor γ coactivator-1α (PGC1α) is one of the main transcriptional regulators of mitochondrial biogenesis and function. We hypothesized that increasing PGC1α expression in podocytes could protect from CKD. We found that PGC1α and mitochondrial transcript levels are lower in podocytes of patients and mouse models with diabetic kidney disease (DKD). To increase PGC1α expression, podocyte-specific inducible PGC1α-transgenic mice were generated by crossing nephrin-rtTA mice with tetO-Ppargc1a animals. Transgene induction resulted in albuminuria and glomerulosclerosis in a dose-dependent manner. Expression of PGC1α in podocytes increased mitochondrial biogenesis and maximal respiratory capacity. PGC1α also shifted podocytes towards fatty acid usage from their baseline glucose preference. RNA sequencing analysis indicated that PGC1α induced podocyte proliferation. Histological lesions of mice with podocyte-specific PGC1α expression resembled collapsing focal segmental glomerular sclerosis. In conclusion, decreased podocyte PGC1α expression and mitochondrial content is a consistent feature of DKD, but excessive PGC1α alters mitochondrial properties and induces podocyte proliferation and dedifferentiation, indicating that there is likely a narrow therapeutic window for PGC1α levels in podocytes.

Keywords: Metabolism; Nephrology.


Figures

Figure 1
Figure 1. Glomerular PGC1α expression and mitochondrial transcript abundance in diabetic glomeruli.
(A) Glomerular PPARGC1A expression in diabetic kidney disease patients and controls. Box-and-whisker plots depict the median (line within box), 2.5–97.5 percentile (whiskers), and first and third quartiles (bottom and top of box) (n = 21). Significance evaluated by unpaired t test. (B) Representative PGC1α immunostaining of human kidneys. Arrows indicate positive PGC1α staining in podocytes of control samples. Scale bars: 10 μm. (C) Gene set enrichment analysis shows that mitochondrial gene transcript abundance is lower in diabetic human glomeruli compared with control samples. (D) Glomerular Ppargc1a mRNA expression level in db/db and control mice (n = 10). (E) Representative PGC1α immunostaining of db/db and control mice. (F) Gene set enrichment analysis of mitochondrial gene transcript abundance in glomeruli of db/db and control mice. (G) Glomerular Ppargc1a mRNA expression level in streptozotocin-injected and control mice (n = 17). (H) Representative PGC1α immunostaining in streptozotocin-injected and control mice. (I) Gene set enrichment analysis of mitochondrial gene transcript abundance in glomeruli of streptozotocin-injected and control mice. PGC1α, peroxisome proliferator-activated receptor γ coactivator-1α; DKD, diabetic kidney disease; STZ, streptozotocin.
Figure 2
Figure 2. Increasing PGC1α levels in podocytes leads to proteinuria and renal failure.
(A) Breeding scheme for generating podocyte-specific PGC1α-transgenic mice. (B) Representative PGC1α immunostaining in control and Nefta-PGC1α mouse glomeruli. Scale bar: 10 μm. (C) Urine albumin/creatinine ratio in control and Nefta-PGC1α mice (n = 9–13 per group). (D and E) Serum blood urea nitrogen (BUN) and creatinine levels of control and Nefta-PGC1α mice, 2 weeks after initiation of doxycycline-containing food. Box-and-whisker plots show the median (line within box), upper and lower quartiles (bounds of box), and minimum and maximum values (whiskers). **P < 0.01, ***P < 0.001, ****P < 0.0001 by 1-way ANOVA with post-hoc analysis. (F) Correlation between PGC1α expression and urine albumin/creatinine ratio. Nefta, nephrin-rtTA; PGC1α, peroxisome proliferator-activated receptor γ coactivator-1α.
Figure 3
Figure 3. PGC1α increase mitochondrial biogenesis, mitochondrial fusion, and mitochondrial respiratory capacity in vitro.
(A) Expression of genes involved in mitochondrial biogenesis and anti-ROS in control and PGC1α-expressing podocytes. Relative expression of estrogen-related receptor α (Esrra), nuclear respiratory factor 1 (Nrf1), Nrf2, transcription factor A mitochondrial (Tfam), ubiquinone oxidoreductase subunit A10 (Ndufa10), ATP synthase subunit α (Atp5a), ATP synthase subunit β (Atp5b), monoamine oxidase A (Maoa), uncoupling protein 2 (Ucp2), and superoxide dismutase 2 (Sod2) was evaluated. (B) A representative images of Mitotracker fluorescence staining in control and PGC1α-expressing podocytes. Scale bars: 10 μm (left) and 1 μm (higher magnification, right). (C) Mitochondrial density quantified by Mitotracker fluorescence (n = 10 per group). Box-and-whisker plots depict the median (line within box), upper and lower quartiles (bounds of box), and minimum and maximum values (whiskers). (D) Expression of genes involved in mitochondrial fusion and fission in control and PGC1α-expressing podocytes. Optic atrophy 1 (Opa1), mitofusin 1 (Mfn1), Mfn2, dynamin-related protein 1 (Drp1), and mitochondrial fission 1 (Fis1) were evaluated. (E and F) PGC1α increases the oxygen consumption rate after added ATP synthase inhibitor oligomycin and electron transport chain accelerator FCCP; each data point represents the mean and SD (n = 20 per group). *P ≤ 0.05, **P ≤ 0.01, ***P ≤ 0.001, ****P ≤ 0.0001 by unpaired t tests with Bonferroni correction or 1-way ANOVA with post-hoc analysis. Ade, adenovirus; FCCP, p-trifluoromethoxy carbonyl cyanide phenyl hydrazone; PGC1α, peroxisome proliferator-activated receptor γ coactivator-1α.
Figure 4
Figure 4. PGC1α alters mitochondrial fuel preference in podocytes.
(A) Oxygen consumption rate (OCR) of podocytes measured by Seahorse XF. Podocytes were cultured in various energy substrates (Seahorse XF Base Medium supplemented with glucose, palmitate, or glutamine). OCRs were measured at baseline, following 1 μM oligomycin, 3 μM FCCP, and 1 μM antimycin/rotenone (n = 5 per group). (B) ATP concentration in control and 2-deoxyglucose–treated podocytes (n = 10). Box-and-whisker plots show the median (line within box), upper and lower quartiles (bounds of box), and minimum and maximum values (whiskers). (C) Expression of genes involved in glycolysis in control and PGC1α-expressing podocytes. Glucose transporter 1 (Slc2a1), Slc2a4, hexokinase 1 (Hk1), Hk2, pyruvate kinase isozymes M1/M2 (Pkm), lactate dehydrogenase A (Ldha), and pyruvate dehydrogenase kinase 4 (Pdk4) were evaluated. (D and E) OCR in glucose/UK5099–treated podocytes (n = 20 per group). (F) Expression of genes involved in fatty acid oxidation in control and PGC1α-expressing podocytes. Acyl-CoA oxidase 1 (Acox1), Acox2, Acox3, lipoprotein lipase (Lpl), acyl-CoA dehydrogenase long chain (Acadl), acyl-CoA dehydrogenase very long chain (Acadvl), carnitine palmitoyltransferase I (Cpt1), and Cpt2 were evaluated. (G and H) OCR in palmitate/etomoxir–treated podocytes (n = 20 per group). (I) Expression of amino acid transporter in control and PGC1α-expressing podocytes. Neutral amino acid transporter B (Slc1a5), glutaminase (Gls), glutamate dehydrogenase 1 (Glud1), glutamic-oxaloacetic transaminase 1 (Got1), and Got2 were evaluated. (J and K) OCR in glutamine/BPTES–treated podocytes (n = 20 per group). *P ≤ 0.05, **P ≤ 0.01 by unpaired t test with Bonferroni correction or 1-way ANOVA with post-hoc analysis. ns, not significant; Ade, adenovirus; BPTES, bis-2-(5-phenylacetamido-1,3,4-thiadiazol-2-yl)ethyl sulfide; FCCP, p-trifluoromethoxy carbonyl cyanide phenyl hydrazone; PGC1α, peroxisome proliferator-activated receptor γ coactivator-1α.
Figure 5
Figure 5. RNA sequencing analysis indicates that PGC1α induces aberrant mitochondrial assembly and promotes cell cycle re-entry.
(A) Gene set enrichment analysis of oxidative phosphorylation gene transcript abundance in glomeruli of control and Nefta-PGC1α mice. (B) Relative transcript levels of electron transport chain (ETC) subunits in glomeruli of control and Nefta-PGC1α mice. (C) Gene set enrichment analysis of DNA replication gene transcript abundance. (D) Gene set enrichment analysis of cell cycle gene transcript abundance. (E) Gene set enrichment analysis of cell adhesion molecule transcript abundance. Nefta, nephrin-rtTA; PGC1α, peroxisome proliferator-activated receptor γ coactivator-1α.
Figure 6
Figure 6. PGC1α induces podocyte proliferation in vitro.
(A) BrdU incorporation in cultured podocytes following control (GFP) and PGC1α adenoviral infection (n = 10 per group). Box-and-whisker plots depict the median (line within box), upper and lower quartiles (bounds of box), and minimum and maximum values (whickers). **P < 0.01 by Student’s t test. (B) Expression of genes involved in cell proliferation in control and PGC1α-expressing podocytes. c-Myc, cyclin D1 (Ccnd1), cyclin E (Ccne), cyclin A (Ccna), and proliferating cell nuclear antigen (Pcna) were evaluated. (C) Podocyte-specific gene expression in control and PGC1α-expressing podocytes. Wilms tumor 1 (Wt1) and synaptopodin (Synpo) were evaluated.*P ≤ 0.05, **P ≤ 0.01 by unpaired t test with Bonferroni correction. Ade, adenovirus; PGC1α, peroxisome proliferator-activated receptor γ coactivator-1α.
Figure 7
Figure 7. Excessive PGC1α alters mitochondrial properties in vivo.
(A) Representative electron microscopic images of glomeruli of control and Nefta-PGC1α–transgenic mice. Note podocyte hypertrophy with extensive glomerular capillary collapse in the Nefta-PGC1α mice. Arrowheads indicate collapsed glomerular capillary lumens; white arrows indicate binuclear podocytes; the dashed line area indicates a pseudocrescent. Higher magnification image shows a podocyte with numerous giant mitochondria and foot process effacement. Black arrows indicate mitochondria. GBM, glomerular basement membrane; endo, endothelial cell; mito, mitochondria. (B) Quantification of mitochondrial size in control and Nefta-PGC1α podocytes. Box-and-whisker plots depict the median (line within box), 2.5–97.5 percentile (whiskers), and first and third quartiles (bottom and top of box). **P < 0.01 compared with control by Student’s t test. (C) Mitochondrial gene expression in control and Nefta-PGC1α mice glomeruli (n = 8–9 per group). Ubiquinone oxidoreductase subunit A10 (Ndufa10), ATP synthase subunit β (Atp5b), optic atrophy 1 (Opa1), mitofusin 1 (Mfn1), Mfn2, dynamin-related protein 1 (Drp1), and mitochondrial fission 1 (Fis1) were evaluated. *P ≤ 0.05, **P ≤ 0.01, ***P ≤ 0.001, ****P ≤ 0.0001 by unpaired t test with Bonferroni correction. Nefta, nephrin-rtTA; PGC1α, peroxisome proliferator-activated receptor γ coactivator-1α.
Figure 8
Figure 8. PGC1α induces podocyte proliferation in vivo.
(A) Proliferating cell nuclear antigen (PNCA), Wilms tumor 1 (WT1), and TUNEL staining in control and Nefta-PGC1α mouse glomeruli. Scale bars: 10 μm. (B) Representative immunofluorescence staining of proliferating cell marker PCNA, podocyte marker WT1, and parietal epithelial cell marker claudin 1 in Nefta-PGC1α mice. Nefta, nephrin-rtTA; PGC1α, peroxisome proliferator-activated receptor γ coactivator-1α.
Figure 9
Figure 9. Nefta-PGC1α mice develop collapsing glomerulosclerosis.
(A) Periodic acid–Schiff (PAS) and Masson staining of kidney sections after starting doxycycline-containing food. (B) Quantification of proteinaceous cast (–4) in control and Nefta-PGC1α mice. (C) Quantification of glomerular sclerosis. (D) Quantification of tubular injury. (E) Representative silver staining of Nefta-PGC1α glomeruli. (F) qPCR analysis of podocyte differentiation markers and cyclin E, 1 week after doxycycline containing food (n = 8–9 per group). Synaptopodin (Synpo), nephrin (Nphs1), podocin (Nphs2), cyclin E (Ccne) were evaluated. Box-and-whisker plots depict the median (line within box), upper and lower quartiles (bounds of box), and minimum and maximum values (whiskers). (G) Transcript levels of genes associated with fibrosis at different time points. Collagen type I α 1 chain (Col1a1), collagen type 3 α 1 chain (Col3a1), and fibronectin (Fn) were evaluated. *P ≤ 0.05, **P ≤ 0.01,***P ≤ 0.001, ****P ≤ 0.0001 by unpaired t test with Bonferroni correction or 1-way ANOVA with post-hoc analysis. ns, not significant; Nefta, nephrin-rtTA; PGC1α, peroxisome proliferator-activated receptor γ coactivator-1α.

References

    1. Susztak K, Raff AC, Schiffer M, Böttinger EP. Glucose-induced reactive oxygen species cause apoptosis of podocytes and podocyte depletion at the onset of diabetic nephropathy. Diabetes. 2006;55(1):225–233. doi: 10.2337/diabetes.55.01.06.db05-0894. - DOI - PubMed
    1. Sato Y, et al. Urine podocyte mRNAs mark progression of renal disease. J Am Soc Nephrol. 2009;20(5):1041–1052. doi: 10.1681/ASN.2007121328. - DOI - PMC - PubMed
    1. Reidy K, Kang HM, Hostetter T, Susztak K. Molecular mechanisms of diabetic kidney disease. J Clin Invest. 2014;124(6):2333–2340. doi: 10.1172/JCI72271. - DOI - PMC - PubMed
    1. Kato H, Susztak K. Repair problems in podocytes: Wnt, Notch, and glomerulosclerosis. Semin Nephrol. 2012;32(4):350–356. doi: 10.1016/j.semnephrol.2012.06.006. - DOI - PMC - PubMed
    1. Albaqumi M, Barisoni L. Current views on collapsing glomerulopathy. J Am Soc Nephrol. 2008;19(7):1276–1281. doi: 10.1681/ASN.2007080926. - DOI - PubMed