

Management adaptation of invertebrate fisheries to an extreme marine heat wave event at a global warming hot spot
- PMID: 28725352
- PMCID: PMC5513294
- DOI: 10.1002/ece3.2137
Management adaptation of invertebrate fisheries to an extreme marine heat wave event at a global warming hot spot
Abstract
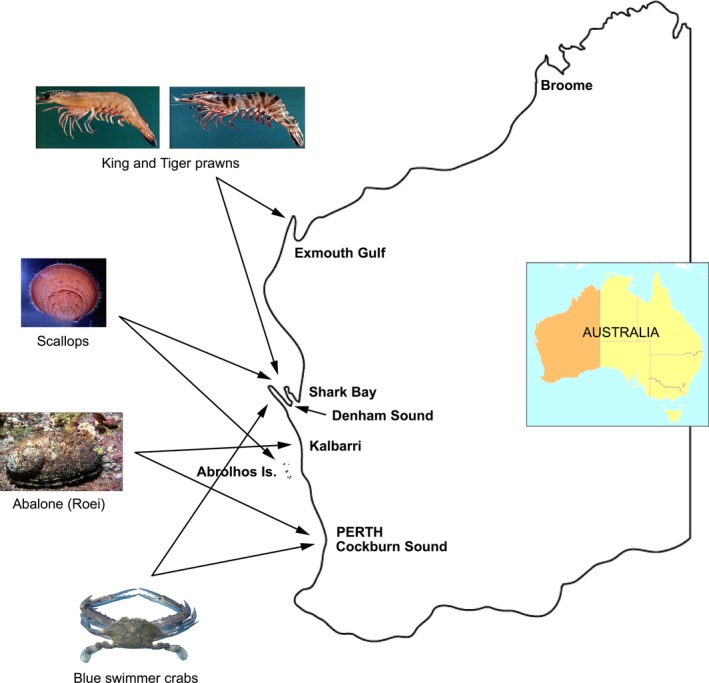
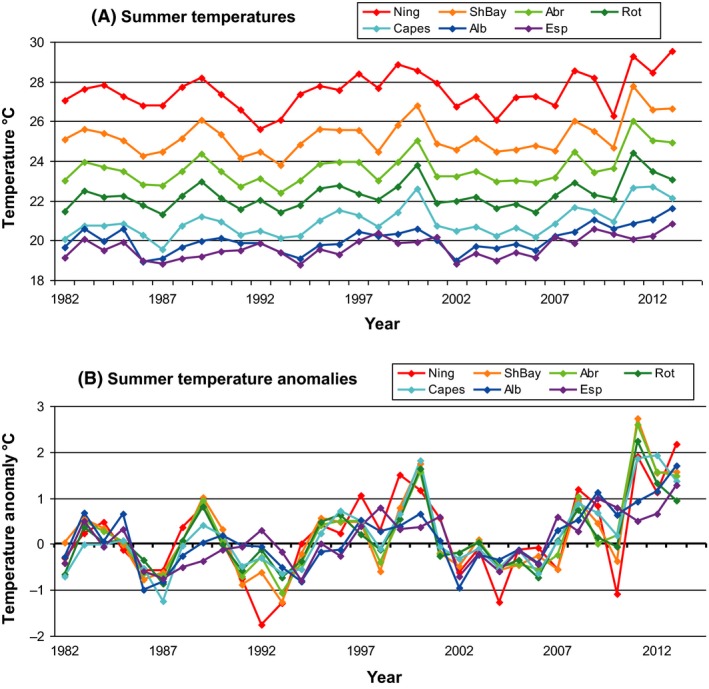
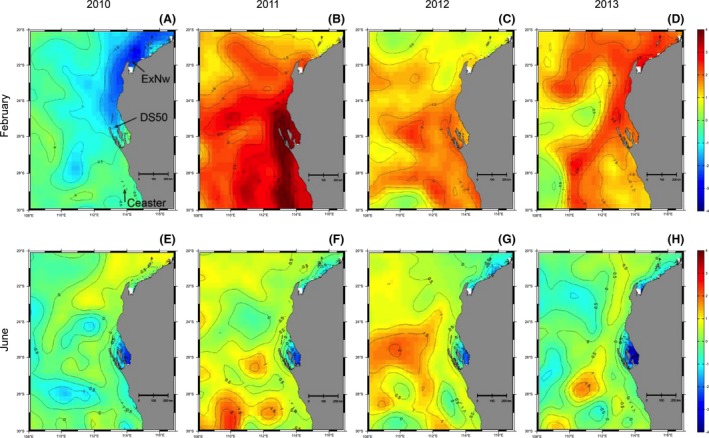
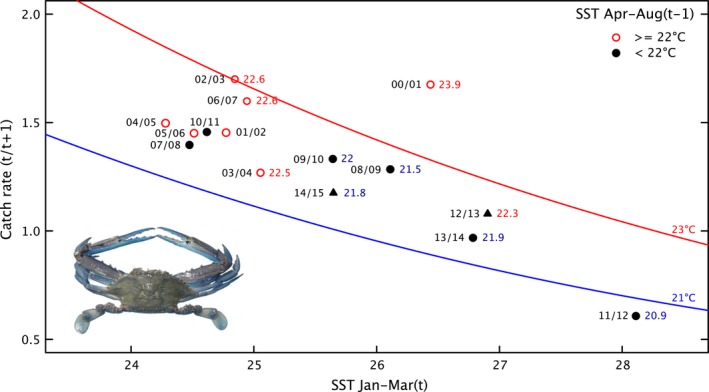
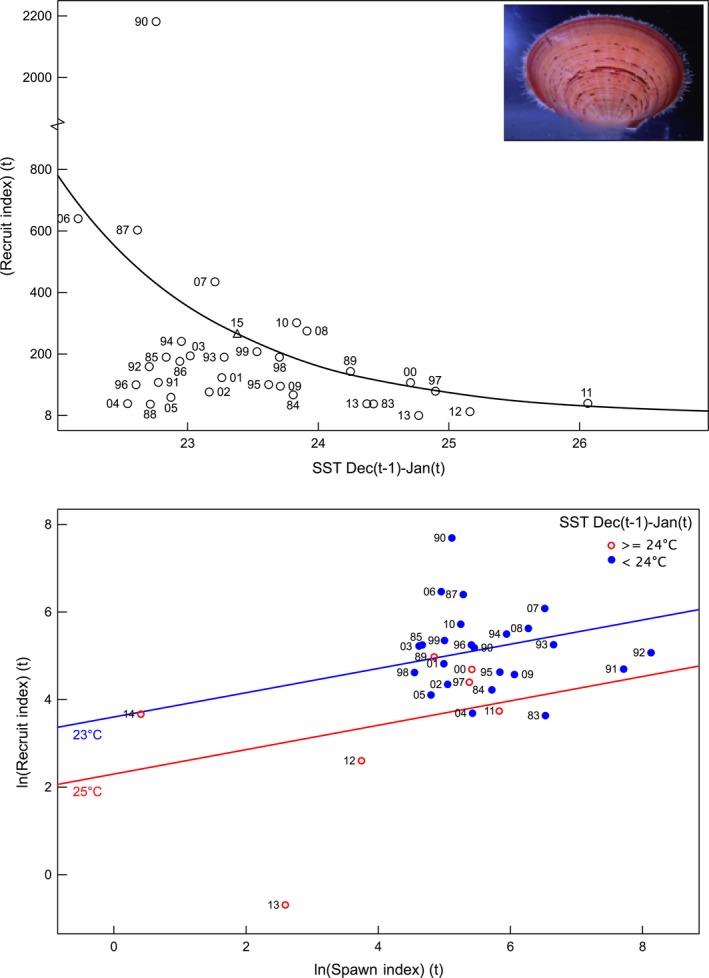
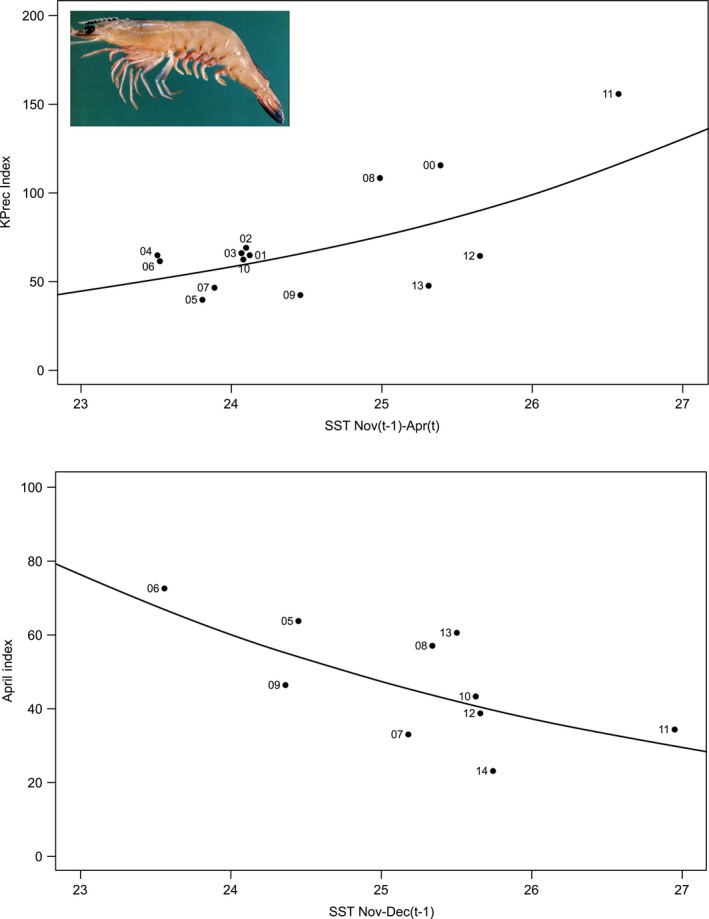
An extreme marine heat wave which affected 2000 km of the midwest coast of Australia occurred in the 2010/11 austral summer, with sea-surface temperature (SST) anomalies of 2-5°C above normal climatology. The heat wave was influenced by a strong Leeuwin Current during an extreme La Niña event at a global warming hot spot in the Indian Ocean. This event had a significant effect on the marine ecosystem with changes to seagrass/algae and coral habitats, as well as fish kills and southern extension of the range of some tropical species. The effect has been exacerbated by above-average SST in the following two summers, 2011/12 and 2012/13. This study examined the major impact the event had on invertebrate fisheries and the management adaption applied. A 99% mortality of Roei abalone (Haliotis roei) and major reductions in recruitment of scallops (Amusium balloti), king (Penaeus latisulcatus) and tiger (P. esculentus) prawns, and blue swimmer crabs were detected with management adapting with effort reductions or spatial/temporal closures to protect the spawning stock and restocking being evaluated. This study illustrates that fisheries management under extreme temperature events requires an early identification of temperature hot spots, early detection of abundance changes (preferably using pre-recruit surveys), and flexible harvest strategies which allow a quick response to minimize the effect of heavy fishing on poor recruitment to enable protection of the spawning stock. This has required researchers, managers, and industry to adapt to fish stocks affected by an extreme environmental event that may become more frequent due to climate change.
Keywords: Climate change; crabs; environmental effects; prawns; pre‐recruit; scallops; stock‐recruitment; water temperature.
Figures
References
-
- Bond, N. A. , Cronin M. F., Freeland H., and Mantua N.. 2015. Causes and impacts of the 2014 warm anomaly in the NE Pacific. Geophys. Res. Lett. 42:3414–3420.
-
- Cai, W. , Wang G., Santoso A., McPhaden M. J., Wu L., Jin F.‐F., et al. 2015. Increased frequency of extreme La Nina events under greenhouse warming. Nature Clim. Change 5:132–137, advance online publication.
-
- Caputi, N. , Fletcher W. J., Pearce A., and Chubb C. F.. 1996. Effect of the Leeuwin Current on the recruitment of fish and invertebrates along the Western Australian coast. Mar. Freshw. Res. 47:147–155.
-
- Caputi, N. , de Lestang S., Feng M., and Pearce A.. 2009. Seasonal variation in the long‐term warming trend in water temperature off the Western Australian coast. Mar. Freshw. Res. 60:129–139.
LinkOut - more resources
Full Text Sources
Other Literature Sources
