. 2016 Nov 17:2:16032.
doi: 10.1038/npjsba.2016.32. eCollection 2016.

MUFINS: multi-formalism interaction network simulator

Affiliations

MUFINS: multi-formalism interaction network simulator

Huihai Wu et al. NPJ Syst Biol Appl. .

Abstract

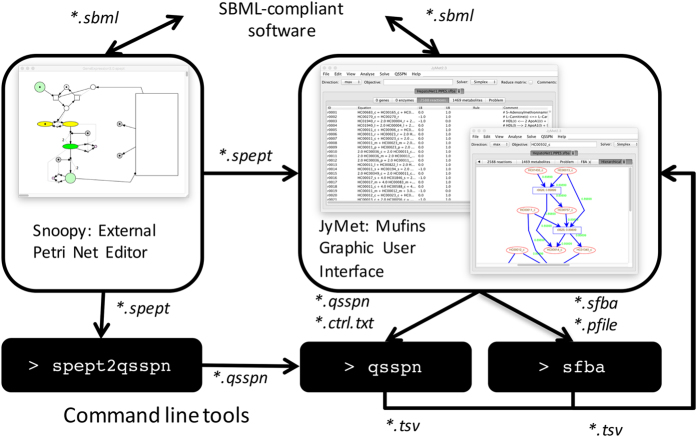
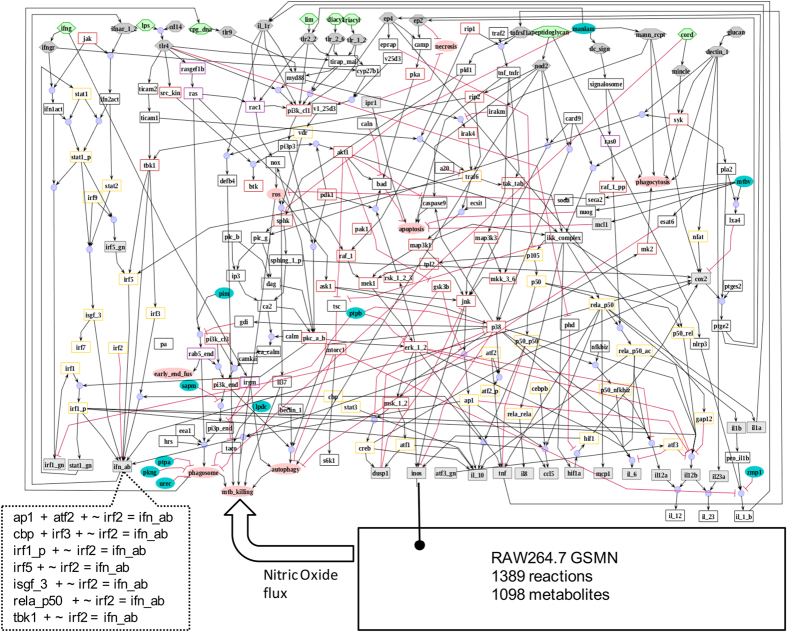
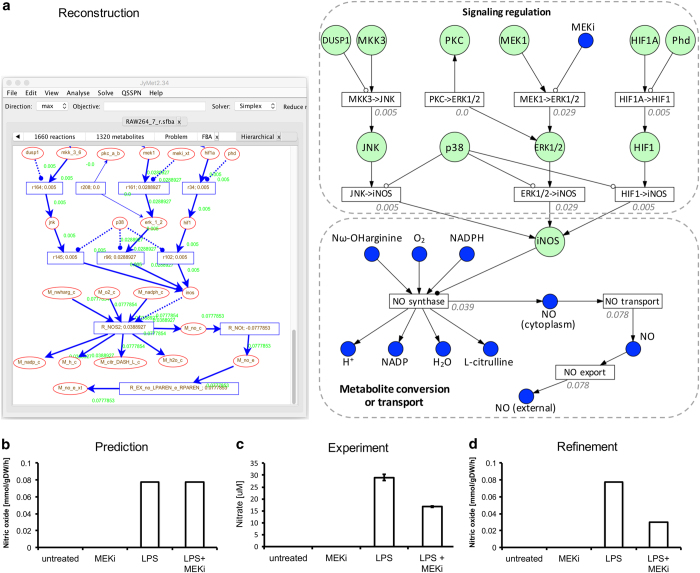
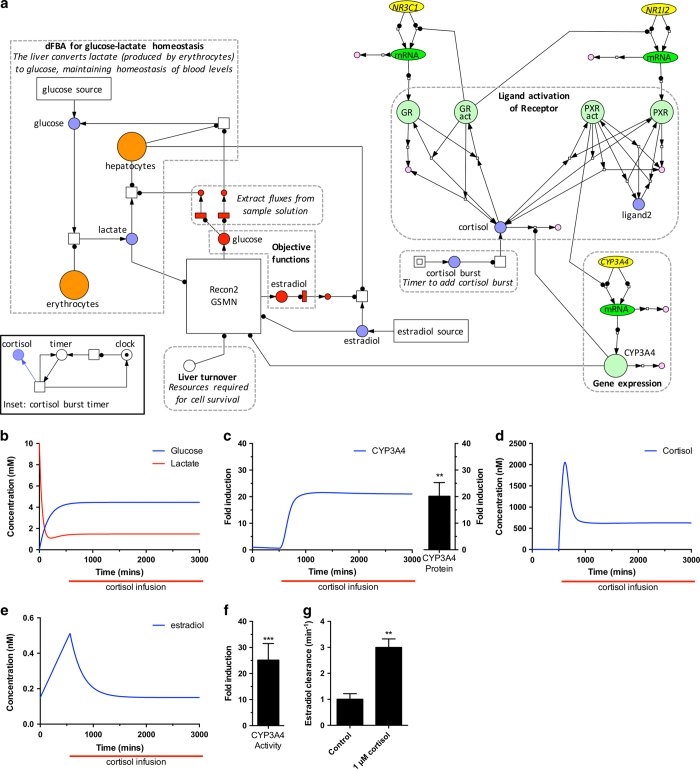
Systems Biology has established numerous approaches for mechanistic modeling of molecular networks in the cell and a legacy of models. The current frontier is the integration of models expressed in different formalisms to address the multi-scale biological system organization challenge. We present MUFINS (MUlti-Formalism Interaction Network Simulator) software, implementing a unique set of approaches for multi-formalism simulation of interaction networks. We extend the constraint-based modeling (CBM) framework by incorporation of linear inhibition constraints, enabling for the first time linear modeling of networks simultaneously describing gene regulation, signaling and whole-cell metabolism at steady state. We present a use case where a logical hypergraph model of a regulatory network is expressed by linear constraints and integrated with a Genome-Scale Metabolic Network (GSMN) of mouse macrophage. We experimentally validate predictions, demonstrating application of our software in an iterative cycle of hypothesis generation, validation and model refinement. MUFINS incorporates an extended version of our Quasi-Steady State Petri Net approach to integrate dynamic models with CBM, which we demonstrate through a dynamic model of cortisol signaling integrated with the human Recon2 GSMN and a model of nutrient dynamics in physiological compartments. Finally, we implement a number of methods for deriving metabolic states from ~omics data, including our new variant of the iMAT congruency approach. We compare our approach with iMAT through the analysis of 262 individual tumor transcriptomes, recovering features of metabolic reprogramming in cancer. The software provides graphics user interface with network visualization, which facilitates use by researchers who are not experienced in coding and mathematical modeling environments.


Conflict of interest statement

The authors declare no conflict of interest.

Figures

Figure 1
Figure 1
Overview of MUFINS. All the calculations are performed by two computational engines, which can be also run as stand-alone command line tools. The sfba implements CBM methods and qsspn performs QSSPN simulations. JyMet is a graphic interface to all methods providing spreadsheet representation of models and results as well as metabolic network visualization and plots. JyMet writes input files for computational engines, starts calculations, imports output files and displays results. In the case of QSSPN simulations, Petri Net connectivity can be graphically edited by Snoopy software, a standard Petri Net tool, which we use as external editor. JyMet imports Snoopy files and provides spreadsheet interface allowing editing of QSSPN parameters or independent creation of entire QSSPN model. Conversion of Snoopy files directly to qsspn engine is also possible with command line python script spept2qsspn. Both JyMet and Snoopy import and export SBML file providing connectivity to other SBML-compliant tools. The file formats used for software component communication are indicated by their default extensions and described in Supplementary File Formats. CBM, constraint-based modeling; MUFINS, MUlti-Formalism Interaction Network Simulator; SBML, Systems Biology Markup Language; QSSPN, Quasi-Steady State Petri Net.
Figure 2
Figure 2
The model of cell signaling, gene regulation and whole-cell metabolism in RAW264.7 macrophage. A signaling and gene regulatory network of 286 interactions between 205 species, created in logical hypergraph formalism is shown. This network was subsequently converted to FBA formalism with linear inhibitory constraints and coupled to the RAW264.7 GSMN through regulation of the iNOS gene. Nitric oxide synthesis, a major metabolic flux in RAW264.7 macrophages responding to a pathogen, was then simulated using constraints derived from both stoichiometry of whole-cell metabolism and logical rules within a large-scale regulatory network. The inset shows the conversion of logical hyperedges determining the fate of ifn_ab to reaction formulas with linear inhibitor constraint: For all reactions producing ifn_ab, the molecule irf2 is added, preceded by the ‘~’ sign to indicate an inhibitor. This is parsed by MUFINS to mean that the reaction flux is inhibited (i.e., 0) if ifr2 is present. FBA, Flux Balance Analysis; GSMN, Genome-Scale Metabolic Network; iNOS, inducible nitric oxide synthase; MUFINS, MUlti-Formalism Interaction Network Simulator.
Figure 3
Figure 3
Mechanistic interpretation of experimental data on perturbation of whole-cell metabolic function by signaling network input and inhibitor. MUFINS was used to integrate a genome-scale metabolic model of the mouse macrophage (RAW264.7) with a large-scale regulatory network. Perturbation of whole-cell metabolism was simulated through activation and inhibition of the signaling network with external production of nitric oxide set as the objective function. Predicted data was then compared with the experimental data. (a) The left panel shows a screenshot of the JyMet interface, demonstrating on screen visualization of the reconstruction, created by automatic hierarchical layout with manual adjustment. Hatched lines are used to indicate regulatory signals, representing inhibition (circle end) or stimulation (arrow head). The right panel is a manually created image representing the pathway examined through JyMet; arrows represent signal flux, while open and filled circles represent inhibition and stimulation, respectively. The visualization depicts where signaling pathways converge on the iNOS gene, which is required for nitric oxide (NO) production in the whole-cell stoichiometric model. Flux rates for an example FBA solution are displayed on the network diagram; on the right panel only flux rates for each transitions are presented for clarity, while the left panel also shows the contribution of each substance to the flux. (b) The original reconstruction was able to predict the increase in NO production following stimulation with LPS, but not the impact of a MEK inhibitor, when compared with the experimental data of nitrate levels in RAW264.7 cell-conditioned medium (c). Nitrate can only be produced by non-enzymatic conversion of NO produced by RAW264.7 cells, and as there is no nitrate consumption in the medium, nitrate concentrations are proportional to nitric oxide production flux. (d) Refinement of the signaling network led to agreement between in silico prediction and in vitro measurement. The refinement was based upon two mechanistic hypotheses: (i) ERK1/2 is a more potent transcriptional activator of the iNOS gene than JNK and HIF1, and (ii) MEK1 is a more potent ERK1/2 kinase than PKC. FBA, Flux Balance Analysis; iNOS, inducible nitric oxide synthase; LPS, lipopolysaccharide; MUFINS, MUlti-Formalism Interaction Network Simulator; QSSPN, Quasi-Steady State Petri Net.
Figure 4
Figure 4
Multi-formalism simulation integrating cortisol signaling with the human Recon2 GSMN reveals a drug interaction with estradiol clearance. (a) The Petri Net diagram of network connectivity created in the Snoopy editor, with overlaid comments for clarity. Color and symbol size has been manually set to match SBGN molecule types and transition types specific to QSSPN. The PN connectivity to implement a timer for administering a network perturbation (cortisol burst), is contained within a coarse transition and shown as an insert. (b) Simulation of glucose and lactate dynamics in the blood physiological compartment, demonstrating a convergence to physiologically realistic steady states. Perturbation of the system through a simulated cortisol infusion starting after 500 min elicits a dynamic alteration in the signaling network, resulting in (c) a predicted increase in CYP34A protein levels, which is confirmed in primary human hepatocytes. The increased expression of CYP3A4 protein is predicted to increase flux through reactions catalyzed by this enzyme, leading to: (d) degradation of excess cortisol and establishment of new steady state; (e) a drug–drug interaction for a second CYP3A4 substrate (estradiol), contained within the GSMN, leading to a decrease in it’s steady-state level. The predicted increase in CYP3A4 activity following cortisol exposure is confirmed in primary human hepatocytes (f), as is the enhanced rate of estradiol clearance (g). FBA, Flux Balance Analysis; GSMN, Genome-Scale Metabolic Network; mRNA, messenger RNA; QSSPN, Quasi-Steady State Petri Net. **P<0.01, ***P<0.001.

References

    1. Gillespie, D. T. Exact stochastic simulation of coupled chemical-reactions. J. Phys. Chem. 81, 2340–2361 (1977).
    1. Tyson, J. J., Chen, K. & Novak, B. Network dynamics and cell physiology. Nat. Rev. Mol. Cell Biol. 2, 908–916 (2001). - PubMed
    1. Bordbar, A. et al. Constraint-based models predict metabolic and associated cellular functions. Nat. Rev. Genet. 15, 107–120 (2014). - PubMed
    1. Orth, J. D., Thiele, I. & Palsson, B. O. What is flux balance analysis? Nat. Biotechnol. 28, 245–248 (2010). - PMC - PubMed
    1. Lewis, N. E., Nagarajan, H. & Palsson, B. O. Constraining the metabolic genotype-phenotype relationship using a phylogeny of in silico methods. Nat. Rev. Microbiol. 10, 291–305 (2012). - PMC - PubMed