Review
. 2017 Jan 5:3:16034.
doi: 10.1038/npjsba.2016.34. eCollection 2017.

Systems biology driving drug development: from design to the clinical testing of the anti-ErbB3 antibody seribantumab (MM-121)

Affiliations
Review

Systems biology driving drug development: from design to the clinical testing of the anti-ErbB3 antibody seribantumab (MM-121)

Birgit Schoeberl et al. NPJ Syst Biol Appl. .

Abstract

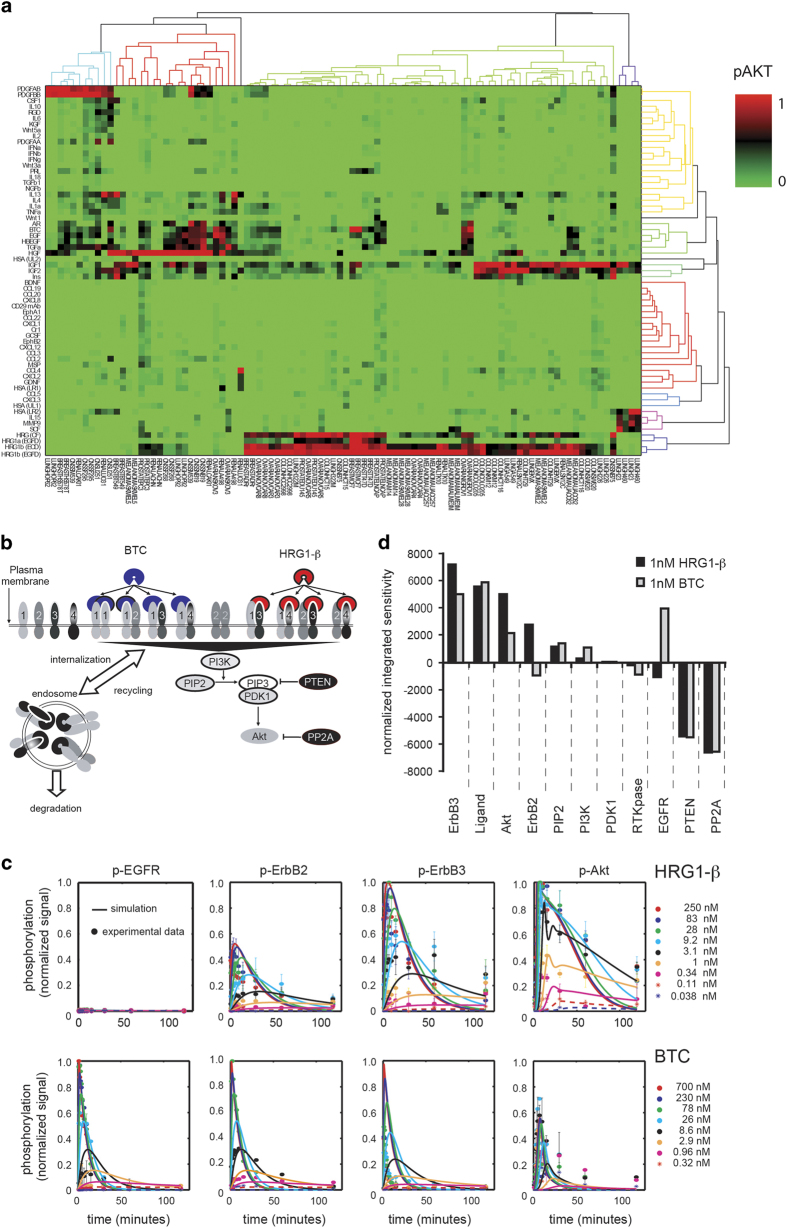
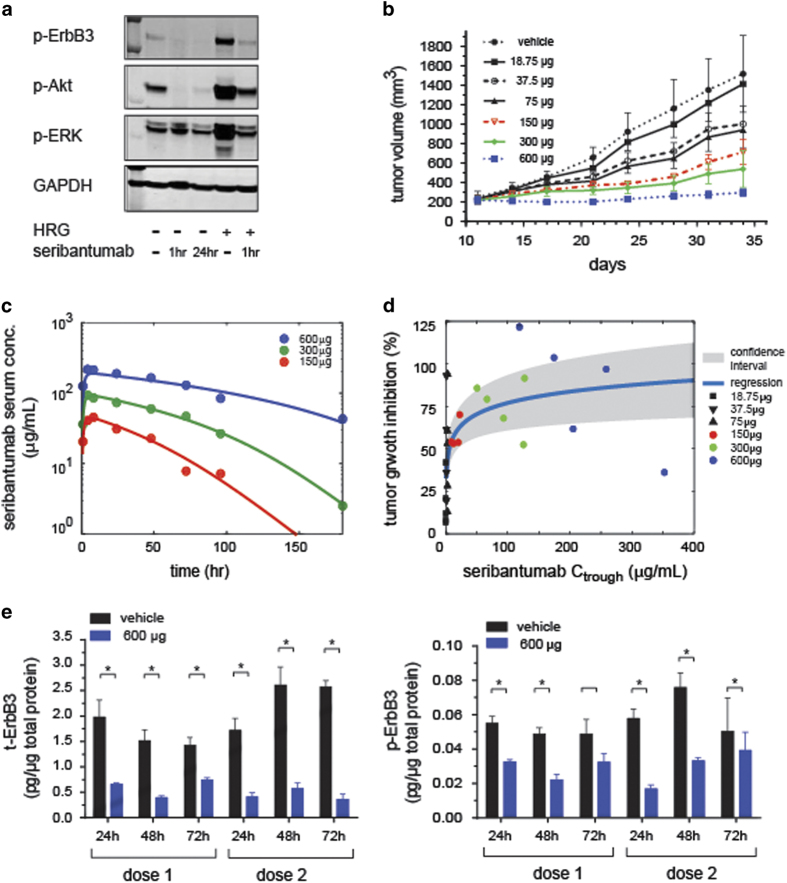
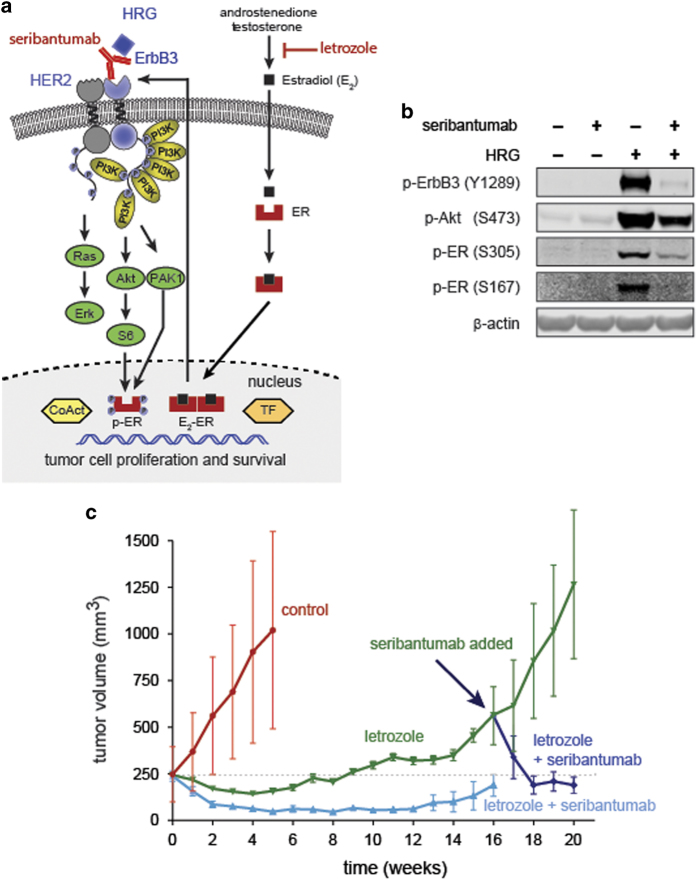
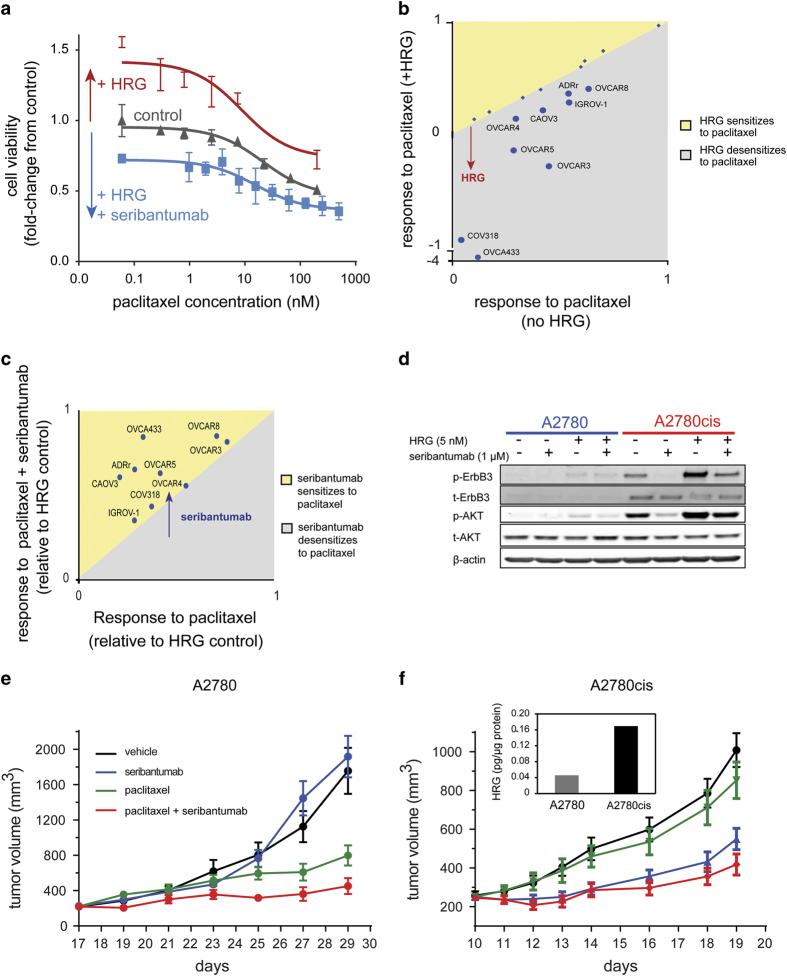
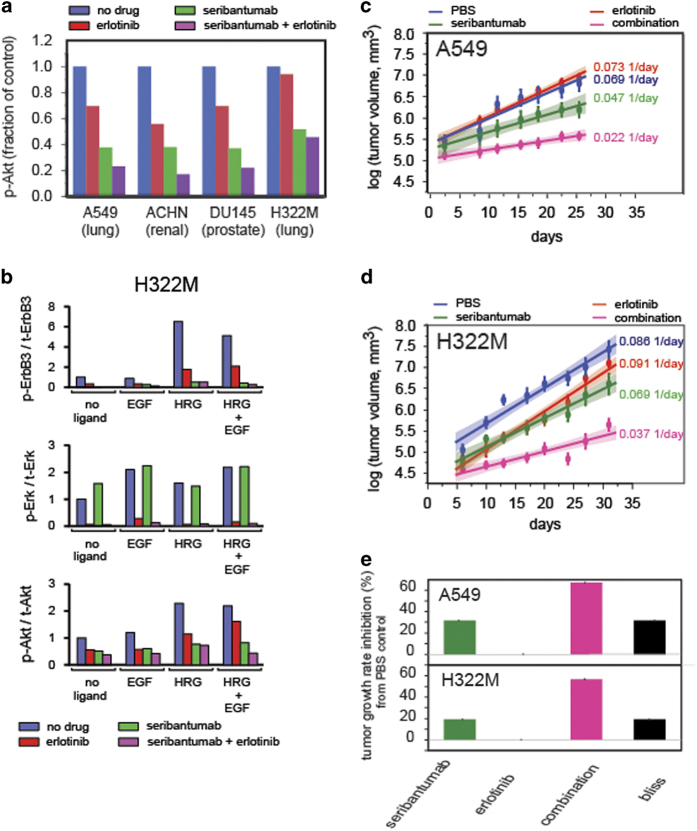
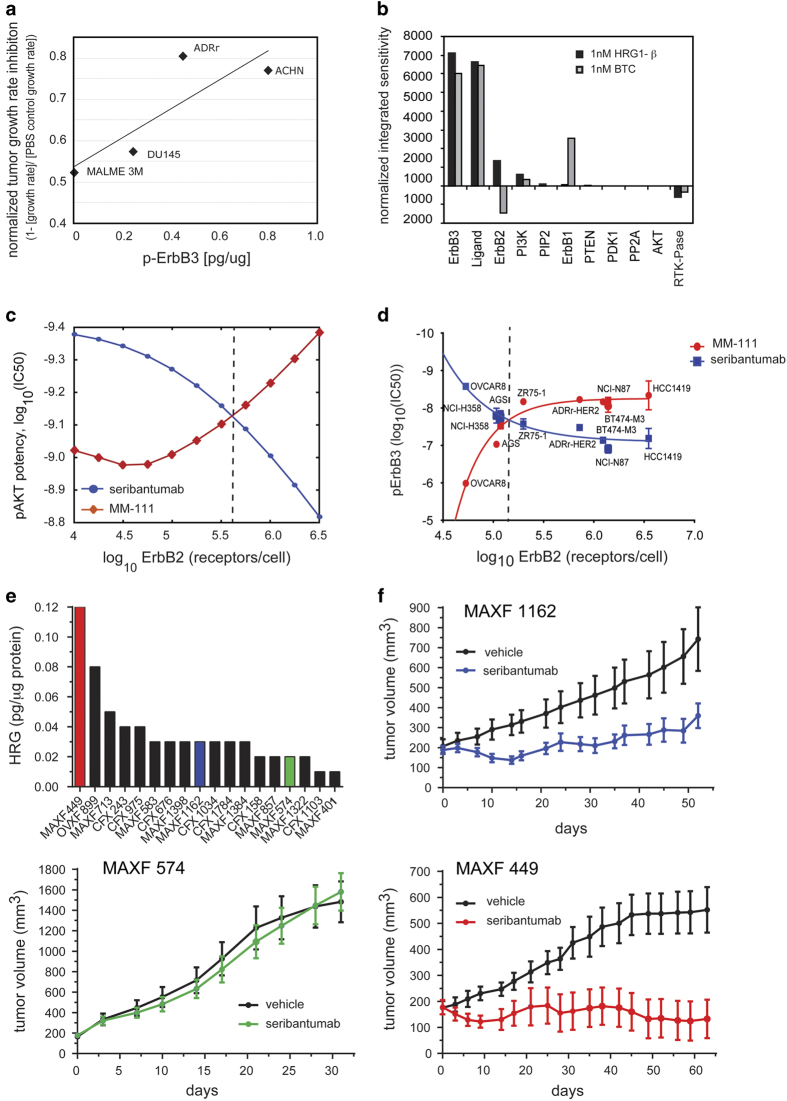
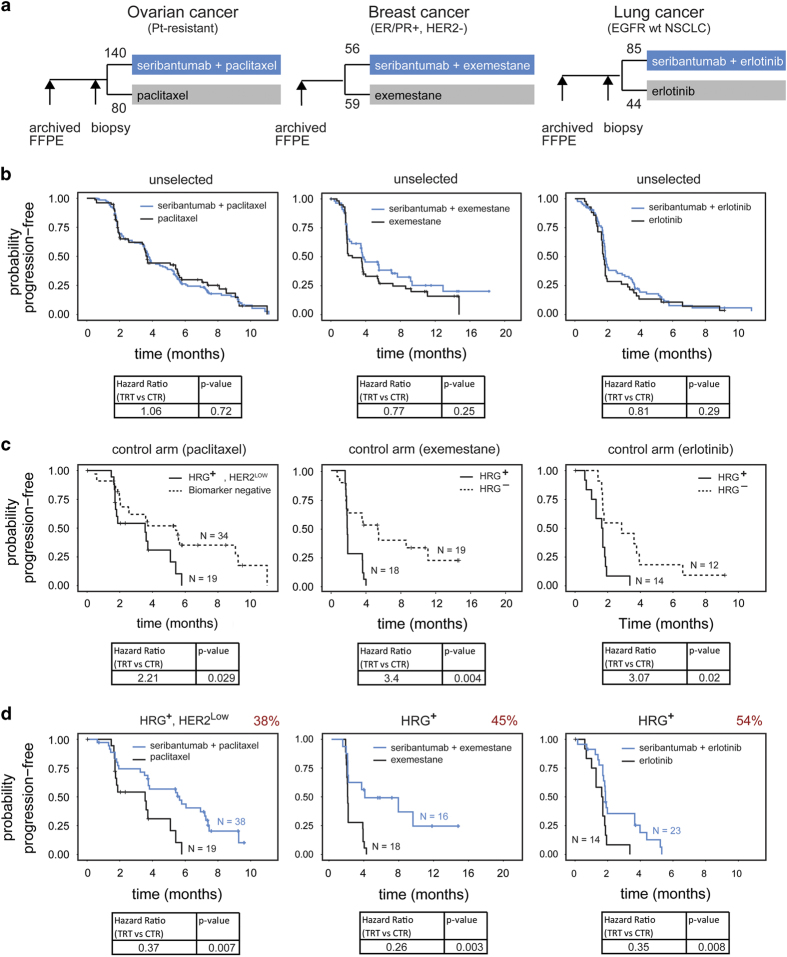
The ErbB family of receptor tyrosine kinases comprises four members: epidermal growth factor receptor (EGFR/ErbB1), human EGFR 2 (HER2/ErbB2), ErbB3/HER3, and ErbB4/HER4. The first two members of this family, EGFR and HER2, have been implicated in tumorigenesis and cancer progression for several decades, and numerous drugs have now been approved that target these two proteins. Less attention, however, has been paid to the role of this family in mediating cancer cell survival and drug tolerance. To better understand the complex signal transduction network triggered by the ErbB receptor family, we built a computational model that quantitatively captures the dynamics of ErbB signaling. Sensitivity analysis identified ErbB3 as the most critical activator of phosphoinositide 3-kinase (PI3K) and Akt signaling, a key pro-survival pathway in cancer cells. Based on this insight, we designed a fully human monoclonal antibody, seribantumab (MM-121), that binds to ErbB3 and blocks signaling induced by the extracellular growth factors heregulin (HRG) and betacellulin (BTC). In this article, we present some of the key preclinical simulations and experimental data that formed the scientific foundation for three Phase 2 clinical trials in metastatic cancer. These trials were designed to determine if patients with advanced malignancies would derive benefit from the addition of seribantumab to standard-of-care drugs in platinum-resistant/refractory ovarian cancer, hormone receptor-positive HER2-negative breast cancer, and EGFR wild-type non-small cell lung cancer (NSCLC). From preclinical studies we learned that basal levels of ErbB3 phosphorylation correlate with response to seribantumab monotherapy in mouse xenograft models. As ErbB3 is rapidly dephosphorylated and hence difficult to measure clinically, we used the computational model to identify a set of five surrogate biomarkers that most directly affect the levels of p-ErbB3: HRG, BTC, EGFR, HER2, and ErbB3. Preclinically, the combined information from these five markers was sufficient to accurately predict which xenograft models would respond to seribantumab, and the single-most accurate predictor was HRG. When tested clinically in ovarian, breast and lung cancer, HRG mRNA expression was found to be both potentially prognostic of insensitivity to standard therapy and potentially predictive of benefit from the addition of seribantumab to standard of care therapy in all three indications. In addition, it was found that seribantumab was most active in cancers with low levels of HER2, consistent with preclinical predictions. Overall, our clinical studies and studies of others suggest that HRG expression defines a drug-tolerant cancer cell phenotype that persists in most solid tumor indications and may contribute to rapid clinical progression. To our knowledge, this is the first example of a drug designed and clinically tested using the principles of Systems Biology.


Conflict of interest statement

The authors declare no conflict of interest.

Figures

Figure 1
Figure 1
Computational model of ErbB signaling. (a) Heat map of ligand screen following subtraction of each cell lines median HSA control-based Akt signal and normalizing the signals within a cell line to the maximum ligand activation for that cell line. (b) Schematic depiction of the ErbB signaling network showing the receptors EGFR–ErbB4, BTC binding to EGFR and HRG binding to the ErbB3 receptor, receptor dimerization, dimer internalization and recycling, and interactions leading to activation of the PI3K-Akt cascade. The computational model is an interpretation of this schematic, using mass action kinetics. Because of the low expression observed in vitro, ErbB4 was omitted from the computational model. (c) The computational model was calibrated to a high-density experimental signaling data set. Phosphorylated-EGFR, HER2 and HER3− as well as p-Akt were measured in serum-starved ADRr ovarian cancer cells stimulated with HRG or BTC. The model was built in MATLAB SimBiology v2.1. A genetic algorithm was used to fit key parameters. Both experimental and simulated data are normalized to the largest signal for each target under either stimulus. (d) Sensitivity analysis of the ErbB model. The normalized time-integrated sensitivity of Akt phosphorylation to each non-zero species was determined by varying the amount of each non-zero species and simulating the time course of p-Akt in response to 1 nmol/l HRG or BTC, with the calibrated computational model. The normalized sensitivity integrated over the 2 h time course is shown, with species ranked according to their sensitivity during HRG stimulation. Figures 1b and c from Schoeberl et al. Reprinted with permission from AAAS.
Figure 2
Figure 2
Single agent activity, pharmacokinetic and pharmacodynamic properties of seribantumab. (a) Seribantumab inhibits both basal and HRG-induced phosphorylation of ErbB3 and Akt in A549 cell lines. Serum-starved A549 cells were pre-treated with seribantumab (250 nmol/l) for 1 h or 24 h, followed by treatment with 10 nmol/l HRG for 10 min. (b) Tumor response in A549 xenografts following administration (μg/dose, q3d, intraperitoneal (i.p.)) of various seribantumab doses (n=5/group). Tumor growth was measured twice per week by calipers and plotted as mean±s.e.m. (c) Pharmacokinetic profile of seribantumab in serum obtained from A549 tumor bearing mice. Serum samples were collected at 1, 4, 8, 24, 48, 72, 96, and 168 h following single dose of seribantumab (n=3 mice/time point). A one-compartment pharmacokinetic model with first order absorption (lines) and non-linear clearance was used to fit the data set (dots) and estimate the pharmacokinetic parameters. (d) Relationship between tumor growth inhibition and serum trough levels following treatment with various doses of seribantumab (colored symbols represent experimental data and black symbols represent data at lower doses predicted using the PK model simulations). (e) Pharmacodynamic effects of seribantumab in A549 xenografts. Graph presents mean±s.d. of t-ErbB3 (left) and p-ErbB3 (right) levels as measured in A549 tumors following treatment with seribantumab (600 μg/dose, q3d, i.p). Tumors were harvested at 24, 48 and 72 h following either single dose or two doses of seribantumab (n=3 mice/time point). *P<0.05 versus control treated (by Wilcoxon rank-sum test).
Figure 3
Figure 3
(a) Schematic illustration highlighting HRG-driven ErbB3 signaling as a mechanism mediating lack of responsiveness to endocrine therapy. (b) Seribantumab inhibits HRG-induced phosphorylation of ErbB3, Akt and ER in MCF-7Ca cells. Serum-starved MCF-7Ca cells were pre-treated with seribantumab (1 μmol/l) for 1 h, followed by treatment with 10 nmol/l HRG for 10 min. Cell lysates were analyzed by immunoblotting with antibodies for p-ErbB3 (Y1289), p-Akt (S473) and p-ER (S305 and S167). Anti-β-actin antibody was used as a loading control. (c) Seribantumab and letrozole co-treatment delays the onset of tumor tolerance to letrozole and restores sensitivity to letrozole in MCF-7Ca xenografts. MCF-7Ca xenograft tumors were generated in female, ovariectomized nude mice, which were randomized to receive vehicle (‘Control’; 0.3% HPC in 0.9% NaCl, twice weekly (Q2W), IP; 15 mice/group), seribantumab (750 μg/mouse, Q2W, IP; 15 mice/group), letrozole (10 μg/mouse/day×5 days/week (QD×5), subcutaneous injection (SQ); 60 mice/group), or letrozole in combination with seribantumab, dosed as indicated for the monotherapies (15 mice/group). Changes in mean tumor volume (±s.e.m.) were determined weekly by caliper measurement. Following the loss of sensitivity to letrozole (week 14), mice in the letrozole-only group were re-randomized into 15 mice/group to receive: letrozole alone; seribantumab alone; or a combination of letrozole and seribantumab.
Figure 4
Figure 4
(a) The ovarian cancer cell line ADRr was treated with paclitaxel at increasing doses either alone (gray line), in the presence of 5 nmol/l HRG (red line) or in the presence of 5 nmol/l HRG and 1 μmol/l seribantumab (blue line). The graph illustrates the relative cell viability (normalized to media control) in a 96 h spheroid formation assay with CellTiter Glo as readout of viability. The arrows highlight the effect of HRG or HRG in combination with seribantumab on the response to paclitaxel. (b) A panel of ovarian cancer cell lines was screened using the same assay as in (a). The Area Under the Curve (AUC) fold-change relative to media control of all ovarian cancer cell lines screened, was plotted for paclitaxel in the absence or presence of HRG. Diamond shapes indicate cell lines that are non-responsive to HRG and the larger circles represent the HRG-responding cell lines. The gray region in the plot represents the area where HRG desensitizes cells to paclitaxel. (c) The AUCs of all HRG-responding cell lines screened was calculated for paclitaxel in the presence of HRG, with or without 1 μmol/l seribantumab. The yellow and gray represent the areas in which seribantumab sensitized versus desensitized cells to the drug, respectively. (d) Seribantumab inhibits both basal and HRG-induced p-ErbB3 and p-Akt in A2780cis. Serum-starved A2780 and A2780cis were pre-treated with seribantumab (1 μmol/l) for 24 h, followed by treatment with 10 nmol/l HRG for 10 min. A2780cis cells displays upregulation of basal p-ErbB3 and p-Akt compared with parental A2780 cell line. In vivo activity of seribantumab in A2780 (e) and A2780cis (f) ovarian cancer xenografts. Tumors were established subcutaneously (s.c.) in nu/nu mice. Following randomization, animals were treated with vehicle control (PBS), seribantumab (600 μg/dose, q3d, intraperitoneal (i.p.)), paclitaxel (40 mg/kg, q7d, i.p.) or combination of both drugs (n=8/group). Tumor volumes were calculated following caliper measurement and plotted as mean±s.e.m.
Figure 5
Figure 5
Dual Targeting of EGFR and ErbB3: (a) Mechanistic model to predict the response of seribantumab and erlotinib combination in A549, ACHN, DU145 and H322M cells. The initial conditions for the four cell lines (e.g., receptor levels) were set to those measured by qFACS under basal conditions (Supplementary Table S3).For each cell line the simulation was run for 30 min to allow the receptors to equilibrate. The inhibitors were then introduced for an additional 30 min, followed by virtual stimulation with HRG (1 nmol/l) and BTC (1 nmol/l) for 10 min to assess the effect of the inhibitors on Akt phosphorylation. Values are normalized to cells treated with HRG and BTC alone. (b) In vitro signal inhibition with the combination of seribantumab and erlotinib in H322M cells. Serum-starved H322M cells were pre-treated with either seribantumab (1 μmol/l), erlotinib (1μmol/l) or the combination for 30 min, followed by treatment with different ligands; HRG (10 nmol/l) alone, EGF (10 nmol/l) alone or both ligands for 1 h. Cell lysates were used for western blot analysis. In vivo activity of seribantumab in A549 (c) and H322M (d) xenografts. Subcutaneous tumors were established in nu/nu mice. Following randomization, animals were treated with vehicle control (PBS), seribantumab (300 μg/dose, q3d, intraperitoneal (i.p.)), erlotinib (25 mg/kg, q3d, oral gavage) or combination of both drugs (n=8/group). Tumor growth was measured twice per week by calipers and plotted as mean±s.e.m. and plotted on a log scale to assess the tumor growth kinetics for each treatment arm. (e) Tumor growth rate inhibition for A549 and the H322M xenograft model for the individual treatment arms and the combination compared with Bliss independence.
Figure 6
Figure 6
(a) Normalized tumor growth rate inhibition observed in MALME 3 M, DU145, ADRr and ACHN cell lines treated q3d with 300 μg/dose seribantumab plotted as a function of p-ErbB3 levels measured by ELISA in untreated tumors of about 200–300 mm3. (b) Sensitivity analysis of the ErbB model. The normalized time-integrated sensitivity of p-ErbB3 phosphorylation to each non-zero species was determined by varying the amount of each non-zero species and simulating the time course of p-ErbB3 in response to 1 nmol/l HRG or BTC, with the calibrated computational model. The normalized sensitivity integrated over the 2 h time course is shown, with species ranked according to their sensitivity during HRG stimulation. (c) Simulations results indicate that an anti-ErbB3 antibody (seribantumab, in blue) would be more potent in the HER2 low setting, while an ErbB3/HER2 bispecific molecule would be most effective in the HER2-high setting. In the simulated experiment, after 30 min incubation with a dose titration of MM-111 or MM-121 cells expressing different levels of HER2 were stimulated for 10 min with 1 nmol/l HRG. The p-Akt IC50 values derived from the simulations are plotted as a function of the HER2 expression levels. (d) Experimental validation of the simulated observation that the potency of MM-111 and seribantumab vary with the HER2 levels. The annotated cell lines were cultured in 4% serum, stimulated for 5 h with 5 nmol/l HRG, followed by drug treatment for another 5 h. Total ErbB3 and p-ErbB3 was measured using ELISA and IC50 curves fitted and plotted against the total ErB2 levels by qFACS. (e) HRG levels in patient-derived xenograft models. Tumor lysates were prepared from untreated tumors and HRG levels determined using ELISA method. (f) Single agent activity of seribantumab measured in select patient-derived xenografts; MAXF449, MAXF1162 and MAXF574. Tumors were established subcutaneously in nu/nu mice. Following randomization, animals were treated with vehicle control (PBS) or seribantumab (600 μg/dose, q3d, i.p.) Tumor growth was measured twice per week by calipers and plotted as mean±s.e.m. (n=8/group).
Figure 7
Figure 7
(a) Graphical description of the trial design of the three randomized Phase 2 trials in metastatic cancer: in combination with paclitaxel versus paclitaxel alone in platinum-resistant/refractory ovarian cancer; in combination with exemestane versus exemestane plus placebo in ER/PR+, HER2− breast cancer and in combination with erlotinib versus erlotinib alone in EGFR wild-type non-small cell lung cancer. (b) Kaplan-Meier plots of progression-free survival (PFS) in the unselected population across the three trials and the observed Hazard Ratios. (c) HRG appeared to be a prognostic marker of rapid progression on the control arm as indicated by the Kaplan-Meier plots of PFS of the control arm in the biomarker positive versus the biomarker negative population. (d) HRG+ patients appeared to derive benefit from seribantumab by comparing Kaplan–Meier PFS plots of the experimental arm with the control arm.

References

    1. Schoeberl, B. et al. Therapeutically targeting ErbB3: a key node in ligand-induced activation of the ErbB receptor-PI3K axis. Sci. Signal. 2, ra31 (2009). - PubMed
    1. Schoeberl, B. et al. An ErbB3 antibody, MM-121, is active in cancers with ligand-dependent activation. Cancer Res. 70, 2485–2494 (2010). - PMC - PubMed
    1. Hughes, J. P., Rees, S. S., Kalindjian, S. B. & Philpott, K. L. Principles of early drug discovery. Br. J. Pharmacol. 162, 1239–1249 (2011). - PMC - PubMed
    1. Chabner, B. A. & Roberts, T. G. Timeline: Chemotherapy and the war on cancer. Nat. Rev. Cancer 5, 65–72 (2005). - PubMed
    1. Hudis, C. A. Trastuzumab--mechanism of action and use in clinical practice. N. Engl. J. Med. 357, 39–51 (2007). - PubMed