. 2017 Jun 23:7:36-46.
doi: 10.1016/j.pacs.2017.06.002. eCollection 2017 Sep.

Temperature-dependent optoacoustic response and transient through zero Grüneisen parameter in optically contrasted media

Affiliations

Temperature-dependent optoacoustic response and transient through zero Grüneisen parameter in optically contrasted media

Elena Petrova et al. Photoacoustics. .

Abstract

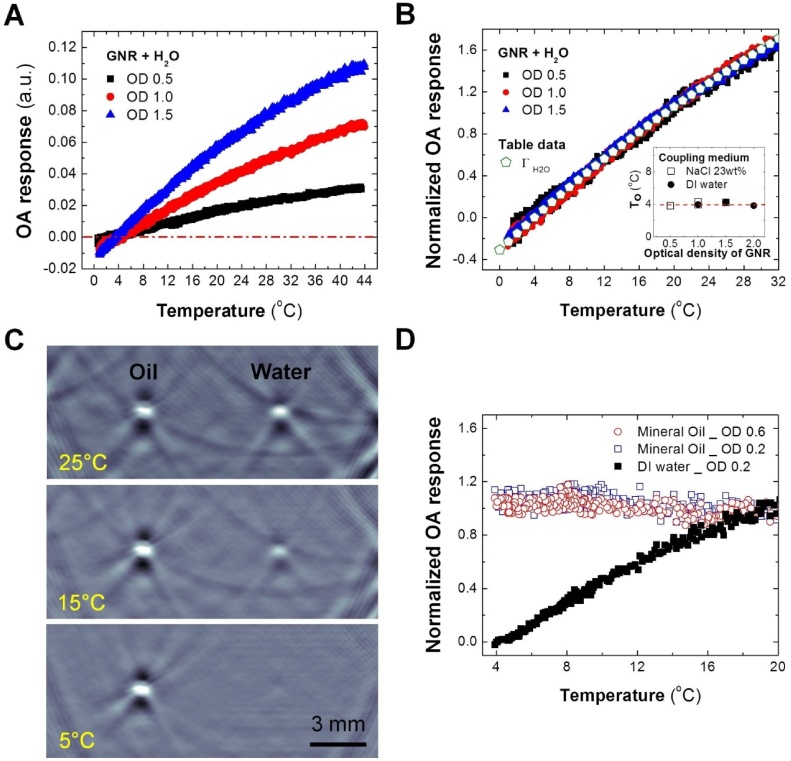
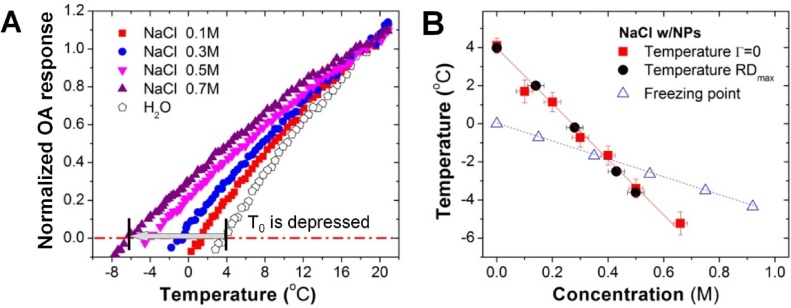
Non-invasive optoacoustic mapping of temperature in tissues with low blood content can be enabled by administering external contrast agents. Some important clinical applications of such approach include temperature mapping during thermal therapies in a prostate or a mammary gland. However, the technique would require a calibration that establishes functional relationship between the measured normalized optoacoustic response and local tissue temperature. In this work, we investigate how a key calibration parameter - the temperature of zero optoacoustic response (T0 ) - behaves in different environments simulating biological tissues augmented with either dissolved or particulate (nanoparticles) contrast agents. The observed behavior of T0 in ionic and molecular solutions suggests that in-vivo temperature mapping is feasible for contrast agents of this type, but requires knowledge of local concentrations. Oppositely, particulate contrast agents (plasmonic or carbon nanoparticles) demonstrated concentration-independent thermal behavior of optoacoustic response with T0 defined by the thermoelastic properties of the local environment.

Keywords: GNR, Gold nanorods; MRI, Magnetic resonance imaging; NIR, Near-infrared; NP, Nanoparticles; OA, Optoacoustic; Optical contrast agents; Optoacoustic imaging; Photoacoustic; ROI, Region of interest; SNR, Signal-to-noise ratio; SOS, Speed of sound; Temperature monitoring; ThOR, Thermal (temperature-dependent) optoacoustic response; USI, Ultrasound imaging.


Figures

Fig. 1
Fig. 1
A. Schematics of the experimental setup. Latched light bar illuminators, ultrasound probe, and multi-tube phantom frame with sample tubes oriented orthogonally to imaging plane, all are placed inside a thermostat filled with a coupling liquid. B. TEM images of GNRs before (suspension of GNRs in 10 mM CTAB) and after pegylation (PEG) and their normalized UV–Vis spectra.
Fig. 2
Fig. 2
Optoacoustic images of four tubes (cross-sectional views) filled by CuSO4*5H2O solutions with the following concentrations: 1–0.06 M; 2–0.24 M; 3–0.36 M; and 4–0.48 M. Acoustic coupling medium is NaCl 23 wt% solutions with freezing point of −21 °C. Directions of optical illumination and detection of optoacoustic waves coincide (reflection mode) and are shown by an open arrow (A). OA response was estimated for each sample in the selected ROI, marked by dashed circles (B-F). Image intensity of samples decreases for lower temperatures . At the point of zero OA response (maximum density) for a particular sample, the image of that sample disappeared in the background (as indicated by solid arrows). Change of OA image contrast corresponds to the change of the Grüneisen parameter. A linear grayscale palette was autoscaled for the first frame acquired at 20 °C and the limits were fixed for all the subsequent frames. Video is provided.
Fig. 3
Fig. 3
Optoacoustic phenomenon for positive and negative Grüneisen parameters (G). It depends on the thermal expansion coefficient (β), optical absorption coefficient (μa), and fluence (F), and can be observed during both expansion (positive β) and compression (negative β) of the optically absorbing medium. According to response of the medium to instant heating, a pressure wave will be generated in its positive or negative phase.
Fig. 4
Fig. 4
A. Temperature dependence of the normalized OA response for optically absorbing CuSO4*5H2O solutions and calculated normalized Grüneisen parameter (Γ) of pure water . Dash-dotted line shows the level of zero OA response. B. Temperatures of maximum density for the studied cupric sulfate samples, where OA response is equal to zero, as a function of concentration; measurements were performed using various acoustic coupling media; C. Relative density measured with a hydrometer as a function of temperature for 0.24 M solution of cupric sulfate (closed circles) and water (open circles); Data were fit with a parabolic function to obtain the temperatures of maximum relative density (RDmax) as indicated by the red arrows. D.T0 and RDmax and the freezing temperature measured for different concentrations of CuSO4. E. Temperature dependence of the normalized OA response for optically absorbing solutions of nickel sulfate. F. The temperature of maximum density measured by the OA imaging technique (T0) as a function of nickel sulfate concentration; data are shown for two different laser wavelengths utilized for OA excitation.
Fig. 5
Fig. 5
A. Temperature dependence of the OA response for pure water contrasted by GNR coated with PEG. Three concentrations of GNR presented with optical density (OD) at 800 nm: 0.5 cm−1, 1.0 cm−1, and 1.5 cm−1. B. The normalized OA response of GNR suspensions as compared to the calculated and normalized Grüneisen parameter (Γ) of pure water. The inlet shows the measured T0 as a function of GNR optical density. C. Optoacoustic images show cross sections of two tubes filled with liquids contrasted by carbon particles: left – mineral oil, right – pure water. Acoustic coupling was provided by water. D. Normalized (19 °C) OA response as a function of temperature for oil and water contrasted by carbon particles. Mineral oil results are depicted by open circles, pure water – solid squares.
Fig. 6
Fig. 6
A. Temperature dependence of the normalized OA response for non-absorbing NaCl solutions augmented by plasmonic nanoparticles (NPs) and DI-water contrasted with carbon NPs. B. The temperature of Γ = 0 for the sodium chloride as a function of concentration; the temperature of RDmax according to seawater data; and the freezing temperature for sodium chloride solutions .

References

    1. Chu K.F., Dupuy D.E. Thermal ablation of tumours: biological mechanisms and advances in therapy. Nat. Rev. Cancer. 2014;14:199–208. - PubMed
    1. Repasky E.A., Evans S.S., Dewhirst M.W. Temperature matters! and why it should matter to tumor immunologists. Cancer Immunol. Res. 2013;1(4):210–216. - PMC - PubMed
    1. Mohammed A., Miller S., Douglas-Moore J., Miller M. Cryotherapy and its applications in the management of urologic malignancies: a review of its use in prostate and renal cancers. Urol. Oncol. 2014;32(39):e19–e27. - PubMed
    1. Hsiao Y.-H., Kuo S.-J., Tsai H.-D., Chou M.-C., Yeh G.-P. Clinical application of high-intensity focused ultrasound in cancer therapy. J. Cancer. 2016;7:225–231. - PMC - PubMed
    1. Siva S., Ellis R.J., Ponsky L., The B.S., Mahadevan A., Muacevic A., Staehler M., Onishi H., Wesall P., Nomiya T., Lo S.S. Consensus statement from the international radiosurgery oncology consortium for kidney for primary renal cell carcinoma. Future Oncol. 2016;12:637–645. - PubMed