. 2015 Sep 3:1:15013.
doi: 10.1038/npjmgrav.2015.13. eCollection 2015.

Alterations in adaptive immunity persist during long-duration spaceflight

Affiliations

Alterations in adaptive immunity persist during long-duration spaceflight

Brian Crucian et al. NPJ Microgravity. .

Abstract

Background: It is currently unknown whether immune system alterations persist during long-duration spaceflight. In this study various adaptive immune parameters were assessed in astronauts at three intervals during 6-month spaceflight on board the International Space Station (ISS).

Aims: To assess phenotypic and functional immune system alterations in astronauts participating in 6-month orbital spaceflight.

Methods: Blood was collected before, during, and after flight from 23 astronauts participating in 6-month ISS expeditions. In-flight samples were returned to Earth within 48 h of collection for immediate analysis. Assays included peripheral leukocyte distribution, T-cell function, virus-specific immunity, and mitogen-stimulated cytokine production profiles.

Results: Redistribution of leukocyte subsets occurred during flight, including an elevated white blood cell (WBC) count and alterations in CD8+ T-cell maturation. A reduction in general T-cell function (both CD4+ and CD8+) persisted for the duration of the 6-month spaceflights, with differential responses between mitogens suggesting an activation threshold shift. The percentage of CD4+ T cells capable of producing IL-2 was depressed after landing. Significant reductions in mitogen-stimulated production of IFNγ, IL-10, IL-5, TNFα, and IL-6 persisted during spaceflight. Following lipopolysaccharide (LPS) stimulation, production of IL-10 was reduced, whereas IL-8 production was increased during flight.

Conclusions: The data indicated that immune alterations persist during long-duration spaceflight. This phenomenon, in the absence of appropriate countermeasures, has the potential to increase specific clinical risks for crewmembers during exploration-class deep space missions.


Conflict of interest statement

DP is a NASA Virologist and CS and BC are NASA Immunologists. All remaining authors possess positions (contractor scientist) at, or are funded by, NASA. The remaining authors declare no conflict of interest.

Figures

Figure 1
Figure 1
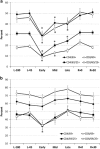
Absolute peripheral blood levels (×1000 cells/μl) for the indicated leukocyte, lymphocyte, and T-cell subpopulations before, during (early, mid-mission, and late) and following spaceflight. (a) Leukocyte subsets; (b) lymphocyte subsets; (c) T cell subsets; (d) cytotoxic CD8+ T cell subsets; (e) central memory CD8+ T cell subsets; (f) senescent T cell subsets; (g and h) constitutively activated T cell subsets; (i) viral peptide-specific T cell subsets. Data are presented as mean±s.e. Significance was evaluated via a Student’s Paired t-test, by comparing all other data points to L-180 baseline data. Significant differences (P⩽0.05) are indicated (*). Sample size for all data is 23 astronaut subjects, except for EBV- and CMV-specific T cells, where the assay is restricted to HLA-A2-positive subjects (n=8). CMV, cytomegalovirus; EBV, Epstein–Barr virus.
Figure 2
Figure 2
Intracellular cytokine analysis; mean percentage of T cells in samples collected before, during (early, mid-mission, and late) and after spaceflight that were capable of being stimulated to produce either IL-2 (CD4+) or IFNγ (CD8+) following mitogenic stimulation. Purified peripheral mononuclear cells were stimulated with PMA+ionomycin for 4 h; data are expressed as percentage of T cells that were positive. Data are presented as mean±s.e. Significance was evaluated via a Student’s paired t-test by comparing all other data points to L-180 baseline data. Significant differences (P⩽0.05) are indicated (*). Sample size for all data is 23 ISS astronaut subjects.
Figure 3
Figure 3
T-cell function (early blastogenesis) data: expression of either CD69 or CD69/CD25 following 24-h culture in the presence of (a) staphylococcal enterotoxin (a and b); or (b) antibodies to CD3 and CD28. Data are presented as mean±standard error. Significance was evaluated via a Student’s paired t-test by comparing all other data points to L-180 baseline data. Significant differences (P⩽0.05) are indicated (*). Sample size for all data is 23 ISS astronaut subjects. ISS, International Space Station.
Figure 4
Figure 4
Quantification of virus-specific T-cell function. The frequency of CD69+/IFNγ+ positive (functional) CD8+ T cells following culture in the presence of A*0201-restricted viral peptides was evaluated by flow cytometry. The absolute and functional numbers of viral peptide-specific T cells were used to derive a functional percentage for (a) EBV-specific and (b) CMV-specific CD8+ T cells during spaceflight. Significance was evaluated via a Student’s paired t-test by comparing all other data points to L-180 baseline data. Significant differences (P⩽0.05) are indicated (*). This assay is restricted to HLA-A2-positive subjects (n=8). CMV, cytomegalovirus; EBV, Epstein–Barr virus.
Figure 5
Figure 5
Mean secreted cytokine levels following mitogenic stimulation. For secreted cytokine production, the mitogen was (a) antibodies to both CD3 and CD28, (b) PMA+ionomycin or (c) LPS. Cytokine concentration data are expressed mean concentration in pg/ml±s.e.m. The lone exception is IFNγ, for which data is presented as mean fluorescence intensity (MFI), which corresponds to concentration. Significance was evaluated via a Student’s paired t-test by comparing all other data points to L-180 baseline data. Significant differences (P⩽0.05) are indicated (*). Sample size for all data is 23 ISS astronaut subjects. For IL-4 (a), late time point only, one outlier value removed prior to statistical analysis. ISS, International Space Station; LPS, lipopolysaccharide.
Figure 5
Figure 5
Mean secreted cytokine levels following mitogenic stimulation. For secreted cytokine production, the mitogen was (a) antibodies to both CD3 and CD28, (b) PMA+ionomycin or (c) LPS. Cytokine concentration data are expressed mean concentration in pg/ml±s.e.m. The lone exception is IFNγ, for which data is presented as mean fluorescence intensity (MFI), which corresponds to concentration. Significance was evaluated via a Student’s paired t-test by comparing all other data points to L-180 baseline data. Significant differences (P⩽0.05) are indicated (*). Sample size for all data is 23 ISS astronaut subjects. For IL-4 (a), late time point only, one outlier value removed prior to statistical analysis. ISS, International Space Station; LPS, lipopolysaccharide.

References

    1. Chapes SK , Morrison DR , Guikema JA , Lewis ML , Spooner BS . Production and action of cytokines in space. Adv Space Res 1994; 14: 5–9. - PubMed
    1. Crucian BE , Stowe RP , Pierson DL , Sams CF . Immune system dysregulation following short- vs long-duration spaceflight. Aviat Space Environ Med 2008; 79: 835–843. - PubMed
    1. Sonnenfeld G , Miller ES . The role of cytokines in immune changes induced by spaceflight. J Leukoc Biol 1993; 54: 253–258. - PubMed
    1. Sonnenfeld G . Effect of space flight on cytokine production. Acta Astronaut 1994; 33: 143–147. - PubMed
    1. Morukov VB , Rykova MP , Antropova EN , Berendeeva TA , Ponomarev SA , Larina IM . Indicators of innate and adaptive immunity of cosmonauts after long-term space flight to international space station. Fiziol Cheloveka 2010; 36: 19–30. - PubMed