. 2017 Jul 19;547(7663):311-317.
doi: 10.1038/nature22973.

The whole-genome landscape of medulloblastoma subtypes

Paul A Northcott  1   2 Ivo Buchhalter  3   4   5 A Sorana Morrissy  6 Volker Hovestadt  7 Joachim Weischenfeldt  8 Tobias Ehrenberger  9 Susanne Gröbner  1   10 Maia Segura-Wang  11 Thomas Zichner  11 Vasilisa A Rudneva  11   2 Hans-Jörg Warnatz  12 Nikos Sidiropoulos  8 Aaron H Phillips  13 Steven Schumacher  14 Kortine Kleinheinz  3 Sebastian M Waszak  11 Serap Erkek  1   11 David T W Jones  1   10 Barbara C Worst  1   10 Marcel Kool  1   10 Marc Zapatka  7 Natalie Jäger  3 Lukas Chavez  1   10 Barbara Hutter  4 Matthias Bieg  3   15 Nagarajan Paramasivam  3   16 Michael Heinold  3   5 Zuguang Gu  3   15 Naveed Ishaque  3   15 Christina Jäger-Schmidt  3 Charles D Imbusch  4 Alke Jugold  3 Daniel Hübschmann  3   5   17 Thomas Risch  12 Vyacheslav Amstislavskiy  12 Francisco German Rodriguez Gonzalez  8 Ursula D Weber  7 Stephan Wolf  18 Giles W Robinson  19 Xin Zhou  20 Gang Wu  20 David Finkelstein  20 Yanling Liu  20 Florence M G Cavalli  6 Betty Luu  6 Vijay Ramaswamy  6 Xiaochong Wu  6 Jan Koster  21 Marina Ryzhova  22 Yoon-Jae Cho  23 Scott L Pomeroy  24 Christel Herold-Mende  25 Martin Schuhmann  26 Martin Ebinger  27 Linda M Liau  28 Jaume Mora  29 Roger E McLendon  30 Nada Jabado  31 Toshihiro Kumabe  32 Eric Chuah  33 Yussanne Ma  33 Richard A Moore  33 Andrew J Mungall  33 Karen L Mungall  33 Nina Thiessen  33 Kane Tse  33 Tina Wong  33 Steven J M Jones  33 Olaf Witt  17 Till Milde  17 Andreas Von Deimling  34 David Capper  34 Andrey Korshunov  34 Marie-Laure Yaspo  12 Richard Kriwacki  13 Amar Gajjar  19 Jinghui Zhang  20 Rameen Beroukhim  14 Ernest Fraenkel  9 Jan O Korbel  11 Benedikt Brors  3   4   10 Matthias Schlesner  3 Roland Eils  3   5   10 Marco A Marra  33 Stefan M Pfister  1   10   17 Michael D Taylor  6   35 Peter Lichter  7   10
Affiliations

The whole-genome landscape of medulloblastoma subtypes

Paul A Northcott et al. Nature. .

Abstract

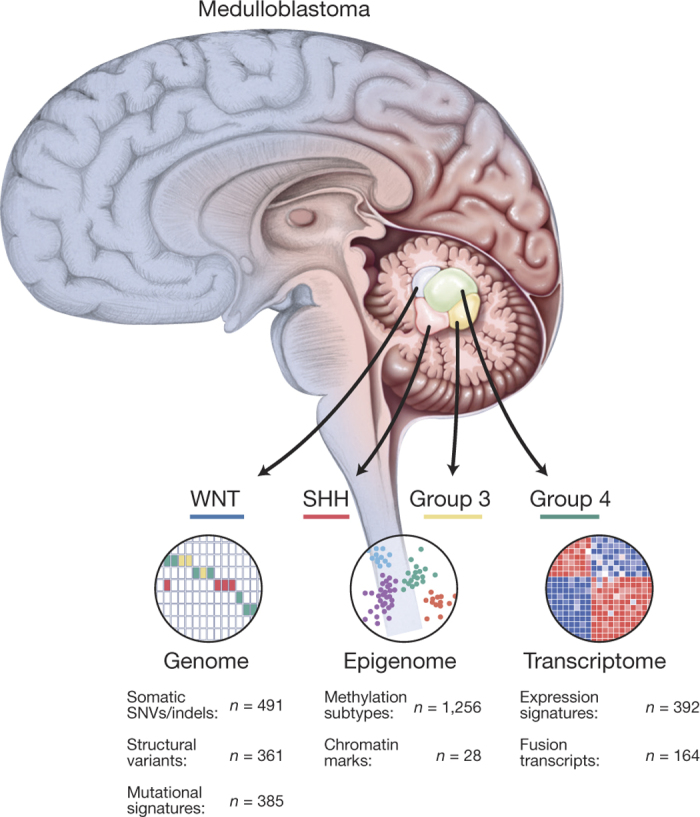
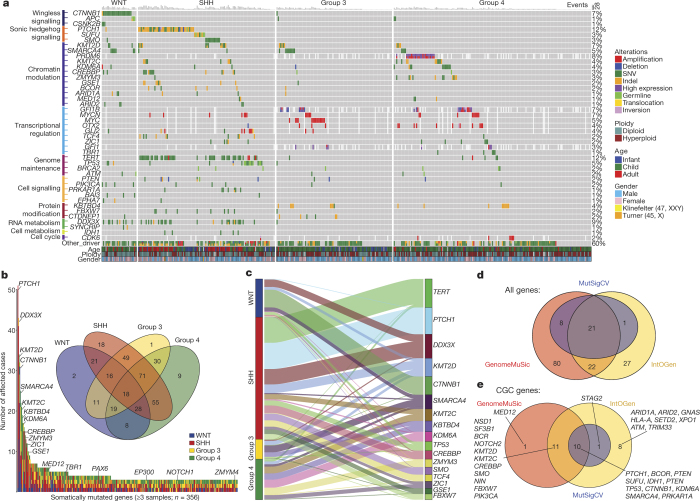
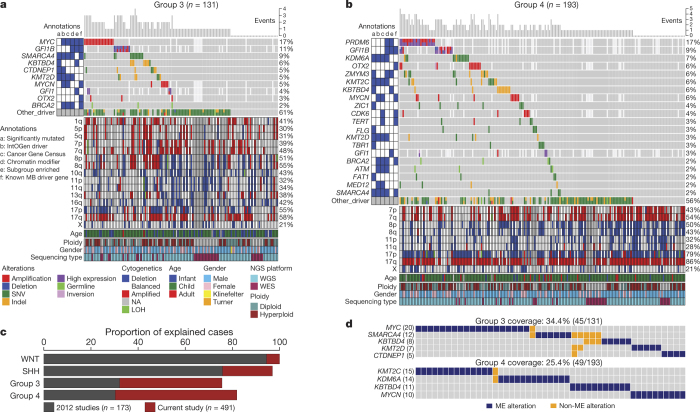
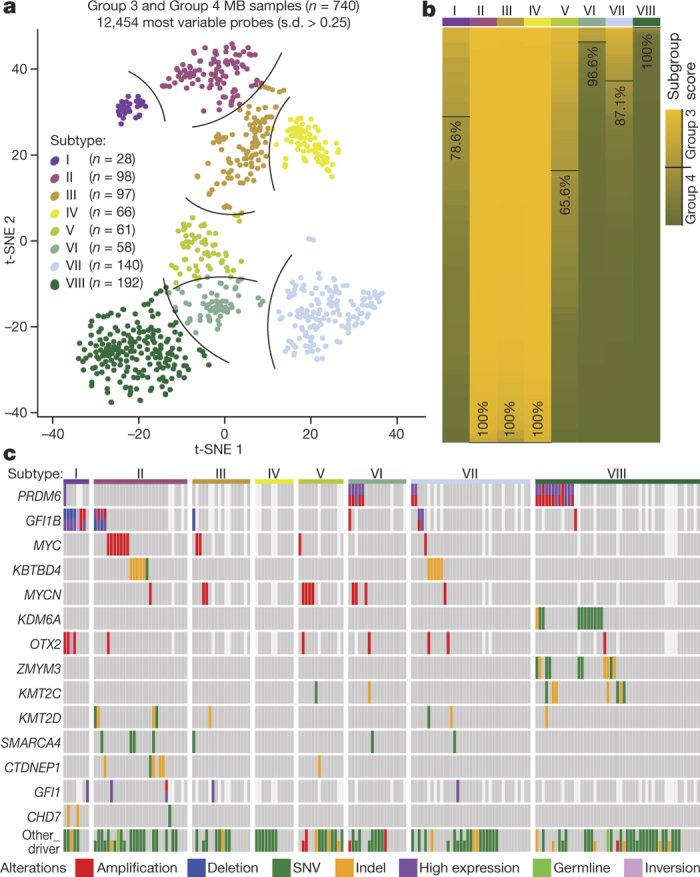
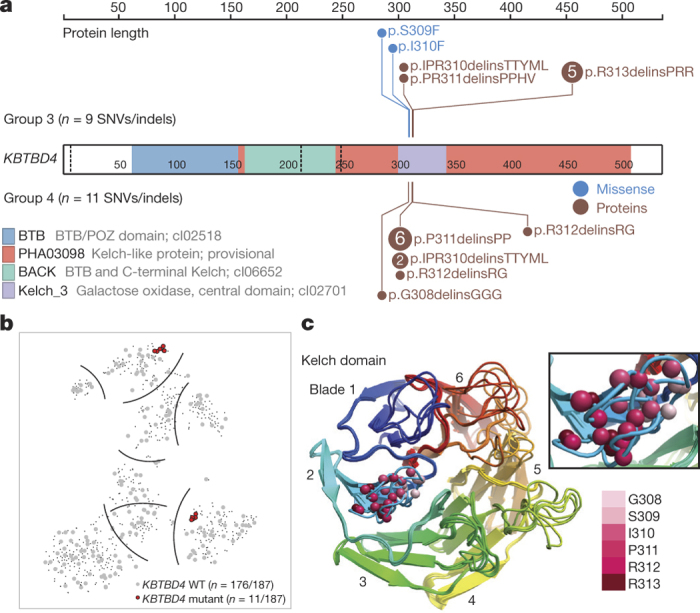
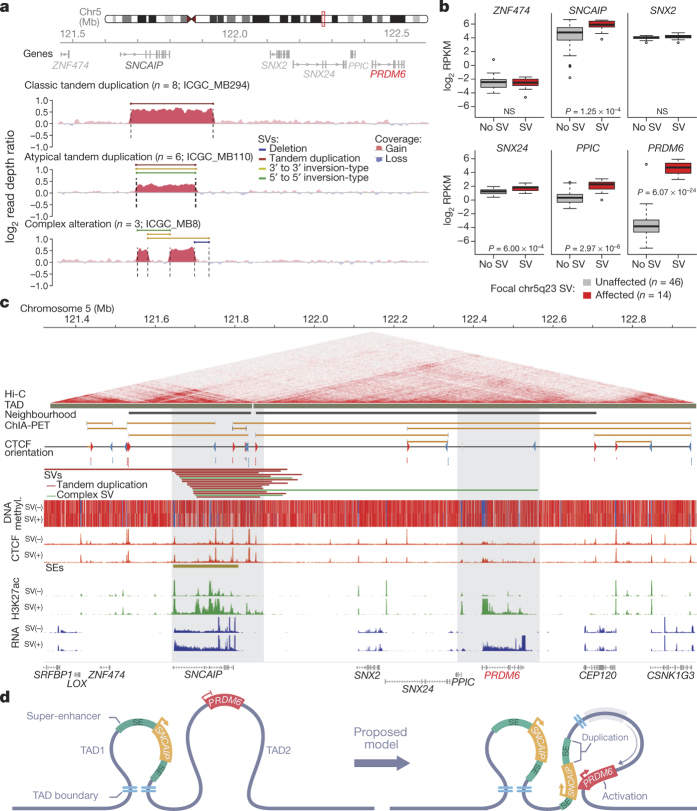
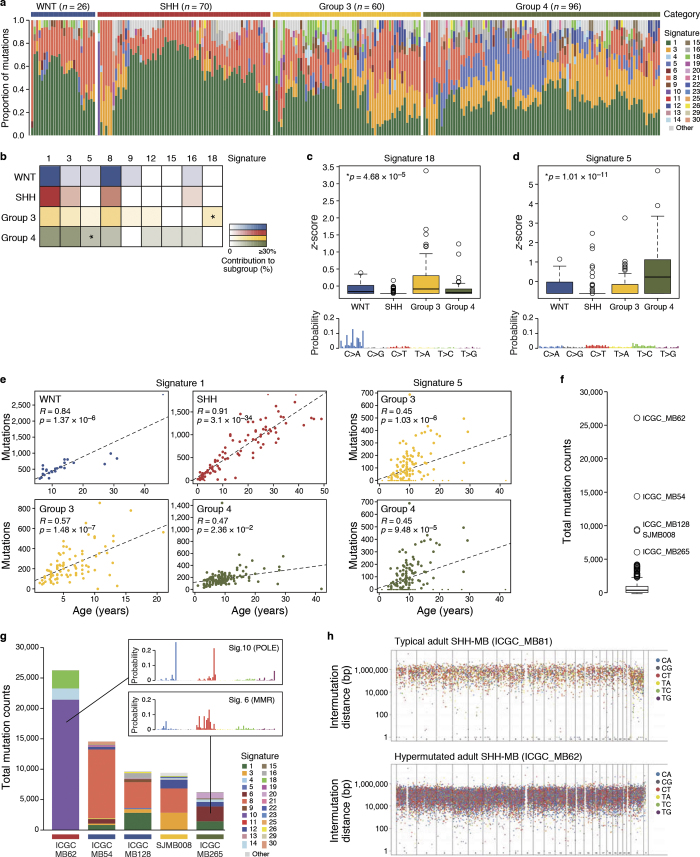
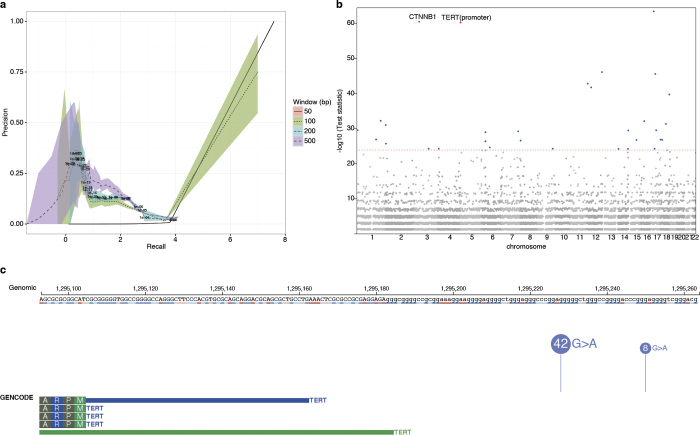
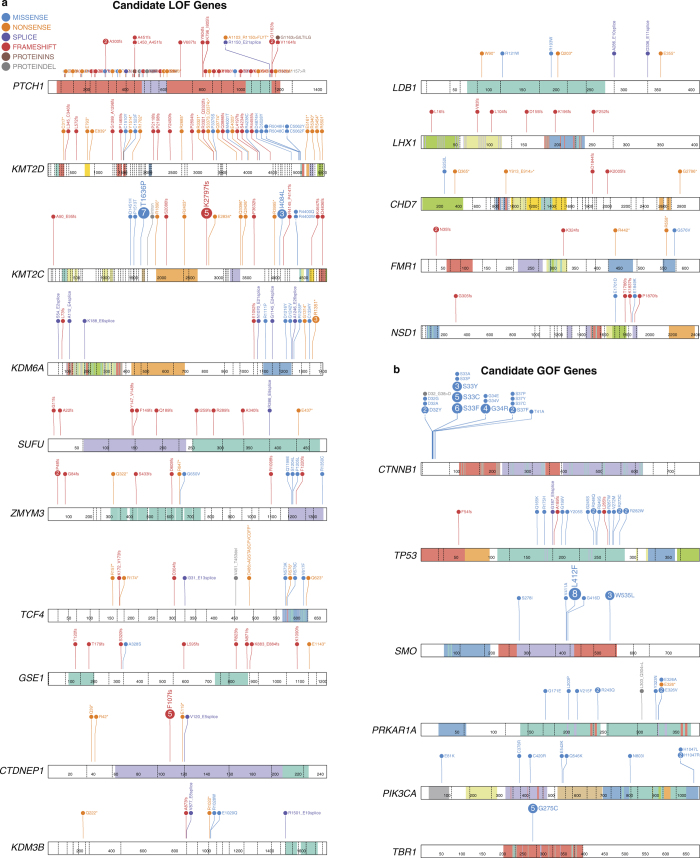
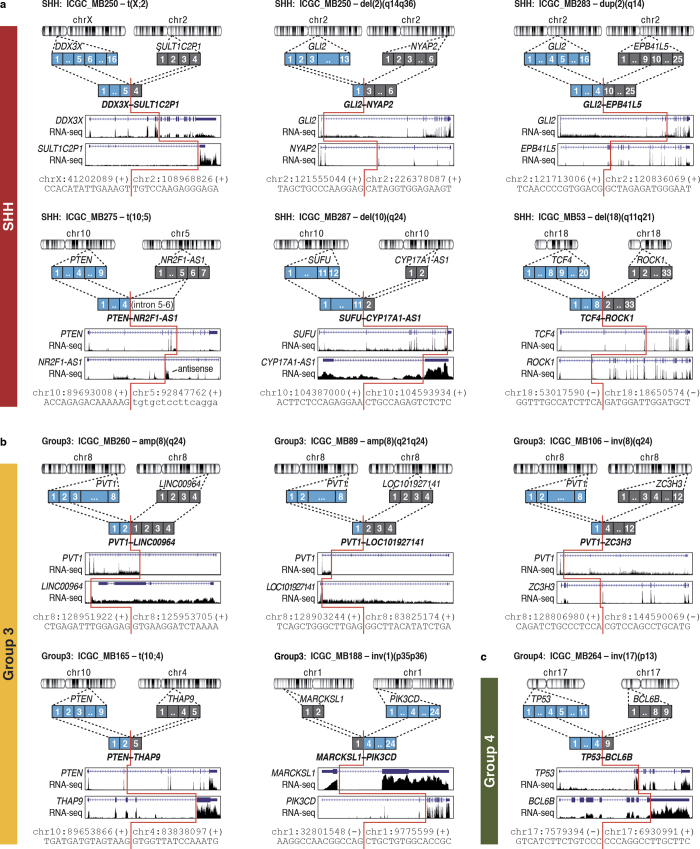
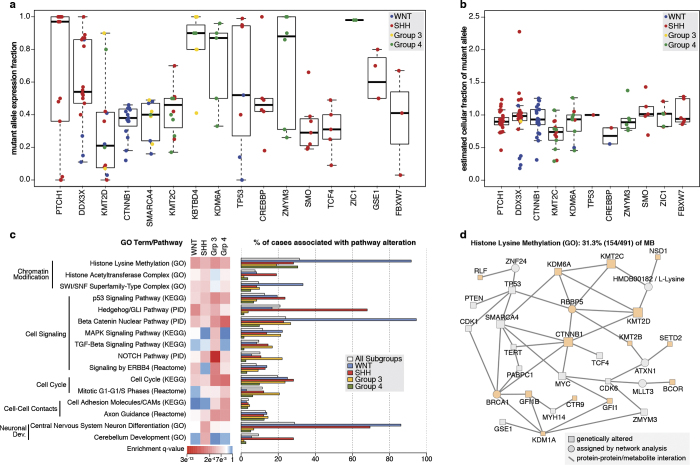
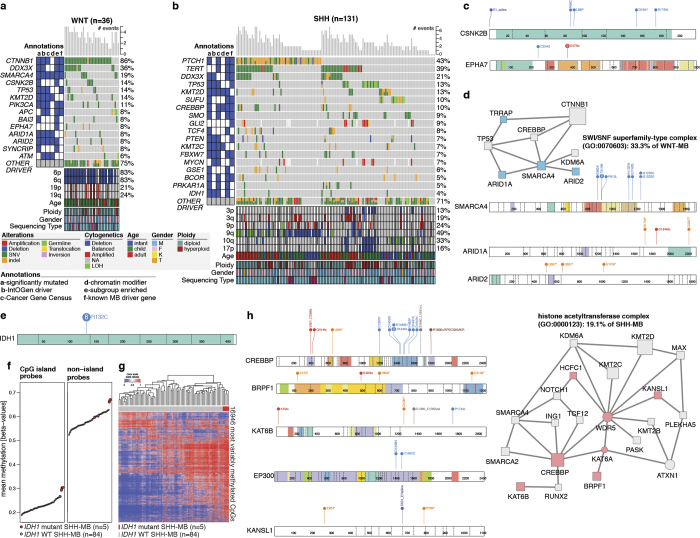
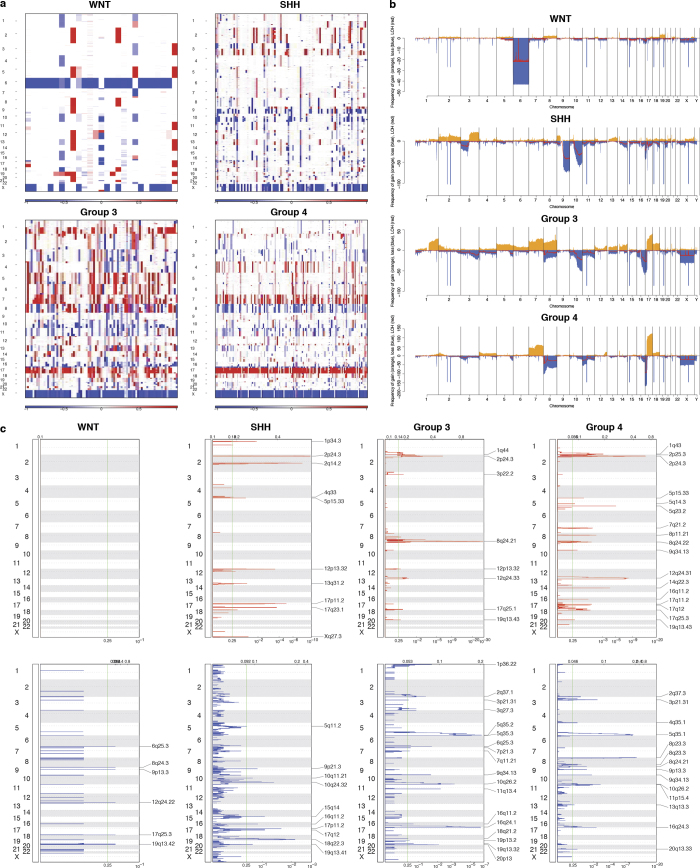
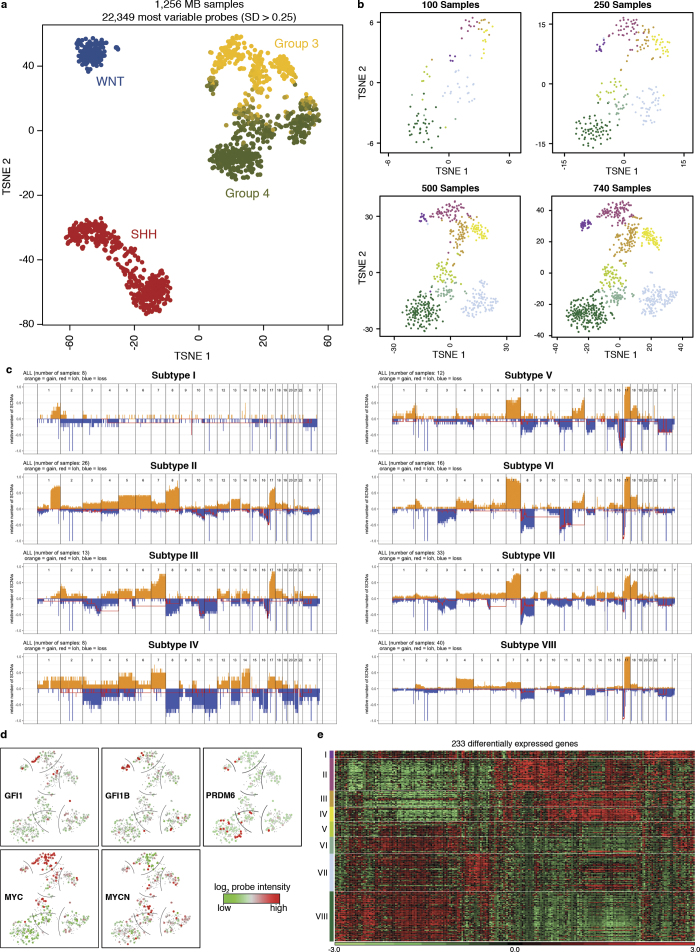
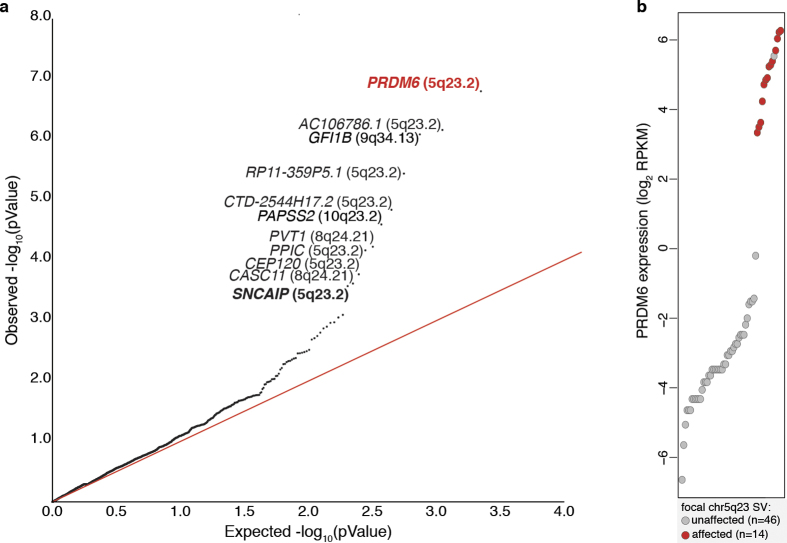
Current therapies for medulloblastoma, a highly malignant childhood brain tumour, impose debilitating effects on the developing child, and highlight the need for molecularly targeted treatments with reduced toxicity. Previous studies have been unable to identify the full spectrum of driver genes and molecular processes that operate in medulloblastoma subgroups. Here we analyse the somatic landscape across 491 sequenced medulloblastoma samples and the molecular heterogeneity among 1,256 epigenetically analysed cases, and identify subgroup-specific driver alterations that include previously undiscovered actionable targets. Driver mutations were confidently assigned to most patients belonging to Group 3 and Group 4 medulloblastoma subgroups, greatly enhancing previous knowledge. New molecular subtypes were differentially enriched for specific driver events, including hotspot in-frame insertions that target KBTBD4 and 'enhancer hijacking' events that activate PRDM6. Thus, the application of integrative genomics to an extensive cohort of clinical samples derived from a single childhood cancer entity revealed a series of cancer genes and biologically relevant subtype diversity that represent attractive therapeutic targets for the treatment of patients with medulloblastoma.


Conflict of interest statement

The authors declare no competing financial interests.

Figures

Figure 1
Figure 1. Summary of MB genomic datasets.
Graphical summary of genomic, epigenomic, and transcriptomic MB datasets analysed in the study. PowerPoint slide
Figure 2
Figure 2. Driver genes and pathways altered in MB.
a, Oncoprint summarizing recurrently altered genes according to MB subgroup (n = 390; WGS series only). b, Top, Venn diagram summarizing the subgroup overlap of recurrently mutated genes (≥3 affected cases). Bottom, incidence plot of recurrently mutated genes (≥3 affected cases) detected in the series (n = 356 genes; n = 491 samples). c, Graphical summary of the most frequently mutated genes (≥10 affected cases) and their subgroup distribution. d, Venn diagram summarizing the significantly mutated gene lists output from multiple significance algorithms. e, Results from d restricted to Cancer Gene Census (CGC) genes. PowerPoint slide
Figure 3
Figure 3. Mutational landscape of Group 3 and Group 4.
a, b, Oncoprint summaries of recurrently mutated genes, structural variants, overexpression and somatic copy number variants (CNVs) in Group 3 (n = 131) and Group 4 (n = 193) MB. LOH, loss of heterozygosity; NA, not available. c, Bar graph depicting the proportion of cases per subgroup for which at least one driver event could be assigned. The proportion of cases explained in previous NGS studies versus the current study is shown. d, Mutually exclusive (ME) mutations in Group 3 and Group 4. PowerPoint slide
Figure 4
Figure 4. Molecular features of methylation subtypes.
a, t-SNE plot depicting new methylation subtypes detected in Group 3 and Group 4 (n = 740 samples). b, Methylation subtypes proportionally summarized according to consensus Group 3 and Group 4 subgroup definitions. c, Oncoprint summaries of driver genetic events according to methylation subtype. PowerPoint slide
Figure 5
Figure 5. Recurrent hotspot indels target KBTBD4.
a, Gene-level summary of somatic SNVs and indels targeting KBTBD4 in MB. Mutations are independently summarized according to subgroup. b, Distribution of wild-type (WT) and mutant KBTBD4 cases in methylation subtypes. c, Homology model of the KBTBD4 Kelch domain, highlighting the positions affected by hotspot insertions (shown as spheres). PowerPoint slide
Figure 6
Figure 6. Enhancer hijacking activates PRDM6 in Group 4 MB.
a, Summary of structural variants (SVs) targeting the SNCAIP locus in Group 4. b, Group 4 MB expression box plots of genes mapping proximal to SNCAIP-associated structural variants. NS, not significant. c, Summary of annotated chromatin interactions (Hi-C), TADs (brown bars), CTCF chromatin interaction analysis by paired-end tag sequencing (ChIA-PET) and CTCF binding orientation (red and blue arrowheads), as well as SNCAIP-associated structural variants, CTCF ChIP–seq peaks, Group 4-specific super-enhancers (SEs), H3K27ac ChIP–seq peaks, and RNA-seq data derived from a subset of Group 4 MBs, stratified according to underlying SNCAIP structural variant status. d, Proposed model depicting inferred molecular basis of SNCAIP/PRDM6-associated enhancer hijacking. PowerPoint slide
Extended Data Figure 1
Extended Data Figure 1. Mutational signatures in MB.
a, b, Exposure plot (a) and heatmap (b) summarizing mutation signatures contributing ≥5% of the overall mutation burden per sample are depicted. Asterisks in b indicate subgroup-enriched signatures. c, d, Box plots showing the subgroup specificity of signatures 18 (c) and 5 (d). e, Correlation of signatures 1 and 5 with patient age. f, Summary of total somatic mutation counts observed in the series. g, Bar plot summarizing distribution of mutation signatures in MBs with outlier mutation counts. h, Rainfall plots depicting somatic mutation burden in typical (top) and hypermutated (bottom) SHH MBs.
Extended Data Figure 2
Extended Data Figure 2. Genome-wide summary of somatic SNVs.
a, Precision-recall curves for different binomial P value cut-offs. Minimal and maximal precision values are shown in colour, mean precision is shown as dotted line. P value cut-offs for 200 bp window sizes are indicated. b, Manhattan plot showing the −log10 test statistic of 200 bp genomic windows plotted against their respective chromosomal positions. Red line indicates the genome-wide significance threshold (P = 10−25). High-confidence regions are shown in red; regions representing probable false positives are shown in blue. c, Summary of TERT promoter mutations observed in the series.
Extended Data Figure 3
Extended Data Figure 3. Prevalent candidate driver mutations observed in MB.
a, b, Gene-level summaries of SNVs/indels inferred to predominantly result in loss-of-function (LOF) (a) or gain-of-function (GOF) (b) of known and putative MB driver genes.
Extended Data Figure 4
Extended Data Figure 4. Summary of fusion gene transcripts detected by RNA-seq.
ac, Schematic summaries of high-confidence fusion transcripts targeting known or putative MB driver genes, organized according to MB subgroup.
Extended Data Figure 5
Extended Data Figure 5. Candidate driver genes and pathways in MB subgroups.
a, b, Box plots summarizing allelic expression fractions (a) and estimated clonality (b) inferred for prominent MB driver gene mutations. c, GO and pathway summary of recurrently mutated genes in MB. GO and pathway categories are grouped according to functional theme and the proportion of cases affected by individual pathway alterations are plotted per subgroup and across the series. d, Network summary of recurrently mutated genes involved in histone lysine methylation (GO accession 0034968).
Extended Data Figure 6
Extended Data Figure 6. Mutational landscape of WNT and SHH MB.
a, b, Oncoprint summaries of recurrently mutated genes and cytogenetic alterations in WNT (a; n = 36 samples) and SHH (b; n = 131 samples). c, Gene-level summary of WNT subgroup-enriched CSNK2B and EPHA7 mutations. d, Summary of SWI/SNF superfamily-type complex (GO accession 0070603) mutations observed in patients with WNT MB. e, Gene-level summary of somatic IDH1 R132C mutations detected in MB. f, Quantification of methylcytosine beta-values detected in IDH1-mutant versus wild-type SHH MBs. g, Unsupervised hierarchical clustering of SHH MB methylation data, confirming CIMP in IDH1-mutated SHH MBs. h, Summary of histone acetyltransferase complex (GO accession 0000123) mutations observed in patients with SHH MB.
Extended Data Figure 7
Extended Data Figure 7. Somatic copy-number alterations in MB.
a, Copy-number heat maps for individual MB subgroups derived from WGS series. b, Genome-wide copy-number summary plots for the MB dataset shown in a. c, GISTIC plots summarizing significant CNVs according to MB subgroup.
Extended Data Figure 8
Extended Data Figure 8. t-SNE analysis of Group 3 and Group 4 methylation data.
a, t-SNE plot of DNA methylation array data for 1,256 analysed MBs. b, t-SNE analysis of iteratively down-sampled Group 3 and Group 4 methylation data. c, Genome-wide copy-number summary plots for Group 3/Group 4 methylation subtypes. d, t-SNE plots showing the relative, normalized expression intensities of GFI1, GFI1B, MYC, MYCN and PRDM6 in methylation subtypes (n = 219). e, Expression heat map showing transcriptional diversity among new MB subtypes (n = 248).
Extended Data Figure 9
Extended Data Figure 9. SNCAIP-associated enhancer hijacking in Group 4 MB.
a, Quantile–quantile plot depicting the statistical inference of CESAM applied to systematically identify loci targeted by enhancer hijacking in Group 3 and Group 4 (n = 164) MB. b, Ascending PRDM6 expression in Group 4 MB annotated according to SNCAIP structural variant status.

References

    1. Kandoth C, et al. Mutational landscape and significance across 12 major cancer types. Nature. 2013;502:333–339. - PMC - PubMed
    1. Tamborero D, et al. Comprehensive identification of mutational cancer driver genes across 12 tumor types. Sci. Rep. 2013;3:2650. - PMC - PubMed
    1. Jones DT, et al. Recurrent somatic alterations of FGFR1 and NTRK2 in pilocytic astrocytoma. Nat. Genet. 2013;45:927–932. - PMC - PubMed
    1. Lee RS, et al. A remarkably simple genome underlies highly malignant pediatric rhabdoid cancers. J. Clin. Invest. 2012;122:2983–2988. - PMC - PubMed
    1. Jones DT, et al. Dissecting the genomic complexity underlying medulloblastoma. Nature. 2012;488:100–105. - PMC - PubMed

Publication types