

doi: 10.1038/nature22998.
Ribosomes are optimized for autocatalytic production
Affiliations
- PMID: 28726822
- PMCID: PMC7239375
- DOI: 10.1038/nature22998
Item in Clipboard
Ribosomes are optimized for autocatalytic production
Nature.
.
Abstract
Many fine-scale features of ribosomes have been explained in terms of function, revealing a molecular machine that is optimized for error-correction, speed and control. Here we demonstrate mathematically that many less well understood, larger-scale features of ribosomes-such as why a few ribosomal RNA molecules dominate the mass and why the ribosomal protein content is divided into 55-80 small, similarly sized segments-speed up their autocatalytic production.
Conflict of interest statement
The authors declare no competing financial interests.
Figures
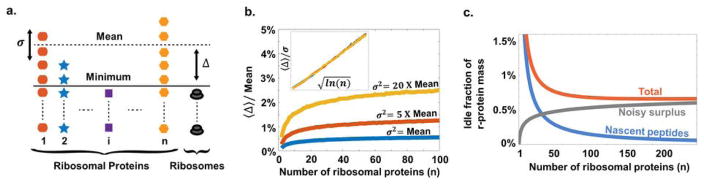
a. Cartoon of how stochastic gene expression will create temporary shortages of some r-proteins and surplus pools of others. The number of complete ribosomes assembled is then limited by the ribosomal protein in lowest abundance, and the average value of the difference between the minimum and the mean, 〈Δ〉, is the mean number of unmatched r-proteins. b. The relative mean free r-protein pool (from panel A) increases very slowly with the number of ribosomal proteins, n. For illustrative purposes we used negative binomial distributions with mean μ and different variances σ2 (SI), since this distribution has been observed and predicted in many studies of stochastic gene expression. The inset shows a curve collapse for
. Similar results were obtained for more complete kinetic models. c. The fraction of the r-protein mass in the form of nascent peptides or free pools due to noisy expression (assuming Poisson noise for simplicity, but with similar results for many other noise models). Technically there is an optimal n but the curves around and above the optimum are exceedingly shallow meaning that there is no practical upper limit.
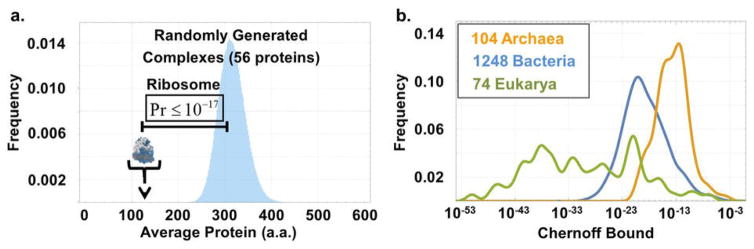
a. Distribution of the average protein length in 106 random samples of 56 proteins taken from E. coli’s genome, and the mark for the mean length of a protein in the bacterial ribosome. The probability to generate an average protein length as small as that seen in the ribosome is vanishingly small. b. The Chernoff upper bound (SI) on the probability that the average length of r-proteins could have arisen at random, i.e., with no size selection, is computed for 1424 different organisms. The value for E. coli is 10−17, but vanishingly small probabilities are attributed to all organisms we have examined.
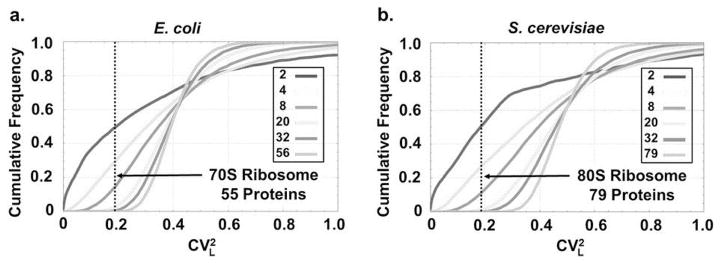
Cumulative frequency of
for randomly generated protein complexes composed of varying numbers of proteins (see SI for details). Only complexes in which the average protein length is identical ( ± 5 amino acids) to that seen in the ribosomes of E. coli (left) and S. cerevisiae (right) entered the statistics. As the number of proteins in a complex gradually increases from n = 2 to the number of proteins in the ribosome— n = 55 in E. coli (protein S1 was excluded see main text) and n = 79 in S. cerevisiae—the occurrence of coefficients of variation as low as those seen for the set of r-proteins becomes extremely rare.
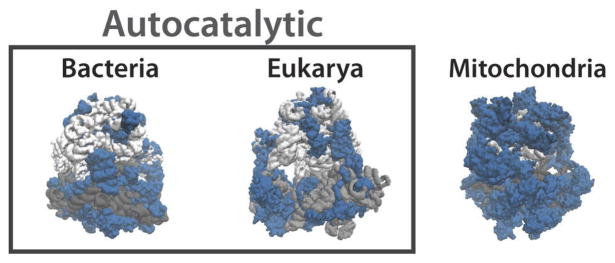
Bacterial ribosomes contain about 55 r-proteins (blue) that average ~130 amino acids and make up 30–35% of the ribosome mass. Eukaryotic ribosomes contain about 80 r-proteins that average ~165 amino acids and make up about 45% of the ribosome mass. In both these cases ribosomes catalyse their own production. In contrast, in mitochondrial ribosomes which do not produce themselves rRNA (gray) is scarcer, and r-proteins are significantly larger and could make up as much as 80% of the ribosome mass.
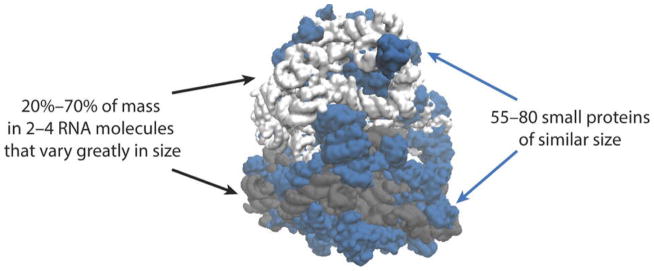
Many unusual features of ribosomes are not well understood: With the exception of mitochondrial ribosomes, most of the mass is in a few RNA molecules that are very large on average but vary greatly in size (gray), whereas the proteins (blue) are unusually small, numerous and similar to each other in size.
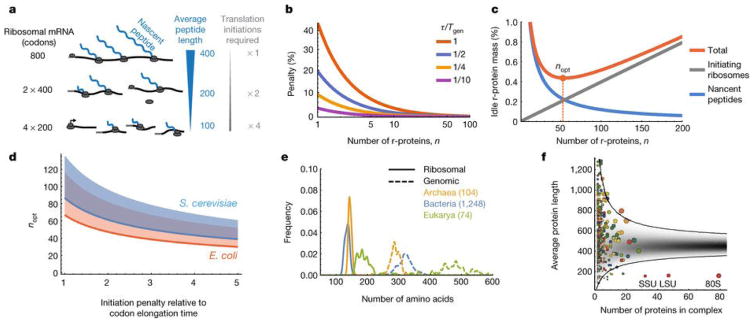
A. Nascent r-protein peptides cannot participate in translation before their own translation is completed. Sub-dividing the protein mass into more and smaller pieces reduces the inactive fraction, but also increases the number of translation initiations required. B. The penalty, due to finite number of r-proteins, that is incurred on the minimal time fraction (from Eq. 1) that ribosomes must spend on their own production. Penalty is plotted as a function of n for different values of τ/Tgen (1 Red, 1/2 Blue, 1/4 Yellow, 1/10 Magenta), and is calculated relative to τln(2)/Tgen which is the asymptotic value achieved at high n, possibly reducing the penalty as much as 1/ln(2)≃1.44 fold. C. The fraction of dedicated r-protein mass that is elongationally idle, due to nascent r-protein peptides and ribosomes occupied in initiation, is minimized for an optimal number of r-proteins, nopt. D. The nopt from Eq. (2) and panel C for E. coli (orange) and S. cerevisiae (blue), in the range of the expected ratios between initiation and elongation rates (see main text). The shaded area above the lines would be accessible if ribosome could produce slightly less of the larger sub-unit, which only enters at the last step of initiation (SI). E. Across organisms, average lengths of proteins in ribosomes are 2–3 times smaller than in genomes [22]. F. The average length (amino acids) of proteins in S. cerevisiae multi-protein complexes vs. the number of proteins in the complex. Each colored circle corresponds to a known complex [23] (area is proportional to total number of amino acids). Gray represents the predicted probability density when drawing random genes from the genome. Most of the 403 complexes fall within the expected 99 % confidence interval, except the ribosome (80S, including both subunits SSU and LSU independently), that falls ~7 standard deviations below.
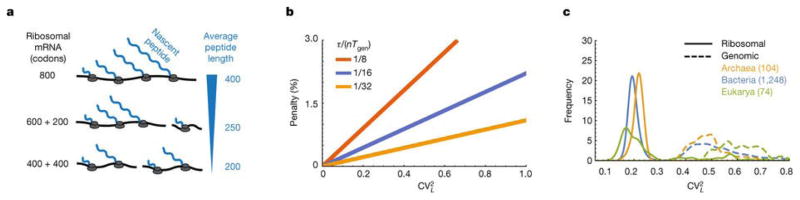
A. Dividing up a long r-protein (e.g. 8oo codons) into two unequal parts (600 and 200 codons) does not reduce the average length of the nascent peptides as much as dividing it into equal parts (400 and 400 codons). B. The minimal time fraction that ribosomes must spend on their own production from Eq. 3, normalized by n(2τ/nTgen −1) from Eq. 1 and plotted as a function of
for different values of τ/nTgen (1/8 red, 1/16 blue, 1/32 yellow) to show the percentage penalty that results from CVL > 0. C. Relative frequencies of the normalized variance (
from Eq. 3) of protein length distributions in ribosomes and genomes, showing substantially lower CV s for the former.
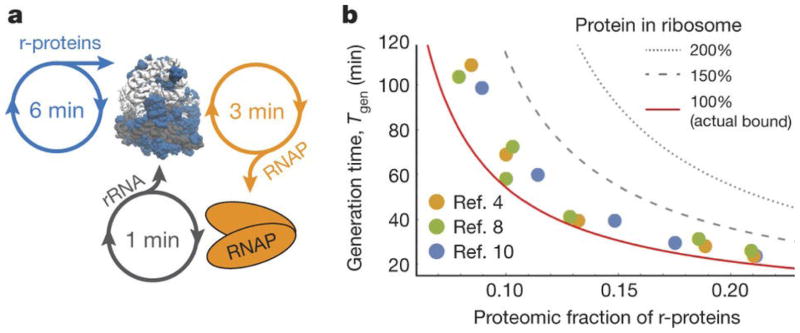
A. Ribosome auto-production occupies ribosome time to make r-proteins and RNA polymerases for rRNA production. An RNA polymerase can be translated in half the time compared to a set of r-proteins, and in fast-growing E. coli, each polymerase can produce 20 sets of rRNAs per generation. B. Generation time vs. proteomic fraction of E. coli r-proteins. Circles are published experimental data: yellow [4], green [8], and blue[10]. Because most proteins in E. coli are stable, the proteomic fraction of r-proteins roughly equals the fraction of time, ϕ, ribosomes spend translating r-proteins. The solid line is the bound on generation time set by ribosome production, Tgen ≥ τln(2)/ϕ (rearranged Eq. 1 in high n limit). For the same ribosome speed, cells with hypothetical ribosomes replacing rRNA mass for r-protein (e.g., 150% or 200% the actual amount) could not divide as quickly.
Comment in
-
Ribosomal Architecture: Constraints Imposed by the Need for Self-Production.Curr Biol. 2017 Aug 21;27(16):R798-R800. doi: 10.1016/j.cub.2017.06.080. Curr Biol. 2017. PMID: 28829964
References
-
- Rodnina MV, Wintermeyer W, Green R. Ribosomes Structure, Function, and Dynamics. Springer Science and Business Media; 2011.
Publication types
MeSH terms
Substances
Grants and funding
LinkOut - more resources
Full Text Sources
Other Literature Sources
