. 2017 Aug 2;19(30):20101-20109.
doi: 10.1039/c7cp02875j.

A fluorescence-electrochemical study of carbon nanodots (CNDs) in bio- and photoelectronic applications and energy gap investigation

Affiliations

A fluorescence-electrochemical study of carbon nanodots (CNDs) in bio- and photoelectronic applications and energy gap investigation

Zheng Zeng et al. Phys Chem Chem Phys. .

Abstract

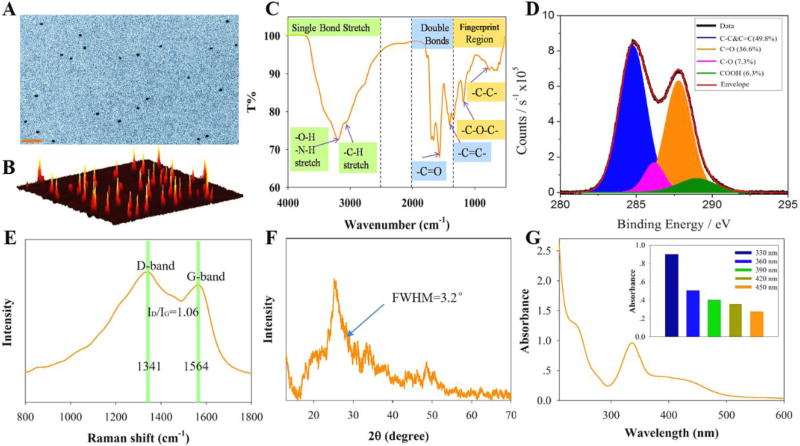
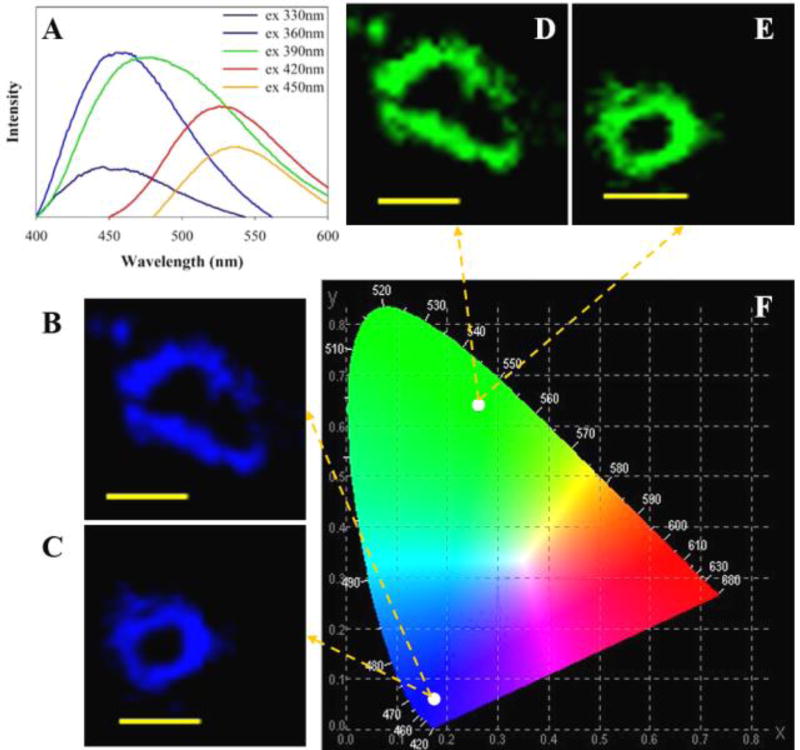
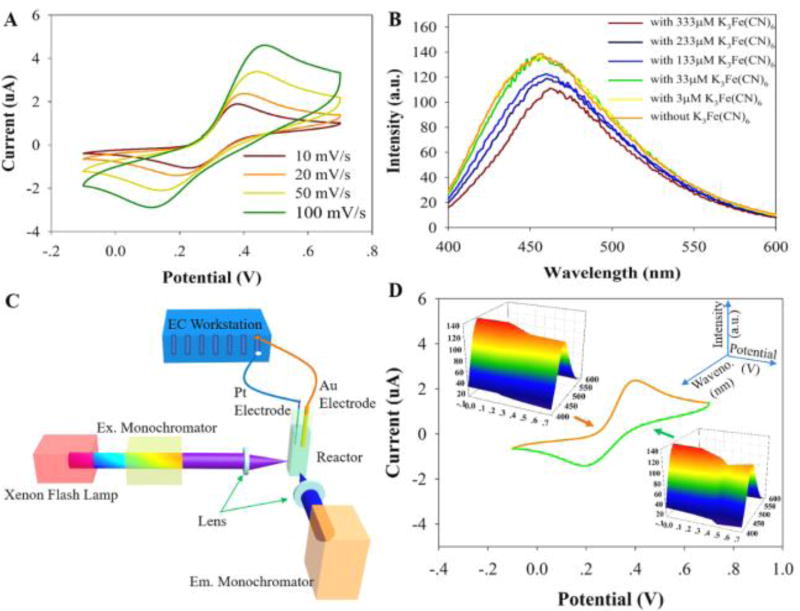
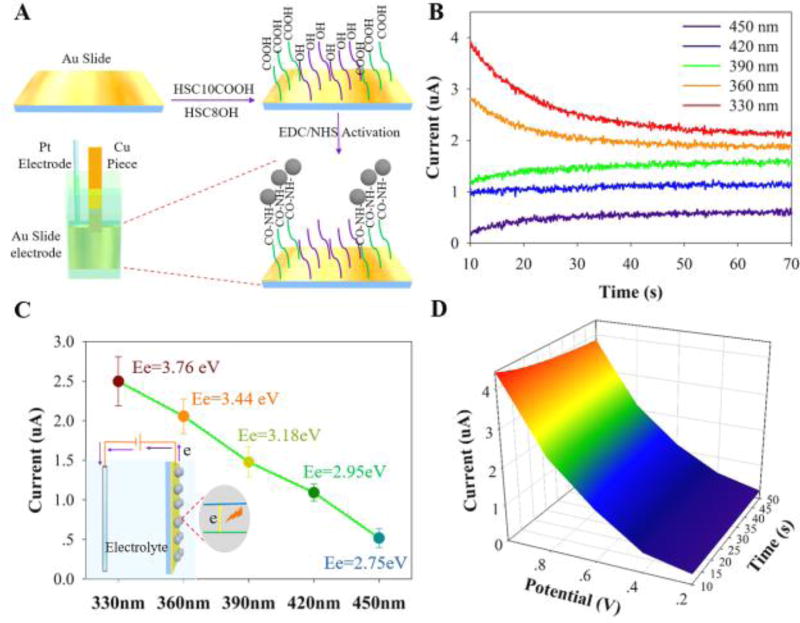
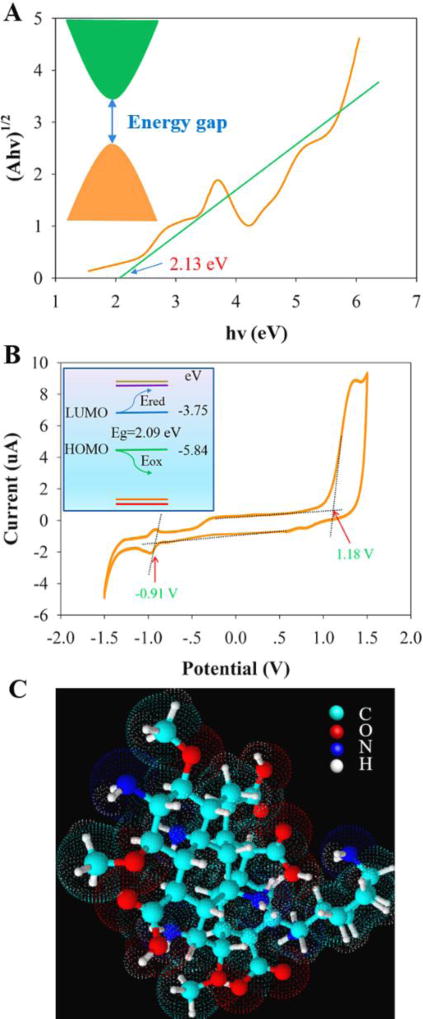
Carbon nanodots (CNDs) have attracted great attention due to their superior solubility, biocompatibility, tunable photoluminescence, and opto-electronic properties. This work describes a new fluorescence-based spectroelectrochemistry approach to simultaneously study the photoluminescence and wavelength dependent photocurrent of microwave synthesized CNDs. The fluorescence of CNDs shows selective quenching upon a reversible redox couple, ferricyanide/ferrocyanide, reaction during cyclic voltammetry. The CND modified gold slide electrode demonstrates wavelength dependent photocurrent generation during the fluorescence-electrochemical study, suggesting the potential application of CNDs in photoelectronics. UV-Vis absorption and electrochemistry are used to quantify the energy gap of the CNDs, and then to calibrate a Hückel model for CNDs' electronic energy levels. The Hückel (or tight binding) model treatment of an individual CND as a molecule combines the conjugated π states (C[double bond, length as m-dash]C) with the functional groups (C[double bond, length as m-dash]O, C-O, and COOH) associated with the surface electronic states. This experimental and theoretical investigation of CNDs provides a new perspective on the optoelectronic properties of CNDs and should aid in their development for practical use in biomedicine, chemical sensing, and photoelectric devices.


Figures

Figure 1
Figure 1
The CNDs are characterized using different techniques: A) transmission electron micrograph (scale bar is 20 nm), B) atomic force microscopy profile of CNDs distributed on a mica surface, C) Fourier transform infrared spectrum, D) X-ray photoelectron spectrum (C1 signal), E) Raman spectrum, F) X-ray diffraction data, and G) UV-Vis absorption spectrum of CNDs.
Figure 2
Figure 2
(A) Fluorescence emission spectra of CNDs in deionized water. (B, C) Confocal images of HepG2 cells that are cultured with CNDs (0.3 mg/mL) for 24 hours; taken at 330 nm excitation. All of the images have a scale bar of 20 µm. (D, E) Confocal images as in panels B and C, but with 450 nm excitation. (F) Calculation of chromaticity coordinates with the emission results under excitation wavelengths of 330 and 450 nm.
Figure 3
Figure 3
(A) Cyclic voltammogram (CV) of a mixture of 333 µM K4Fe(CN)6 and 0.1 M KCl solution between −0.1 V and 0.7 V at 10, 20, 50 and 100 mV/s scan rates. (B) Fluorescence spectrum of solution including 50 µg/mL CNDs and 0.1 M KCl after addition of K3Fe(CN)6 with different concentrations (3, 33, 133, 233, and 333 µM). (C) Schematic view of the setup used for coupling electrochemistry with a fluorescence spectrophotometer. (D) CV of 333 µM K4Fe(CN)6 in 0.1 M KCl between −0.1 V and 0.7 V at scan rate of 20 mV/s with the inserted three-dimensional spectra of fluorescence signal of CNDs during the CV experiment (solution includes 50 µg/mL CNDs, 333 µM K4Fe(CN)6, and 0.1 M KCl).
Figure 4
Figure 4
(A) Illustration of the protocol for the self-assembled monolayer (SAM) formation and CNDs immobilization on the gold slide electrode. Note that the fluoro-electrochemical setup is the same as that in Figure 3C except the gold electrode was changed into the immobilized CNDs gold slide electrode which is electrically connected through a piece of copper tape. (B) Chronoamperometry (CA) photocurrent measurements of CNDs immobilized on the electrode at an applied voltage of 0.8 V. The different irradiation wavelengths are shown in the legend, ranging from 330–450 nm. (C) The long time photocurrent of the CND films is plotted for the different incident wavelengths, with photon energy, Ee=hc/λ, indicated. The inset shows a schematic of photocurrent generation of CNDs upon excitation. (D) The chronoamperometry measurement with different applied bias potentials of the gold slide electrode with CNDs immobilization under an incident wavelength of 330 nm.
Figure 5
Figure 5
(A) UV-Vis absorption spectrum of the CNDs used to estimate the optical band gap (E0). (B) A cyclic voltammogram of the CNDs is shown, and the inset illustrates its relation to the energy levels. (C) A proposed molecule-like structure (with a formula C36H58N6O11) of individual CNDs based on the characterization results.

References

    1. Zhu S, Meng Q, Wang L, Zhang J, Song Y, Jin H, Zhang K, Sun H, Wang H, Yang B. Angewandte Chemie International Edition. 2013;52:3953–3957. - PubMed
    1. Lim SY, Shen W, Gao Z. Chemical Society Reviews. 2015;44:362–381. - PubMed
    1. Zheng XT, Ananthanarayanan A, Luo KQ, Chen P. Small. 2015;11:1620–1636. - PubMed
    1. Wang Y, Hu A. Journal of Materials Chemistry C. 2014;2:6921–6939.
    1. Li X, Rui M, Song J, Shen Z, Zeng H. Advanced Functional Materials. 2015;25:4929–4947.