

Validation of the Dominant Sequence Paradigm and Role of Dynamic Contrast-enhanced Imaging in PI-RADS Version 2
- PMID: 28727501
- PMCID: PMC5708285
- DOI: 10.1148/radiol.2017161316
Validation of the Dominant Sequence Paradigm and Role of Dynamic Contrast-enhanced Imaging in PI-RADS Version 2
Abstract
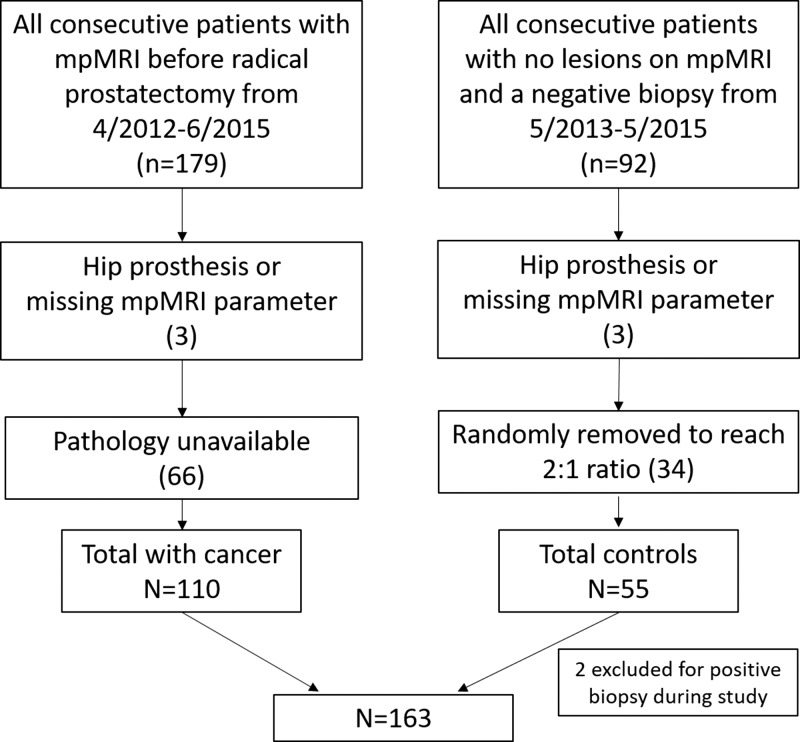
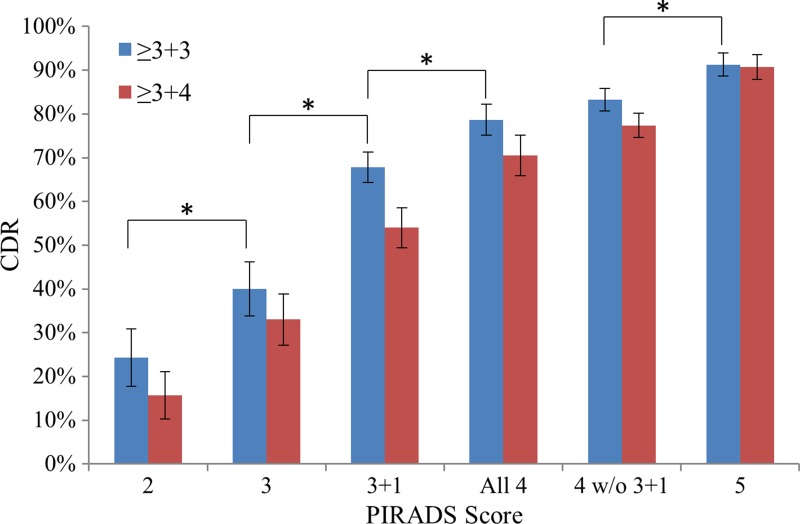
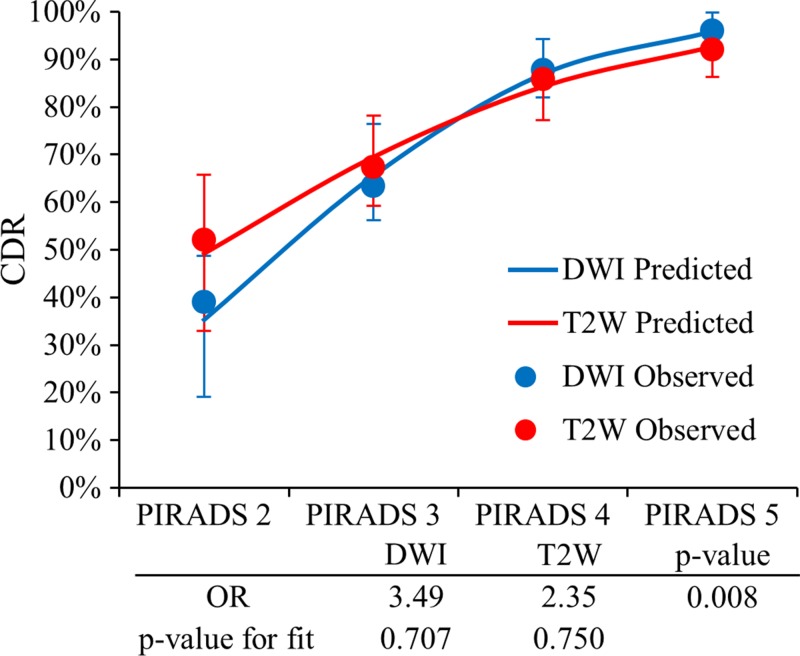
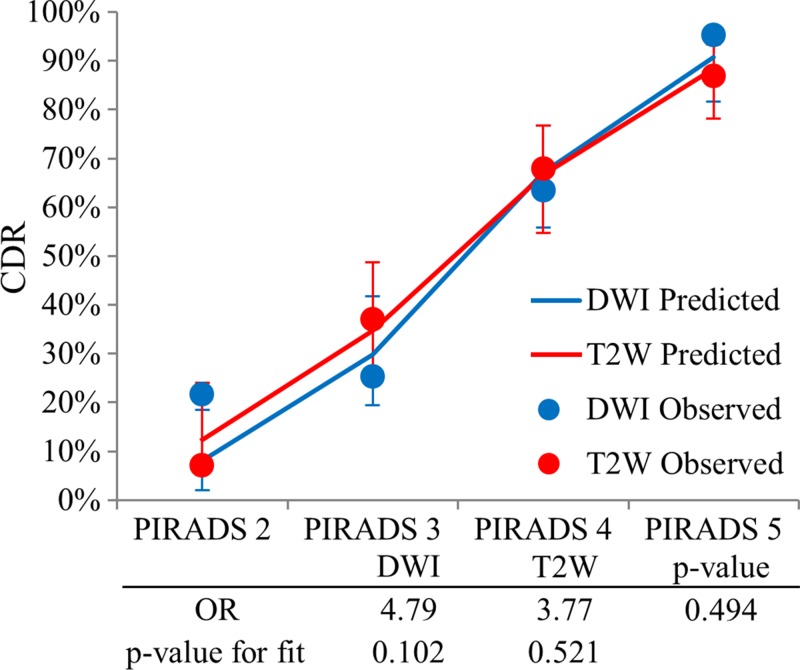
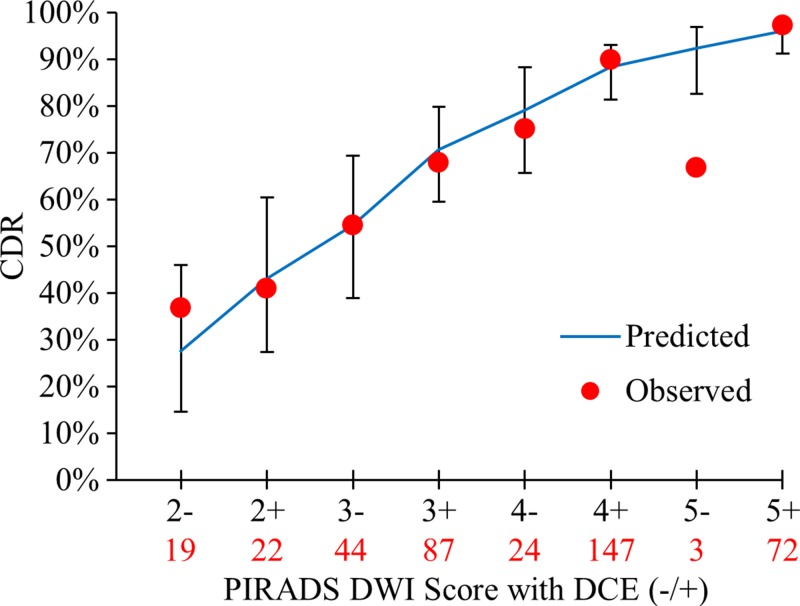
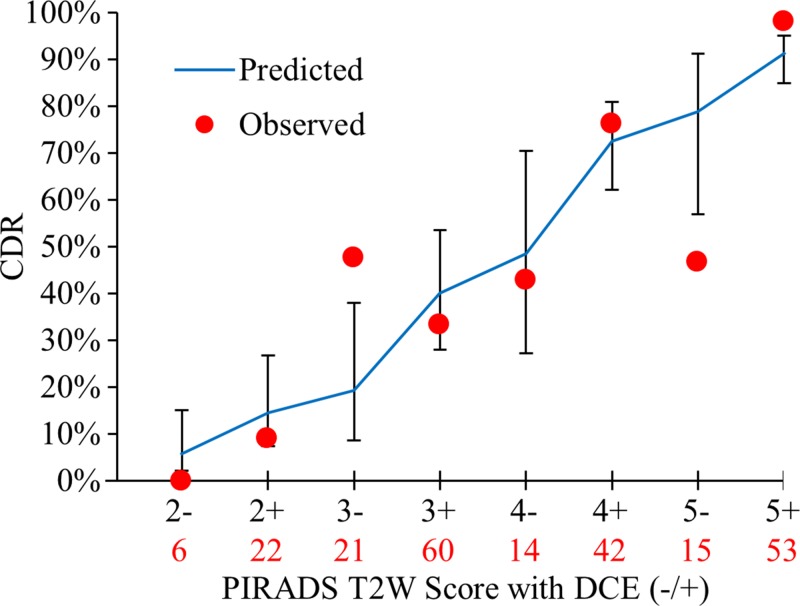
Purpose To validate the dominant pulse sequence paradigm and limited role of dynamic contrast material-enhanced magnetic resonance (MR) imaging in the Prostate Imaging Reporting and Data System (PI-RADS) version 2 for prostate multiparametric MR imaging by using data from a multireader study. Materials and Methods This HIPAA-compliant retrospective interpretation of prospectively acquired data was approved by the local ethics committee. Patients were treatment-naïve with endorectal coil 3-T multiparametric MR imaging. A total of 163 patients were evaluated, 110 with prostatectomy after multiparametric MR imaging and 53 with negative multiparametric MR imaging and systematic biopsy findings. Nine radiologists participated in this study and interpreted images in 58 patients, on average (range, 56-60 patients). Lesions were detected with PI-RADS version 2 and were compared with whole-mount prostatectomy findings. Probability of cancer detection for overall, T2-weighted, and diffusion-weighted (DW) imaging PI-RADS scores was calculated in the peripheral zone (PZ) and transition zone (TZ) by using generalized estimating equations. To determine dominant pulse sequence and benefit of dynamic contrast-enhanced (DCE) imaging, odds ratios (ORs) were calculated as the ratio of odds of cancer of two consecutive scores by logistic regression. Results A total of 654 lesions (420 in the PZ) were detected. The probability of cancer detection for PI-RADS category 2, 3, 4, and 5 lesions was 15.7%, 33.1%, 70.5%, and 90.7%, respectively. DW imaging outperformed T2-weighted imaging in the PZ (OR, 3.49 vs 2.45; P = .008). T2-weighted imaging performed better but did not clearly outperform DW imaging in the TZ (OR, 4.79 vs 3.77; P = .494). Lesions classified as PI-RADS category 3 at DW MR imaging and as positive at DCE imaging in the PZ showed a higher probability of cancer detection than did DCE-negative PI-RADS category 3 lesions (67.8% vs 40.0%, P = .02). The addition of DCE imaging to DW imaging in the PZ was beneficial (OR, 2.0; P = .027), with an increase in the probability of cancer detection of 15.7%, 16.0%, and 9.2% for PI-RADS category 2, 3, and 4 lesions, respectively. Conclusion DW imaging outperforms T2-weighted imaging in the PZ; T2-weighted imaging did not show a significant difference when compared with DW imaging in the TZ by PI-RADS version 2 criteria. The addition of DCE imaging to DW imaging scores in the PZ yields meaningful improvements in probability of cancer detection. © RSNA, 2017 An earlier incorrect version of this article appeared online. This article was corrected on July 27, 2017. Online supplemental material is available for this article.
Figures
References
-
- American College of Radiology . MR Prostate Imaging Reporting and Data System version 2.0. Reston, Va: American College of Radiology, 2015.
-
- Vaché T, Bratan F, Mège-Lechevallier F, Roche S, Rabilloud M, Rouvière O. Characterization of prostate lesions as benign or malignant at multiparametric MR imaging: comparison of three scoring systems in patients treated with radical prostatectomy. Radiology 2014;272(2):446–455. - PubMed
-
- Delongchamps NB, Rouanne M, Flam T, et al. . Multiparametric magnetic resonance imaging for the detection and localization of prostate cancer: combination of T2-weighted, dynamic contrast-enhanced and diffusion-weighted imaging. BJU Int 2011;107(9):1411–1418. - PubMed
-
- Akin O, Sala E, Moskowitz CS, et al. . Transition zone prostate cancers: features, detection, localization, and staging at endorectal MR imaging. Radiology 2006;239(3):784–792. - PubMed
-
- Hoeks CM, Hambrock T, Yakar D, et al. . Transition zone prostate cancer: detection and localization with 3-T multiparametric MR imaging. Radiology 2013;266(1):207–217. - PubMed
Publication types
MeSH terms
Substances
Grants and funding
LinkOut - more resources
Full Text Sources
Other Literature Sources
Medical
Research Materials
Miscellaneous
