

Non-Small Cell Lung Cancer Radiogenomics Map Identifies Relationships between Molecular and Imaging Phenotypes with Prognostic Implications
- PMID: 28727543
- PMCID: PMC5749594
- DOI: 10.1148/radiol.2017161845
Non-Small Cell Lung Cancer Radiogenomics Map Identifies Relationships between Molecular and Imaging Phenotypes with Prognostic Implications
Abstract
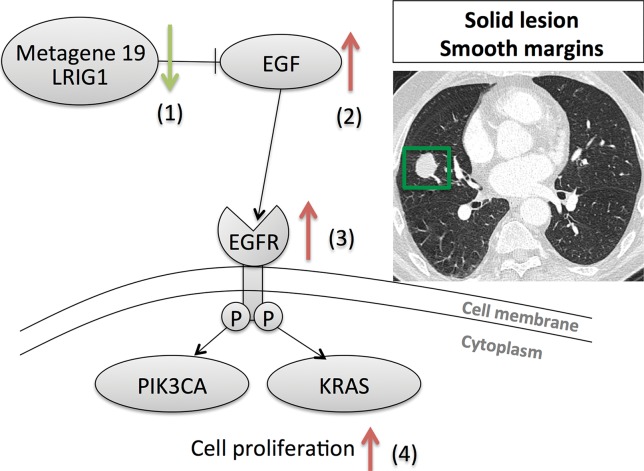
Purpose To create a radiogenomic map linking computed tomographic (CT) image features and gene expression profiles generated by RNA sequencing for patients with non-small cell lung cancer (NSCLC). Materials and Methods A cohort of 113 patients with NSCLC diagnosed between April 2008 and September 2014 who had preoperative CT data and tumor tissue available was studied. For each tumor, a thoracic radiologist recorded 87 semantic image features, selected to reflect radiologic characteristics of nodule shape, margin, texture, tumor environment, and overall lung characteristics. Next, total RNA was extracted from the tissue and analyzed with RNA sequencing technology. Ten highly coexpressed gene clusters, termed metagenes, were identified, validated in publicly available gene-expression cohorts, and correlated with prognosis. Next, a radiogenomics map was built that linked semantic image features to metagenes by using the t statistic and the Spearman correlation metric with multiple testing correction. Results RNA sequencing analysis resulted in 10 metagenes that capture a variety of molecular pathways, including the epidermal growth factor (EGF) pathway. A radiogenomic map was created with 32 statistically significant correlations between semantic image features and metagenes. For example, nodule attenuation and margins are associated with the late cell-cycle genes, and a metagene that represents the EGF pathway was significantly correlated with the presence of ground-glass opacity and irregular nodules or nodules with poorly defined margins. Conclusion Radiogenomic analysis of NSCLC showed multiple associations between semantic image features and metagenes that represented canonical molecular pathways, and it can result in noninvasive identification of molecular properties of NSCLC. Online supplemental material is available for this article.
Figures


Comment in
-
Radiogenomics Map: A Novel Approach for Noninvasive Identification of Molecular Properties?Radiology. 2017 Dec;285(3):1060-1061. doi: 10.1148/radiol.2017171819. Radiology. 2017. PMID: 29155644 No abstract available.
-
Radiogenomics as association between non-invasive imaging features and molecular genomics of lung cancer.Ann Transl Med. 2018 Dec;6(23):447. doi: 10.21037/atm.2018.11.17. Ann Transl Med. 2018. PMID: 30603635 Free PMC article. No abstract available.
References
-
- Travis WD, Brambilla E, Nicholson AG, et al. . The 2015 World Health Organization classification of lung tumors: impact of genetic, clinical and radiologic advances since the 2004 classification. J Thorac Oncol 2015;10(9):1243–1260. - PubMed
-
- Lee HJ, Kim YT, Kang CH, et al. . Epidermal growth factor receptor mutation in lung adenocarcinomas: relationship with CT characteristics and histologic subtypes. Radiology 2013;268(1):254–264. - PubMed
MeSH terms
Substances
Grants and funding
LinkOut - more resources
Full Text Sources
Other Literature Sources
Medical
Miscellaneous
