

Benign and tumor parenchyma metabolomic profiles affect compensatory renal growth in renal cell carcinoma surgical patients
- PMID: 28727768
- PMCID: PMC5519040
- DOI: 10.1371/journal.pone.0180350
Benign and tumor parenchyma metabolomic profiles affect compensatory renal growth in renal cell carcinoma surgical patients
Abstract
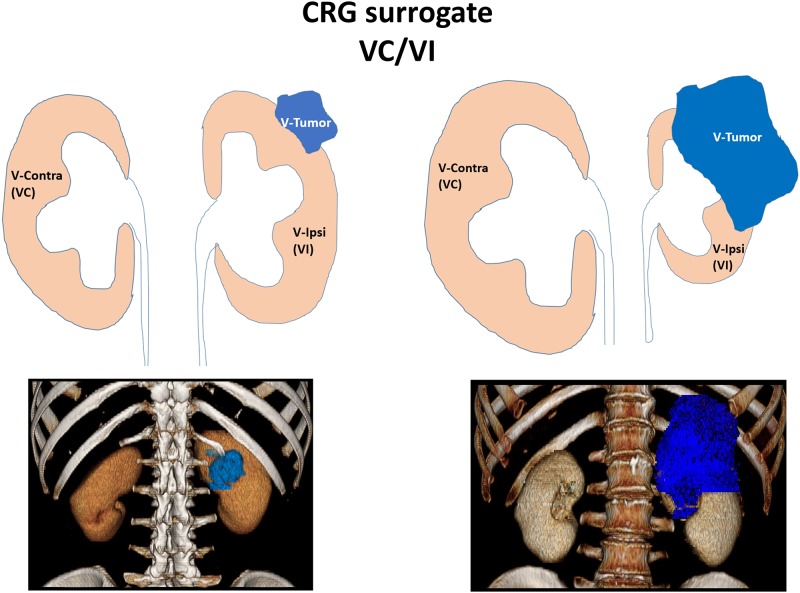
Background and objectives: Pre-operative kidney volume is an independent predictor of glomerular filtration rate in renal cell carcinoma patients. Compensatory renal growth (CRG) can ensue prior to nephrectomy in parallel to tumor growth and benign parenchyma loss. We aimed to test whether renal metabolite abundances significantly associate with CRG, suggesting a causative relationship.
Design, setting, participants, and measurements: Tissue metabolomics data from 49 patients, with a median age of 60 years, were previously collected and the pre-operative fold-change of their contra to ipsi-lateral benign kidney volume served as a surrogate for their CRG. Contra-lateral kidney volume fold-change within a 3.3 +/- 2.1 years follow-up interval was used as a surrogate for long-term CRG. Using a multivariable statistical model, we identified metabolites whose abundances significantly associate with CRG.
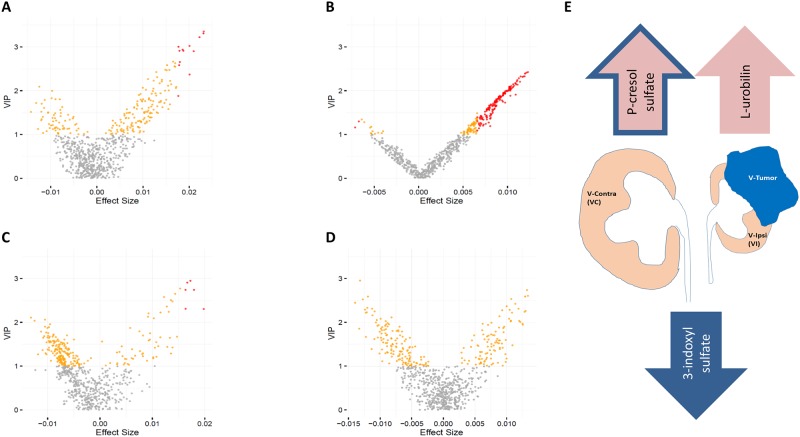
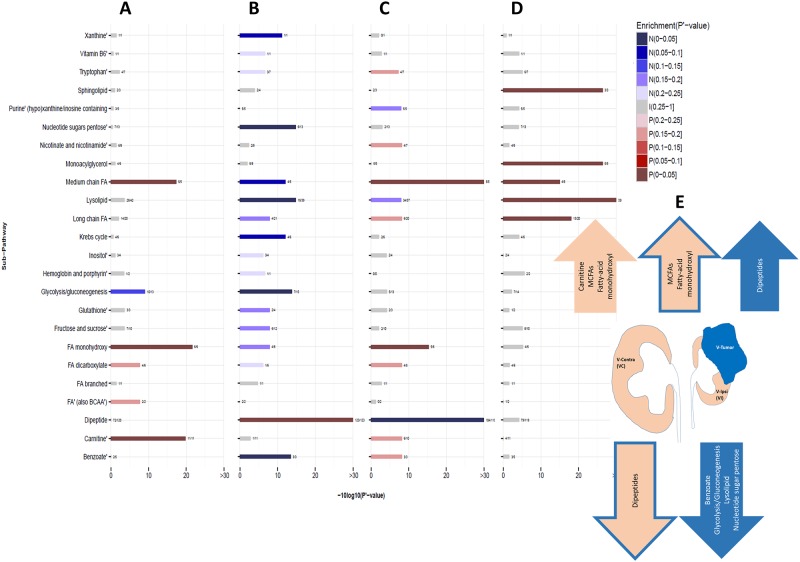
Results: Our analysis found 13 metabolites in the benign (e.g. L-urobilin, Variable Influence in Projection, VIP, score = 3.02, adjusted p = 0.017) and 163 metabolites in the malignant (e.g. 3-indoxyl-sulfate, VIP score = 1.3, adjusted p = 0.044) tissues that significantly associate with CRG. Benign/tumor fold change in metabolite abundances revealed three additional metabolites with that significantly positively associate with CRG (e.g. p-cresol sulfate, VIP score = 2.945, adjusted p = 0.033). At the pathway level, we show that fatty-acid oxidation is highly enriched with metabolites whose benign tissue abundances strongly positively associate with CRG, both pre-operatively and long term, whereas in the tumor tissue significant enrichment of dipeptides and benzoate (positive association), glycolysis/gluconeogenesis, lysolipid and nucleotide sugar pentose (negative associations) sub-pathways, were observed.
Conclusion: These data suggest that specific biological processes in the benign as well as in the tumor parenchyma strongly influence compensatory renal growth.
Conflict of interest statement
Figures
References
-
- Gong IH, Hwang J, Choi DK, Lee SR, Hong YK, Hong JY, et al. Relationship among total kidney volume, renal function and age. J Urol. 2012;187(1):344–9. doi: 10.1016/j.juro.2011.09.005 . - DOI - PubMed
-
- Jeon HG, Gong IH, Hwang JH, Choi DK, Lee SR, Park DS. Prognostic significance of preoperative kidney volume for predicting renal function in renal cell carcinoma patients receiving a radical or partial nephrectomy. BJU Int. 2012;109(10):1468–73. doi: 10.1111/j.1464-410X.2011.10531.x . - DOI - PubMed
-
- Song T, Fu L, Huang Z, He S, Zhao R, Lin T, et al. Change in renal parenchymal volume in living kidney transplant donors. Int Urol Nephrol. 2014;46(4):743–7. doi: 10.1007/s11255-013-0592-y . - DOI - PubMed
-
- Funahashi Y, Hattori R, Yamamoto T, Kamihira O, Sassa N, Gotoh M. Relationship between renal parenchymal volume and single kidney glomerular filtration rate before and after unilateral nephrectomy. Urology. 2011;77(6):1404–8. doi: 10.1016/j.urology.2010.03.063 . - DOI - PubMed
-
- Jeon HG, Choo SH, Sung HH, Jeong BC, Seo SI, Jeon SS, et al. Small tumour size is associated with new-onset chronic kidney disease after radical nephrectomy in patients with renal cell carcinoma. Eur J Cancer. 2014;50(1):64–9. doi: 10.1016/j.ejca.2013.08.018 . - DOI - PubMed
MeSH terms
Grants and funding
LinkOut - more resources
Full Text Sources
Other Literature Sources
Medical
