. 2017 Jul 19;95(2):281-296.e6.
doi: 10.1016/j.neuron.2017.06.026.

Loss of TMEM106B Ameliorates Lysosomal and Frontotemporal Dementia-Related Phenotypes in Progranulin-Deficient Mice

Affiliations

Loss of TMEM106B Ameliorates Lysosomal and Frontotemporal Dementia-Related Phenotypes in Progranulin-Deficient Mice

Zoe A Klein et al. Neuron. .

Abstract

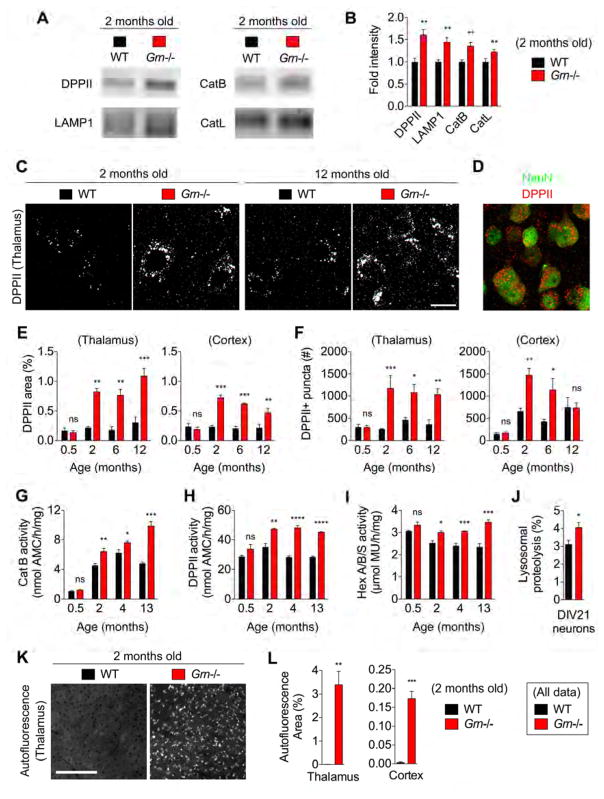
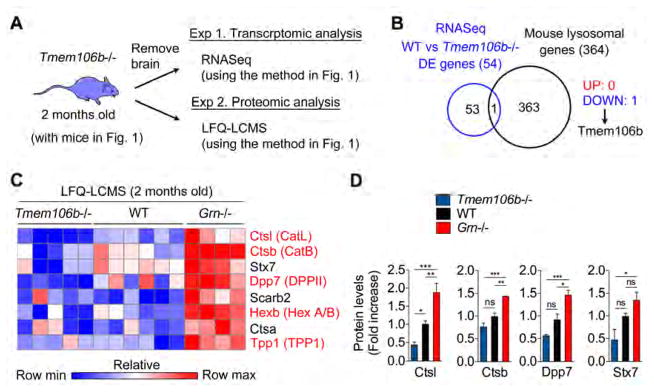
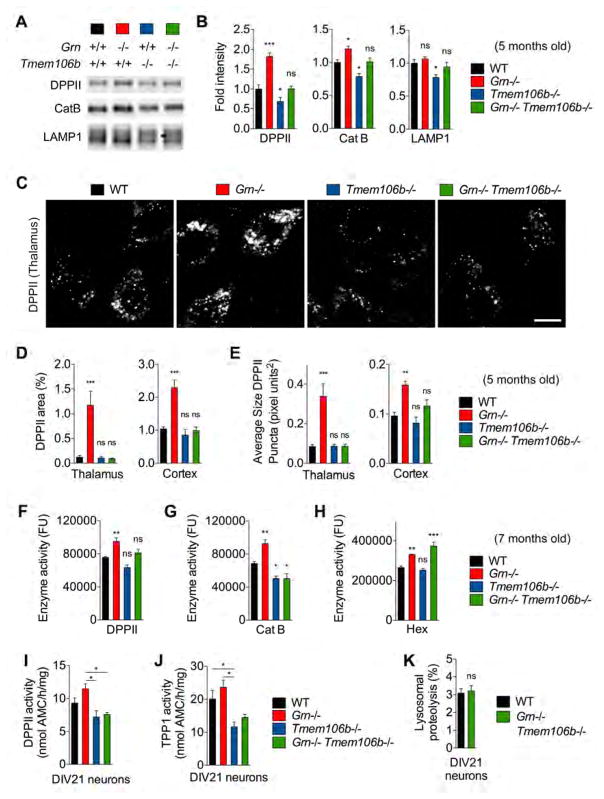
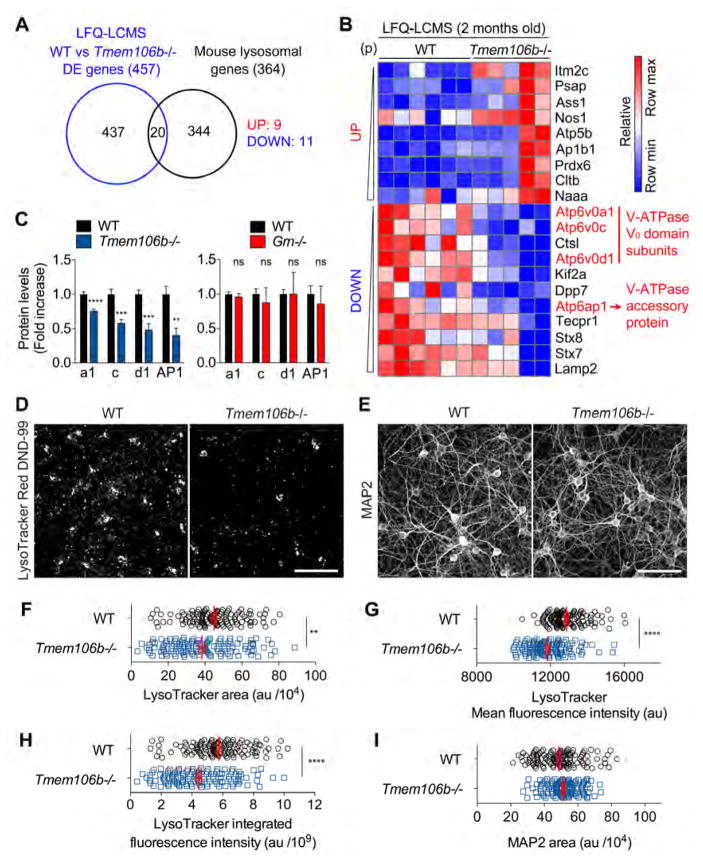
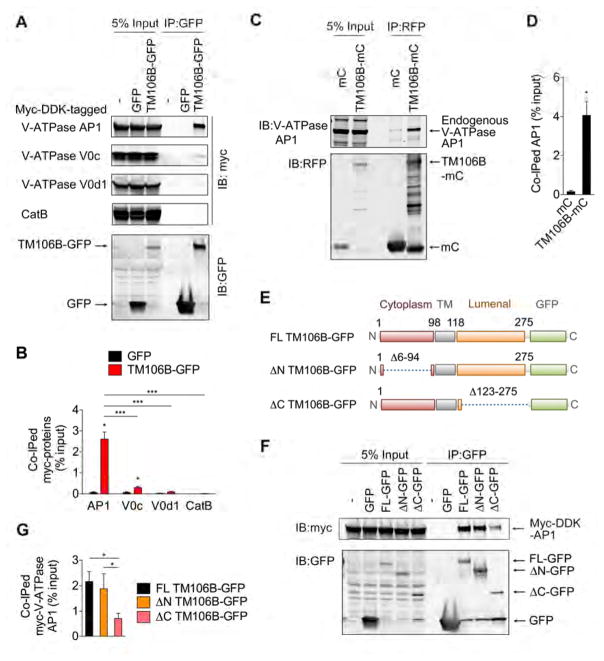
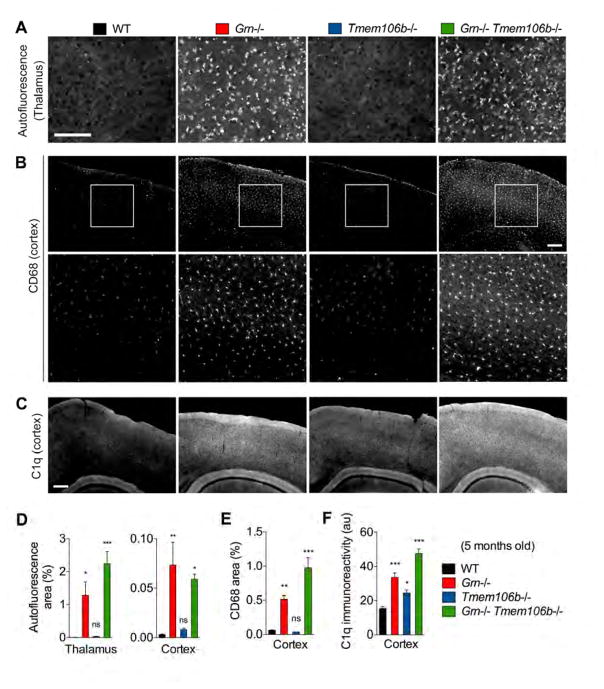
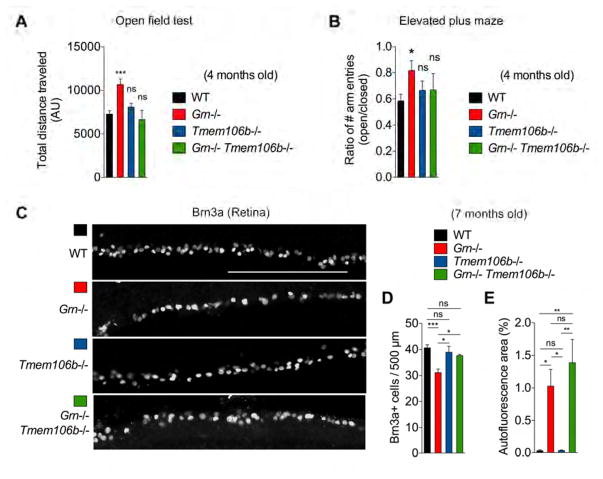
Progranulin (GRN) and TMEM106B are associated with several common neurodegenerative disorders including frontotemporal lobar degeneration (FTLD). A TMEM106B variant modifies GRN-associated FTLD risk. However, their functional relationship in vivo and the mechanisms underlying the risk modification remain unclear. Here, using transcriptomic and proteomic analyses with Grn-/- and Tmem106b-/- mice, we show that, while multiple lysosomal enzymes are increased in Grn-/- brain at both transcriptional and protein levels, TMEM106B deficiency causes reduction in several lysosomal enzymes. Remarkably, Tmem106b deletion from Grn-/- mice normalizes lysosomal protein levels and rescues FTLD-related behavioral abnormalities and retinal degeneration without improving lipofuscin, C1q, and microglial accumulation. Mechanistically, TMEM106B binds vacuolar-ATPase accessory protein 1 (AP1). TMEM106B deficiency reduces vacuolar-ATPase AP1 and V0 subunits, impairing lysosomal acidification and normalizing lysosomal protein levels in Grn-/- neurons. Thus, Grn and Tmem106b genes have opposite effects on lysosomal enzyme levels, and their interaction determines the extent of neurodegeneration.

Keywords: Progranulin; TMEM106B; dementia; frontotemporal lobar degeneration; lysosome; retinal degradation; vacuolar ATPase.


Figures

Figure 1
Figure 1. Transcriptomics and proteomics analyses reveal global changes in the lysosomal pathway in Grn−/− mice
(A) Diagram showing the experimental procedures of transcriptomic and proteomic analyses using WT and Grn−/− animals. (B) Gene Ontology (GO) analysis of RNASeq and LFQ-LCMS dataset using KEGG pathways featuring the 3 pathways that reached significance (p < 0.05 after Bonferroni correction). Lysosome is most significantly enriched pathway in both datasets. (C) Venn diagrams showing the overlap between differentially expressed (DE) genes identified by RNASeq or LFQ-LCMS and mouse lysosomal genes. (D) Heatmap from Gene-E showing the common 24 upregulated and 5 downregulated genes identified in (C) using RNASeq dataset (P < 0.05 FDR, ranked by p value). Relative scale is represented below. Data are row-normalized. (E) Heatmap from Gene-E showing the common 17 upregulated and 2 downregulated genes identified in (C) using LFQ-LCMS dataset (P < 0.05, ranked by p value). Relative scale is represented below. Data are row-normalized.
Figure 2
Figure 2. PGRN deficiency causes early and sustained lysosomal enzyme dysregulation
(A) Representative immunoblots with anti-DPPII, LAMP1, CatB, and CatL antibodies using 2-month-old WT and Grn−/− mice. (B) Quantification of immunoblots from (A). Mean ± sem, n = 5–7/group, *p < 0.05, **p < 0.01, ***p < 0.001; Unpaired T-test. (C) Representative confocal images of thalamus stained with anti-DPPII antibody at 2 months and 12 months of age. Bar, 6 μm. (D) A representative confocal image of double immunostaining using anti-DPPII and anti-NeuN antibodies. (E) Quantification of DPPII-immunoreactive area (%) in thalamus and cortex of P15 and 2-, 6-, and 12-month-old WT and Grn−/− mice. Mean ± sem, n = 3–5/group, *p < 0.05, **p < 0.01, ***p < 0.001; One-way ANOVA comparing WT vs. Grn−/− at 2 months, 6 months, and 12 months separately with Sidak’s post hoc multiple comparisons test. (F) Quantification of the number of DPPII-positive puncta in thalamus and cortex of P15 and 2-, 6-, and 12-month-old WT and Grn−/− mice. Mean ± sem, n = 3–5/group, *p < 0.05, **p < 0.01, ***p < 0.001; One-way ANOVA comparing WT vs. Grn−/− at 2 months, 6 months, and 12 months separately with Sidak’s post hoc multiple comparisons test. (G) CatB activity using WT and Grn−/− brain lysates at P15 and 2, 4, and 13 months of age. Mean ± sem, n = 4/group, *p < 0.05, **p < 0.01, ***p < 0.001; Unpaired T-test. (H) DPPII activity using WT and Grn−/− brain lysates at P15 and 2, 4, and 13 months of age. Mean ± sem, n = 4/group, *p < 0.05, **p < 0.01, ***p < 0.001; Unpaired T-test. (I) Hex A/B/S activity using WT and Grn−/− brain lysates at P15 and 2, 4, and 13 months of age. Mean ± sem, n = 4/group, *p < 0.05, **p < 0.01, ***p < 0.001; Unpaired T-test. (J) Lysosomal proteolysis (%) in DIV21 WT and Grn−/− cortical neurons. Mean ± sem, n = 8–16 embryos from 2–5 mice/group, *p < 0.05; Unpaired T-test. (K) Representative images of autofluorescence using 488 nm excitation in thalamus of 2-month-old WT and Grn−/− mice. Bar, 50 μm (L) Quantification of fractional area (%) occupied by autofluorescent puncta measured in (K). Mean ± sem, n = 4–5/group, *p < 0.05, **p < 0.01, ***p < 0.001; Unpaired T-test.
Figure 3
Figure 3. LFQ-LCMS analysis reveals bidirectional control of the lysosome in Tmem106b−/− vs. Grn−/− mice
(A) Diagram showing the experimental procedures of transcriptomic and proteomic analyses using Tmem106b−/− animals. (B) Venn diagram showing the overlap between differentially expressed (DE) genes (WT vs Tmem106b−/−) identified by RNASeq and mouse lysosomal genes. (C) Heatmap prepared in Gene-E demonstrating a pattern of bidirectional control of the lysosome in Tmem106b−/− vs. Grn−/− as compared to WT at 2 months of age. Relative scale is shown below. Data is row-normalized. (D) Bar graphs generated from LFQ-LCMS analysis. Mean ± sem, *p < 0.05, **p < 0.01, ***p < 0.001; One-way ANOVA with Dunnett’s post hoc test.
Figure 4
Figure 4. Tmem106b deletion rescues lysosomal enzyme dysregulation in Grn−/− mice
(A) Representative immunoblots with anti-DPPII, LAMP1, and CatB antibodies using total forebrain lysates from 5-month-old WT, Grn−/−, Tmem106b−/−, and Grn−/− Tmem106b−/− mice. (B) Quantification of immunoblots from (A). Mean ± sem, n = 5–8/genotype, *p < 0.05, **p < 0.01, ***p < 0.001; One-way ANOVA with Dunnett’s post hoc test. (C) Representative confocal images of thalamus and cortex in WT, Grn−/−, Tmem106b−/− and Grn−/− Tmem106b−/− mice stained with anti-DPPII antibody at 5 months of age. Bar, 6 μm. (D) Quantification of DPPII-immunoreactive area (%) in thalamus and cortex of 5-month-old WT, Grn−/−, Tmem106b−/−, and Grn−/− Tmem106b−/− mice. Mean ± sem, n = 5/genotype, *p < 0.05, **p < 0.01, ***p < 0.001; One-way ANOVA with Dunnett’s post hoc test. (E) Quantification of the average size of DPPII-positive puncta in thalamus and cortex of 5-month-old WT, Grn−/−, Tmem106b−/−, and Grn−/− Tmem106b−/− mice. Mean ± sem, n = 5/genotype, *p < 0.05, **p < 0.01, ***p < 0.001; One-way ANOVA with Dunnett’s post hoc test. (F) DPPII activity using 7-month-old WT, Grn−/−, Tmem106b−/−, and Grn−/− Tmem106b−/− brain lysates. Mean ± sem, n = 3–4/genotype, *p < 0.05, **p < 0.01, ***p < 0.001; One-way ANOVA with Tukey’s post hoc test. (G) CatB activity using 7-month-old WT, Grn−/−, Tmem106b−/−, and Grn−/− Tmem106b−/− brain lysates. Mean ± sem, n = 3–4/genotype, *p < 0.05, **p < 0.01, ***p < 0.001; One-way ANOVA with Tukey’s post hoc test. (H) Hex A/B/S activity using 7-month-old WT, Grn−/−, Tmem106b−/−, and Grn−/− Tmem106b−/− brain lysates. Mean ± sem, n = 3–4/genotype, *p < 0.05, **p < 0.01, ***p < 0.001; One-way ANOVA with Tukey’s post hoc test. (I) DPPII activity using DIV21 WT, Grn−/−, Tmem106b−/−, and Grn−/− Tmem106b−/− cortical neurons. Mean ± sem, n = 6–13 embryos from 2–4 mice/genotype, *p < 0.05; One-way ANOVA with Tukey’s post hoc test. (J) TPP1 activity using DIV21 WT, Grn−/−, Tmem106b−/−, and Grn−/− Tmem106b−/− cortical neurons. Mean ± sem, n = 6–13 embryos from 2–4 mice/genotype, *p < 0.05; One-way ANOVA with Tukey’s post hoc test. (K) Lysosomal proteolysis (%) of DIV21 WT and Grn−/− Tmem106b−/− cortical neurons. Mean ± sem, n = 7–16 embryos from 2–5 mice/genotype, *p < 0.05; Unpaired T-test. This experiment was performed simultaneously with Fig. 2J. The WT group value is therefore identical to Fig. 2J.
Figure 5
Figure 5. TMEM106B deficiency causes impairment in lysosomal acidification
(A) Venn diagram showing the overlap between differentially expressed (DE) genes (WT vs Tmem106b−/−) identified by LFQ-LCMS and mouse lysosomal genes. (B) Heatmap from Gene-E showing the common 9 upregulated and 11 downregulated genes identified in (A) using LFQ-LCMS dataset (P < 0.05, ranked by p value). Relative scale is represented below. Data are row-normalized. (C) Bar graphs generated from LFQ-LCMS analysis. Mean ± sem. **p < 0.01, ***p < 0.001, ****p < 0.0001. (D) Representative images of WT and Tmem106b−/− primary cultured cortical neurons stained with LysoTracker Red DND-99. Bar, 100 μm. (E) Representative images of WT and Tmem106b−/− primary cultured cortical neurons stained with anti-MAP2 antibody. Bar, 100 μm. (F) A representative result of quantification of LysoTracker-Red-DND-99-positive area in WT and Tmem106b−/− cortical neurons. Mean ± sem, n = 120 sites (from 30 wells)/group, **p < 0.01; Unpaired T-test. Similar results are obtained from 3 independent experiments. (G) A representative result of quantification of mean fluorescence intensity within LysoTracker-positive area of WT and Tmem106b−/− cortical neurons. Mean ± sem, n = 120 sites (from 30 wells)/group, ****p < 0.0001; Unpaired T-test. Similar results are obtained from 3 independent experiments. (H) A representative result of quantification of integrated fluorescence intensity of LysoTracker-positive area in WT and Tmem106b−/− cortical neurons. Mean ± sem, n = 120 sites (from 30 wells)/group, ****p < 0.0001; Unpaired T-test. Similar results are obtained from 3 independent experiments. (I) A representative result of quantification of MAP2-positive area in WT and Tmem106b−/− cortical neurons. Mean ± sem, n = 120 sites (from 30 wells)/group. Similar results are obtained from 3 independent experiments.
Figure 6
Figure 6. TMEM106B interacts with V-ATPase AP1
(A) Representative blots of co-IP experiments using HEK293T cells expressing GFP or TMEM106B-GFP (TM106B-GFP), together with Myc-DDK-tagged V-ATPase AP1, V0c, and V0d1 and CatB. (B) Quantification of co-IP in (A). Mean ± sem, n = 3, *p < 0.05; Unpaired T-test (compared with GFP), ***p < 0.01; One-way ANOVA with Tukey’s post hoc test (between TM106B-GFP IPs). (C) Representative blots using of co-IP experiments using HEK293T cells expressing mCherry (mC) or TMEM106B-mCherry (TM106B-mC). (D) Quantification of co-IP in (C). Mean ± sem, n = 4, *p < 0.05; Unpaired T-test. (E) Schematic drawing of full-length (FL) TM106B-GFP and TM106B-GFP lacking aa6–94 (ΔN) and aa123–275 (ΔC). (F) Representative blots of co-IP experiments using HEK293T cells expressing GFP, FL TMEM106B-GFP,ΔN TMEM106B-GFP, or ΔC TMEM106B-GFP, together with Myc-DDK-tagged V-ATPase AP1. (G) Quantification of co-IP in (F). Mean ± sem, n = 3, *p < 0.05; One-way ANOVA with Tukey’s post hoc test.
Figure 7
Figure 7. TMEM106B deficiency does not revert accumulation of lipofuscin, CD68-positive microglia, and complement C1q in Grn−/− mice
(A) Representative images of autofluorescence using 488 nm excitation in thalamus of 5-month-old WT, Grn−/−, Tmem106b−/−, and Grn−/− Tmem106b−/− mice. Bar, 50 μm (B) Representative images of WT, Grn−/−, Tmem106b−/−, and Grn−/− Tmem106b−/− cortex stained for CD68 at 5 months of age. Bottom panels are high-magnification of white square area in top panels. Bar, 200 μm. (C) Representative images of WT, Grn−/−, Tmem106b−/−, and Grn−/− Tmem106b−/− cortex stained for C1q at 5 months of age. Bar, 200 μm. (D) Quantification of autofluorescent puncta area (%) in 5-month-old WT, Grn−/−, Tmem106b−/−, Grn−/− Tmem106b−/− mice. Mean ± sem, n = 4–5/group, *p < 0.05, **p < 0.01, ***p < 0.001; One-way ANOVA with Dunnett’s post hoc test. (E) Quantification of C1q-immunoreactivity in WT, Grn−/−, Tmem106b−/−, and Grn−/− Tmem106b−/− cortex. Mean ± sem, n = 3–5/group. *p < 0.05, ***p < 0.001; One-way ANOVA with Dunnett’s post hoc test. (F) Quantification of CD68-immunoreactive area (%) in WT, Grn−/−, Tmem106b−/−, and Grn−/− Tmem106b−/− cortex. Mean ± sem, n = 3–5/group. *p < 0.05, ***p < 0.001; One-way ANOVA with Dunnett’s post hoc test.
Figure 8
Figure 8. Tmem106b deletion rescues behavioral abnormalities and retinal ganglion cell degeneration in Grn−/− mice
(A) Open field test results at 4 months of age showing total distance traveled, a measure of locomotor activity. Mean ± sem, n = 8–27/genotype, *p < 0.05, **p < 0.01, ***p < 0.001; One-way ANOVA with Dunnett’s post hoc test. (B) Elevated plus maze at 4 months of age showing ratio of number of entries into the open vs. closed arms of the maze. Mean ± sem, n = 8–27/genotype, ***p < 0.001; One-way ANOVA with Dunnett’s post hoc test. (C) Representative images of WT, Grn−/−, Tmem106b−/−, and Grn−/− Tmem106b−/− mouse retinas stained for Brn3a at 7 months of age. Bar, 250 μm. (D) Quantification of Brn3a-positive cells/500 μm in 7-month-old WT, Grn−/−, Tmem106b−/−, and Grn−/− Tmem106b−/− retinas. Measurements were taken in the central regions of the retina. Mean ± sem, n = 3–4/group. *p < 0.05, ***p < 0.001; One-way ANOVA with Tukey’s multiple comparisons post hoc test. (E) Quantification of autofluorescence area (%) in 7-month-old WT, Grn−/−, Tmem106b−/−, and Grn−/− Tmem106b−/− retinas. Measurements were taken in the central regions of the retina. Mean ± sem, n = 3–4/group. *p < 0.05, ***p < 0.001; One-way ANOVA with Tukey’s multiple comparisons post hoc test.

References

    1. Ahmed Z, Sheng H, Xu YF, Lin WL, Innes AE, Gass J, Yu X, Wuertzer CA, Hou H, Chiba S, et al. Accelerated lipofuscinosis and ubiquitination in granulin knockout mice suggest a role for progranulin in successful aging. Am J Pathol. 2010;177:311–324. - PMC - PubMed
    1. Brady OA, Zheng Y, Murphy K, Huang M, Hu F. The frontotemporal lobar degeneration risk factor, TMEM106B, regulates lysosomal morphology and function. Human molecular genetics. 2013;22:685–695. - PMC - PubMed
    1. Busch JI, Unger TL, Jain N, Tyler Skrinak R, Charan RA, Chen-Plotkin AS. Increased expression of the frontotemporal dementia risk factor TMEM106B causes C9orf72-dependent alterations in lysosomes. Hum Mol Genet. 2016;25:2681–2697. - PMC - PubMed
    1. Cenik B, Sephton CF, Kutluk Cenik B, Herz J, Yu G. Progranulin: a proteolytically processed protein at the crossroads of inflammation and neurodegeneration. J Biol Chem. 2012;287:32298–32306. - PMC - PubMed
    1. Chen-Plotkin AS, Unger TL, Gallagher MD, Bill E, Kwong LK, Volpicelli-Daley L, Busch JI, Akle S, Grossman M, Van Deerlin V, et al. TMEM106B, the risk gene for frontotemporal dementia, is regulated by the microRNA-132/212 cluster and affects progranulin pathways. J Neurosci. 2012;32:11213–11227. - PMC - PubMed